FY2025 Connector Giants: AI Moats, EV Headwinds, and Capital Efficiency
Date : 2026-03-20
Reading : 113
In FY2025, the global electronic connector industry witnessed an unprecedented structural divergence. Rather than moving in tandem with macroeconomic cycles, top-tier players demonstrated a severe polarization in value capture. According to HDIN Research’s latest benchmarking analysis, Amphenol achieved hyper-growth by aggressively anchoring to artificial intelligence (AI) infrastructure; TE Connectivity (TE) showcased immense cash-flow resilience through strategic restructuring; while Korea Electric Terminal (KET) found itself caught in the cyclical "chasm" of the electric vehicle (EV) market.
For institutional investors and supply chain strategists, simply looking at top-line revenue is no longer sufficient. The true differentiators in FY2025 were capital allocation efficiency, geopolitical risk mitigation, and the agility to pivot toward high-margin, non-overlapping strategic moats.
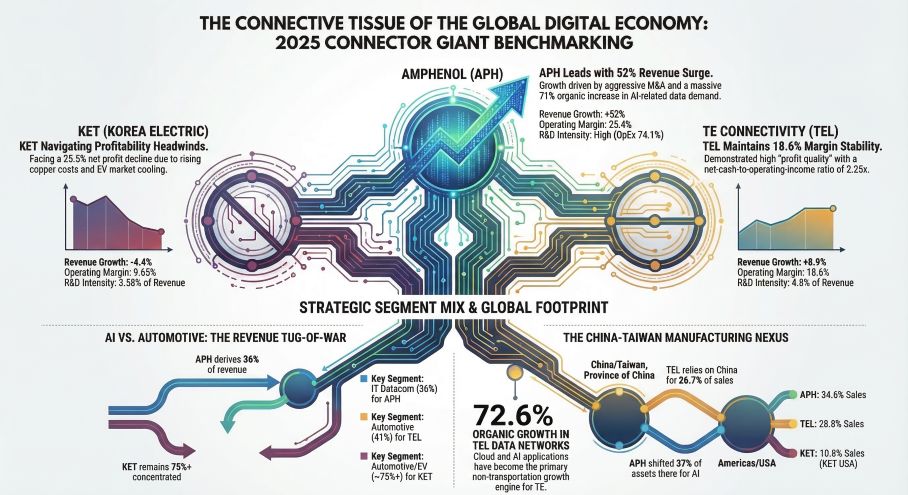
Figure The Connective Tissue of the Global Digital Economy: 2025 Connector Giant Benchmarking
 Sector Positioning: The Polarization of AI and Automotive
The revenue distribution in FY2025 underscores a fundamental shift in industry growth engines, transitioning away from low-margin consumer electronics toward AI data transmission and high-voltage electrified architectures.
Amphenol emerged as the undisputed beneficiary of the AI data center boom. Delivering $23.09 billion in total revenue—a staggering 52% year-over-year surge—the company’s growth was not merely an organic market lift. It was the direct result of a strategic monopoly in high-speed, power, and optical interconnect technologies vital for AI server clusters. The IT Datacom segment alone contributed roughly $4.59 billion in absolute revenue growth.
Conversely, TE Connectivity and KET faced the brunt of automotive and traditional industrial inventory corrections. TE ($17.26 billion in revenue) utilized its diversified "Harsh Environments" portfolio to hedge against auto-sector sluggishness. Its "Digital Data Networks" segment saw a 72.6% organic growth rate, successfully offsetting weaknesses in transportation and sensor verticals. Meanwhile, KET ($1.01 billion in revenue), whose business remains heavily concentrated on the Hyundai-Kia EV supply chain, suffered a 4.4% revenue decline and a sharp 25.5% drop in net profit, exposing the vulnerability of regional dependency amid North American EV market volatility.
Capital Allocation Efficiency and Operational Agility
A deep dive into working capital and organizational structure reveals how these giants extract profit from their revenue streams.
Amphenol’s Decentralized Scale: Despite an aggressive M&A pipeline—deploying $3.8 billion across five acquisitions in 2025 and closing a historic $10.5 billion deal for CommScope in early 2026—Amphenol’s operational efficiency remains industry-leading. By empowering a decentralized, entrepreneurial management structure, Amphenol optimized its Days Sales Outstanding (DSO) to 66 days and Days Inventory Outstanding (DIO) to 77 days. Improving turnover metrics during a period of 52% revenue growth signals absolute pricing power and superior supply chain elasticity in short-lead-time AI markets.
TE Connectivity’s Margin Defense: TE’s strategic pivot focused on internal optimization. Following a massive footprint consolidation into two primary segments (Transportation and Industrial), TE achieved a remarkable operating cash flow-to-net income ratio of 2.25x. This means every dollar of TE’s $1.84 billion net profit is backed by more than two dollars of cash, highlighting world-class inventory management and a highly "clean" quality of earnings.
KET’s Prudent Capital Structure: While facing severe profitability compression due to rising copper prices and EV slowdowns, KET maintained a highly defensive balance sheet with a liability ratio of just 25.4%. However, its heavy investments in precision mold centers have yet to translate into pricing leverage, indicating a lag in digital transformation ROI.
Cyclical Headwinds and Geopolitical Friction
Beyond market demand, macroeconomic realities are capping profitability ceilings. Geopolitical friction has evolved from a theoretical risk into a tangible compliance cost.
For Amphenol, aggressive expansion in APAC manufacturing footprints to support AI demand was met with rising regulatory friction, evidenced by a $100 million discrete tax expense in China. Similarly, TE Connectivity is actively restructuring procurement channels to circumvent US-China tariff impacts, which threatens near-term gross margins.
Furthermore, the implementation of the OECD Pillar Two global minimum tax heavily distorted TE’s bottom line, spiking its effective tax rate to 42.5% in FY2025 due to valuation allowance adjustments in its Swiss subsidiaries. The era of relying on geographic tax arbitrages is rapidly closing, forcing connector giants to rely solely on technological premiums.
HDIN Viewpoint: Navigating the Margin vs. Scale Paradigm
From the perspective of HDIN Research, the connector industry is entering a phase where "growth at all costs" poses hidden balance sheet risks.
While Amphenol’s Book-to-Bill ratio (1.12) signals tremendous revenue visibility for FY2026, its balance sheet now carries $10.57 billion in goodwill (29% of total assets). The shift from qualitative to quantitative goodwill impairment testing indicates that the premium cushion is thinning; any friction in integrating CommScope could trigger massive write-downs and pressure its interest coverage ratio.
TE Connectivity offers the safest harbor for capital, boasting an interest coverage ratio of 41.7x and unmatched scale-driven cost advantages. For KET, the strategic imperative over the next 3-5 years is clear: it must diversify beyond its captive Korean automotive ecosystem and secure a second growth curve in semiconductor equipment or energy storage systems (ESS) to survive the ongoing EV transition chasm.
Presentation Download
Click the PDF download link under “Related Topics” to access the presentation of this report.
Click this link to watch the YouTube video.
About HDIN Research Profile:
HDIN Research focuses on providing market consulting services. As an independent third-party consulting firm, it is committed to providing in-depth market research and analysis reports.
Website: www.hdinresearch.com
E-mail: sales@hdinresearch.com
For institutional investors and supply chain strategists, simply looking at top-line revenue is no longer sufficient. The true differentiators in FY2025 were capital allocation efficiency, geopolitical risk mitigation, and the agility to pivot toward high-margin, non-overlapping strategic moats.
Figure The Connective Tissue of the Global Digital Economy: 2025 Connector Giant Benchmarking
Sector Positioning: The Polarization of AI and AutomotiveThe revenue distribution in FY2025 underscores a fundamental shift in industry growth engines, transitioning away from low-margin consumer electronics toward AI data transmission and high-voltage electrified architectures.
Amphenol emerged as the undisputed beneficiary of the AI data center boom. Delivering $23.09 billion in total revenue—a staggering 52% year-over-year surge—the company’s growth was not merely an organic market lift. It was the direct result of a strategic monopoly in high-speed, power, and optical interconnect technologies vital for AI server clusters. The IT Datacom segment alone contributed roughly $4.59 billion in absolute revenue growth.
Conversely, TE Connectivity and KET faced the brunt of automotive and traditional industrial inventory corrections. TE ($17.26 billion in revenue) utilized its diversified "Harsh Environments" portfolio to hedge against auto-sector sluggishness. Its "Digital Data Networks" segment saw a 72.6% organic growth rate, successfully offsetting weaknesses in transportation and sensor verticals. Meanwhile, KET ($1.01 billion in revenue), whose business remains heavily concentrated on the Hyundai-Kia EV supply chain, suffered a 4.4% revenue decline and a sharp 25.5% drop in net profit, exposing the vulnerability of regional dependency amid North American EV market volatility.
Capital Allocation Efficiency and Operational Agility
A deep dive into working capital and organizational structure reveals how these giants extract profit from their revenue streams.
Amphenol’s Decentralized Scale: Despite an aggressive M&A pipeline—deploying $3.8 billion across five acquisitions in 2025 and closing a historic $10.5 billion deal for CommScope in early 2026—Amphenol’s operational efficiency remains industry-leading. By empowering a decentralized, entrepreneurial management structure, Amphenol optimized its Days Sales Outstanding (DSO) to 66 days and Days Inventory Outstanding (DIO) to 77 days. Improving turnover metrics during a period of 52% revenue growth signals absolute pricing power and superior supply chain elasticity in short-lead-time AI markets.
TE Connectivity’s Margin Defense: TE’s strategic pivot focused on internal optimization. Following a massive footprint consolidation into two primary segments (Transportation and Industrial), TE achieved a remarkable operating cash flow-to-net income ratio of 2.25x. This means every dollar of TE’s $1.84 billion net profit is backed by more than two dollars of cash, highlighting world-class inventory management and a highly "clean" quality of earnings.
KET’s Prudent Capital Structure: While facing severe profitability compression due to rising copper prices and EV slowdowns, KET maintained a highly defensive balance sheet with a liability ratio of just 25.4%. However, its heavy investments in precision mold centers have yet to translate into pricing leverage, indicating a lag in digital transformation ROI.
Cyclical Headwinds and Geopolitical Friction
Beyond market demand, macroeconomic realities are capping profitability ceilings. Geopolitical friction has evolved from a theoretical risk into a tangible compliance cost.
For Amphenol, aggressive expansion in APAC manufacturing footprints to support AI demand was met with rising regulatory friction, evidenced by a $100 million discrete tax expense in China. Similarly, TE Connectivity is actively restructuring procurement channels to circumvent US-China tariff impacts, which threatens near-term gross margins.
Furthermore, the implementation of the OECD Pillar Two global minimum tax heavily distorted TE’s bottom line, spiking its effective tax rate to 42.5% in FY2025 due to valuation allowance adjustments in its Swiss subsidiaries. The era of relying on geographic tax arbitrages is rapidly closing, forcing connector giants to rely solely on technological premiums.
HDIN Viewpoint: Navigating the Margin vs. Scale Paradigm
From the perspective of HDIN Research, the connector industry is entering a phase where "growth at all costs" poses hidden balance sheet risks.
While Amphenol’s Book-to-Bill ratio (1.12) signals tremendous revenue visibility for FY2026, its balance sheet now carries $10.57 billion in goodwill (29% of total assets). The shift from qualitative to quantitative goodwill impairment testing indicates that the premium cushion is thinning; any friction in integrating CommScope could trigger massive write-downs and pressure its interest coverage ratio.
TE Connectivity offers the safest harbor for capital, boasting an interest coverage ratio of 41.7x and unmatched scale-driven cost advantages. For KET, the strategic imperative over the next 3-5 years is clear: it must diversify beyond its captive Korean automotive ecosystem and secure a second growth curve in semiconductor equipment or energy storage systems (ESS) to survive the ongoing EV transition chasm.
Presentation Download
Click the PDF download link under “Related Topics” to access the presentation of this report.
Click this link to watch the YouTube video.
About HDIN Research Profile:
HDIN Research focuses on providing market consulting services. As an independent third-party consulting firm, it is committed to providing in-depth market research and analysis reports.
Website: www.hdinresearch.com
E-mail: sales@hdinresearch.com