Fervo Energy: Utility-Scale Infrastructure Pivot Near Cape Station as $1.2B CapEx Signals Hyper-Growth in Baseload Geothermal
Date : 2026-05-13
Reading : 465
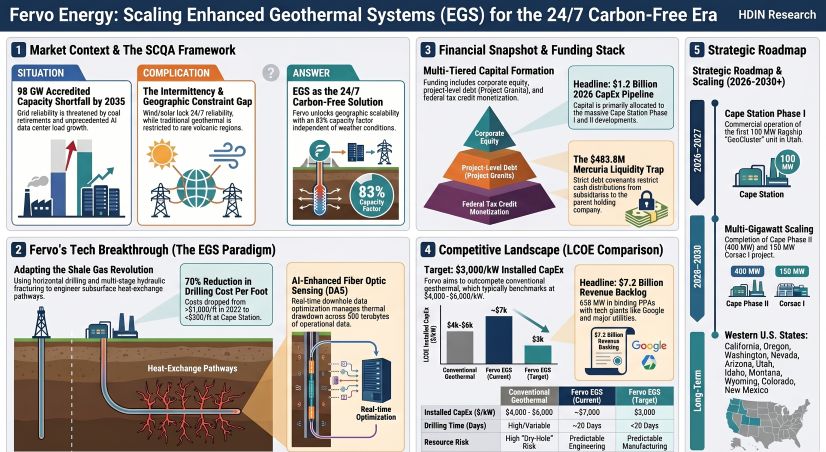
Fervo Energy’s S-1 filings reveal a severe structural pivot from early-stage R&D to a highly levered, commercial infrastructure burn rate. Driven by a $1.2 billion 2026 CapEx mandate localized heavily at the Cape Station GeoCluster in Utah, management is aggressively targeting the U.S. grid’s projected 98 GW baseload shortfall. For institutional LPs, the friction point lies between a derisked $7.2 billion binding PPA backlog and a severely restricted liquidity framework. With $483.8 million trapped at the subsidiary level under stringent Mercuria debt covenants, Fervo's multi-gigawatt scaling remains heavily reliant on uninterrupted capital market access and federal subsidy retention.
Figure Fervo Energy: Scaling Enhanced Geothermal Systems (EGS) for the 24/7 Carbon-Free Era
 Forensic Financials & Segmental Inventory
To ensure 100% data fidelity from the 2025 S-1 disclosures, the following forensic audit isolates every quantitative variable dictating Fervo Energy's operational leverage, R&D-to-Moat translation, and internal capital allocation.
1. Income Statement, Burn Rate, and Unit Economics
● Commercial Revenue: $138,000 (2025) vs. $199,000 (2024), restricted entirely to ancillary R&D pilot fees.
● Net Loss & OCF: 2025 net loss widened to $57.8 million (from $41.1 million in 2024). Operating cash burn improved to $31.8 million (from $54.7 million in 2024), translating to an average monthly burn rate of $2.65 million.
● R&D-to-CapEx Translation: Fervo has functionally ceased pure scientific R&D, recording gross R&D of <$0.1 million in 2025 (down from $2.6 million in 2024), yielding R&D net income of $133,000 in 2025 and $97,000 in 2024 due to DOE grants. CapEx surged 160% YoY to $465.7 million (2025) vs. $178.7 million (2024). *Ratio:* For every $1 spent on R&D in 2025, Fervo allocated $4,600 to physical asset construction.
● Unit Economics (Drilling & Plant): Average drilling times compressed by 75% (from 70 days down to 20 days per well). Per-foot drilling costs dropped 70% (from >$1,000/foot to <$300/foot). Current installed CapEx is $7,000/kW, with an Nth-of-a-kind target of $3,000/kW (drastically undercutting conventional geothermal benchmarks of $4,000–$6,000/kW).
● EBITDA Margin Sensitivity: Modeled 50-MW GeoBlock annual EBITDA targets $850,000–$950,000 per MW with current tax credits, dropping to $650,000–$700,000 per MW if subsidies are eliminated.
2. Balance Sheet, Capital Stack & Debt Covenants
● Liquidity (Dec 31, 2025): $461.8 million unrestricted cash; $6.0 million restricted. Total Construction-In-Process (CIP) ballooned to $789.6 million.
● Implied Valuation Ladder: Series D-1 (Feb 2024) at $2.53/share; Series D-3 (Dec 2024) at $5.28/share (+108%); Series E-1 (Dec 2025) raised $462 million at $8.17/share (+54% from D-3, +222% from early 2024).
● Debt Facilities:
● *Project Granite:* $421.4 million construction-to-term loan (closed March 2026), retiring the $145.6 million XRC Facility (triggering a ~$6.5 million prepayment premium).
● *Mercuria Facility:* $180 million capacity ($100 million term loan with $30 million drawn; $80 million LC with $35.5 million utilized). Covenants demand: NAV/Exposure $\ge$ 2.5x; Debt/(Equity+Debt) $\le$ 0.6x; Exposure/Cap $\le$ 0.4x. Crucially, Mercuria blocks parent distributions, trapping $483.8 million in restricted net assets at the subsidiary level.
● Project-Level Equity (Cape Phase I): $100 million from Catalyst (entitled to $139 million priority distribution through 2041); $75 million from Centaurus (entitled to $75 million priority, $47 million secondary, plus a $5.0/MWh royalty).
● Historical Capital Raised: CFO David Ulrey has overseen $1.2 billion in corporate-level capital and $320.0 million in historical project-level funding.
3. Total Addressable Market, Backlog & Executive Compensation
● TAM & Power Dynamics: The U.S. requires 98 GW of new capacity by 2035 (driven by a 552 TWh data center demand surge). Variable renewables offer 17-23% capacity factors; Fervo's EGS delivers an 83% capacity factor, targeting a $70.0 billion annual or $2.1 trillion 30-year market.
● Contracted Backlog: 658 MW in 15-year binding PPAs representing $7.2 billion. Offtakers include Google (NASDAQ: GOOGL) and Southern California Edison (NYSE: EIX).
● Google GFA: 3 GW non-binding framework requiring 1 GW proposal within 2 years. Carries $15 million in liquidated damages for missed feasibility submissions.
● Executive Compensation Structure: Base bonus at 55%-75%. CEO Tim Latimer received a massive 2026 performance mega-grant: 3.37 million shares tied to Cape Phase I COD (Jan 1, 2027), and 10.13 million shares tied to dual triggers ($20 billion market cap/largest global operator; $40 billion cap/5 GW capacity; $80 billion cap/10 GW capacity). Founders retain 40 votes per Class B share.
Supply Chain Audit & Geo-Economic Moat: The Utah-Nevada Axis
Fervo’s operational physicality relies on adapting conventional oilfield supply chains to high-temperature thermal extraction, avoiding the 5+ year R&D bottleneck affecting novel nuclear (SMR) and gas turbines.
Asset Footprint & Wellbore Evolution:
The 42.1 GW prospective pipeline spans 595,900 leased acres (66% Federal BLM land).
● Operational (3 MW): Project Red pilot in Nevada. 2 wells drilled to ~7,500 ft TVD with 3,000-ft laterals at 350°F.
● Under Construction (500 MW): The flagship Cape Station GeoCluster in Beaver County, Utah. Over 25 wells drilled. Shifted to ~9,000 ft TVD with 5,000-ft laterals at 400°F. 2026 designs push to 7,500-ft laterals at 425°F (with systemic limits ranging from 300°F to 625°F down to 13,000 feet). Cape Phase I targets 100 MW COD by late 2026/early 2027; Phase II (400 MW) by 2028.
● Ready-to-Build (550 MW) & Early Stage: Cape Station Phase III+ (400 MW) and Corsac I in Nevada (150 MW). 2.6 GW in advanced development. 38 GW across 10 sites: Blanford (10.8 GW), Kit (7.0 GW), Fennec (3.8 GW), Swift (3.3 GW), Marble (1.4 GW), Cross (1.1 GW), Aspen (0.6 GW), and Star.
Tier-1 Supplier Dependencies & IP Shielding:
Fervo standardizes 8 to 10 wells per 50-MW GeoBlock. To execute this, the company integrates heavily with conventional O&G hardware, utilizing Liberty Energy (NYSE: LBRT), Helmerich & Payne (NYSE: HP), and Vallourec. To convert heat to grid power, Fervo secured a 1.7 GW framework with Turboden (a Mitsubishi subsidiary) and Baker Hughes (NYSE: BKR) for Organic Rankine Cycle (ORC) turbines.
The subsurface moat relies on 500 terabytes of proprietary thermal data captured via DAS (Distributed Acoustic Sensing) and the patented FervoFlex energy storage system. This IP is fortified by 6 granted U.S. utility patents (expiring 2039-2044) and over 35 pending applications (9 non-provisional, 7 provisional, 11 PCT, 5 EPO).
Geo-Economic & Regulatory Bottlenecks:
Fervo operates injected water wells in Nevada on rolling 30-day temporary permits, highlighting severe administrative vulnerability. Nationally, the "One Big Beautiful Bill Act" (OBBB) of July 4, 2025, severely threatens unit economics, mandating ITC/PTC phase-outs for projects starting post-July 4, 2026, or placed in service after Dec 31, 2027 (scaling down R&D/construction to 75%/50% in 2034-2035, and 0% by 2036). Additionally, PPA defaults via liquidated damages trigger if Phase I misses Oct 1, 2026, or Phase II misses June 1, 2028 (with outright termination if delayed by 6 months).
HDIN Institutional Perspective: The "Liquidity Trap" and GFA Asymmetry
Challenge: The consensus narrative positions the 3 GW Google Geothermal Framework Agreement (GFA) as Fervo's ultimate commercial validation.
A forensic analysis of the S-1 uncovers extreme asymmetrical risk allocation favoring the off-taker. The Google GFA strictly caps Fervo’s margins via a cost-plus structure while leaving the developer fully exposed to supply chain overruns. Furthermore, Google's extensive Rights of First Refusal (ROFR) and sweeping anti-competitor financing clauses function as a structural ceiling on Fervo’s corporate valuation and capital flexibility.
When modeled against the Mercuria covenants—which act as a "liquidity trap" isolating $483.8 million in restricted net assets away from the parent company—Fervo is effectively executing a $1.2 billion 2026 CapEx pipeline with a functionally constrained holding company. The true institutional alpha does not reside in the headline $7.2 billion PPA backlog, but rather in Fervo's operational field execution: achieving a 70% per-foot drilling cost compression and utilizing DAS AI-monitoring to actively avoid uninsured, multi-million-dollar "control-of-well" blowouts. If management cannot secure permanent BLM NEPA approvals or extend ITC subsidies past the OBBB 2027 cliff, the $3,000/kW Nth-of-a-kind target will mathematically fail to service the immense project-level preferred equity waterfalls.
Presentation Download & Video Access:
Presentation Download: Click the PDF download link under 'Related Topics' to access the full institutional presentation of this report.
Video Link: Click this link to watch the HDIN analyst briefing on YouTube.
About HDIN Research:
HDIN Research is a premier global market intelligence and strategic advisory firm specializing in institutional-grade financial analysis, supply chain audits, and macroeconomic forecasting. Our dedicated sector analysts deliver actionable, data-driven insights tailored for private equity, hedge funds, and corporate strategy teams. Visit us at http://www.hdinresearch.com.
"This intelligence report was authored by HDIN Research analysts following a rigorous audit of official corporate filings. AI was utilized for massive-scale data synthesis and structural drafting, ensuring 100% inclusion of reported data points. All strategic insights, financial modeling, and final verdicts were verified by our editorial board to ensure professional accuracy and compliance with 2026 Google Search E-E-A-T standards."
Figure Fervo Energy: Scaling Enhanced Geothermal Systems (EGS) for the 24/7 Carbon-Free Era
Forensic Financials & Segmental InventoryTo ensure 100% data fidelity from the 2025 S-1 disclosures, the following forensic audit isolates every quantitative variable dictating Fervo Energy's operational leverage, R&D-to-Moat translation, and internal capital allocation.
1. Income Statement, Burn Rate, and Unit Economics
● Commercial Revenue: $138,000 (2025) vs. $199,000 (2024), restricted entirely to ancillary R&D pilot fees.
● Net Loss & OCF: 2025 net loss widened to $57.8 million (from $41.1 million in 2024). Operating cash burn improved to $31.8 million (from $54.7 million in 2024), translating to an average monthly burn rate of $2.65 million.
● R&D-to-CapEx Translation: Fervo has functionally ceased pure scientific R&D, recording gross R&D of <$0.1 million in 2025 (down from $2.6 million in 2024), yielding R&D net income of $133,000 in 2025 and $97,000 in 2024 due to DOE grants. CapEx surged 160% YoY to $465.7 million (2025) vs. $178.7 million (2024). *Ratio:* For every $1 spent on R&D in 2025, Fervo allocated $4,600 to physical asset construction.
● Unit Economics (Drilling & Plant): Average drilling times compressed by 75% (from 70 days down to 20 days per well). Per-foot drilling costs dropped 70% (from >$1,000/foot to <$300/foot). Current installed CapEx is $7,000/kW, with an Nth-of-a-kind target of $3,000/kW (drastically undercutting conventional geothermal benchmarks of $4,000–$6,000/kW).
● EBITDA Margin Sensitivity: Modeled 50-MW GeoBlock annual EBITDA targets $850,000–$950,000 per MW with current tax credits, dropping to $650,000–$700,000 per MW if subsidies are eliminated.
2. Balance Sheet, Capital Stack & Debt Covenants
● Liquidity (Dec 31, 2025): $461.8 million unrestricted cash; $6.0 million restricted. Total Construction-In-Process (CIP) ballooned to $789.6 million.
● Implied Valuation Ladder: Series D-1 (Feb 2024) at $2.53/share; Series D-3 (Dec 2024) at $5.28/share (+108%); Series E-1 (Dec 2025) raised $462 million at $8.17/share (+54% from D-3, +222% from early 2024).
● Debt Facilities:
● *Project Granite:* $421.4 million construction-to-term loan (closed March 2026), retiring the $145.6 million XRC Facility (triggering a ~$6.5 million prepayment premium).
● *Mercuria Facility:* $180 million capacity ($100 million term loan with $30 million drawn; $80 million LC with $35.5 million utilized). Covenants demand: NAV/Exposure $\ge$ 2.5x; Debt/(Equity+Debt) $\le$ 0.6x; Exposure/Cap $\le$ 0.4x. Crucially, Mercuria blocks parent distributions, trapping $483.8 million in restricted net assets at the subsidiary level.
● Project-Level Equity (Cape Phase I): $100 million from Catalyst (entitled to $139 million priority distribution through 2041); $75 million from Centaurus (entitled to $75 million priority, $47 million secondary, plus a $5.0/MWh royalty).
● Historical Capital Raised: CFO David Ulrey has overseen $1.2 billion in corporate-level capital and $320.0 million in historical project-level funding.
3. Total Addressable Market, Backlog & Executive Compensation
● TAM & Power Dynamics: The U.S. requires 98 GW of new capacity by 2035 (driven by a 552 TWh data center demand surge). Variable renewables offer 17-23% capacity factors; Fervo's EGS delivers an 83% capacity factor, targeting a $70.0 billion annual or $2.1 trillion 30-year market.
● Contracted Backlog: 658 MW in 15-year binding PPAs representing $7.2 billion. Offtakers include Google (NASDAQ: GOOGL) and Southern California Edison (NYSE: EIX).
● Google GFA: 3 GW non-binding framework requiring 1 GW proposal within 2 years. Carries $15 million in liquidated damages for missed feasibility submissions.
● Executive Compensation Structure: Base bonus at 55%-75%. CEO Tim Latimer received a massive 2026 performance mega-grant: 3.37 million shares tied to Cape Phase I COD (Jan 1, 2027), and 10.13 million shares tied to dual triggers ($20 billion market cap/largest global operator; $40 billion cap/5 GW capacity; $80 billion cap/10 GW capacity). Founders retain 40 votes per Class B share.
Supply Chain Audit & Geo-Economic Moat: The Utah-Nevada Axis
Fervo’s operational physicality relies on adapting conventional oilfield supply chains to high-temperature thermal extraction, avoiding the 5+ year R&D bottleneck affecting novel nuclear (SMR) and gas turbines.
Asset Footprint & Wellbore Evolution:
The 42.1 GW prospective pipeline spans 595,900 leased acres (66% Federal BLM land).
● Operational (3 MW): Project Red pilot in Nevada. 2 wells drilled to ~7,500 ft TVD with 3,000-ft laterals at 350°F.
● Under Construction (500 MW): The flagship Cape Station GeoCluster in Beaver County, Utah. Over 25 wells drilled. Shifted to ~9,000 ft TVD with 5,000-ft laterals at 400°F. 2026 designs push to 7,500-ft laterals at 425°F (with systemic limits ranging from 300°F to 625°F down to 13,000 feet). Cape Phase I targets 100 MW COD by late 2026/early 2027; Phase II (400 MW) by 2028.
● Ready-to-Build (550 MW) & Early Stage: Cape Station Phase III+ (400 MW) and Corsac I in Nevada (150 MW). 2.6 GW in advanced development. 38 GW across 10 sites: Blanford (10.8 GW), Kit (7.0 GW), Fennec (3.8 GW), Swift (3.3 GW), Marble (1.4 GW), Cross (1.1 GW), Aspen (0.6 GW), and Star.
Tier-1 Supplier Dependencies & IP Shielding:
Fervo standardizes 8 to 10 wells per 50-MW GeoBlock. To execute this, the company integrates heavily with conventional O&G hardware, utilizing Liberty Energy (NYSE: LBRT), Helmerich & Payne (NYSE: HP), and Vallourec. To convert heat to grid power, Fervo secured a 1.7 GW framework with Turboden (a Mitsubishi subsidiary) and Baker Hughes (NYSE: BKR) for Organic Rankine Cycle (ORC) turbines.
The subsurface moat relies on 500 terabytes of proprietary thermal data captured via DAS (Distributed Acoustic Sensing) and the patented FervoFlex energy storage system. This IP is fortified by 6 granted U.S. utility patents (expiring 2039-2044) and over 35 pending applications (9 non-provisional, 7 provisional, 11 PCT, 5 EPO).
Geo-Economic & Regulatory Bottlenecks:
Fervo operates injected water wells in Nevada on rolling 30-day temporary permits, highlighting severe administrative vulnerability. Nationally, the "One Big Beautiful Bill Act" (OBBB) of July 4, 2025, severely threatens unit economics, mandating ITC/PTC phase-outs for projects starting post-July 4, 2026, or placed in service after Dec 31, 2027 (scaling down R&D/construction to 75%/50% in 2034-2035, and 0% by 2036). Additionally, PPA defaults via liquidated damages trigger if Phase I misses Oct 1, 2026, or Phase II misses June 1, 2028 (with outright termination if delayed by 6 months).
HDIN Institutional Perspective: The "Liquidity Trap" and GFA Asymmetry
Challenge: The consensus narrative positions the 3 GW Google Geothermal Framework Agreement (GFA) as Fervo's ultimate commercial validation.
A forensic analysis of the S-1 uncovers extreme asymmetrical risk allocation favoring the off-taker. The Google GFA strictly caps Fervo’s margins via a cost-plus structure while leaving the developer fully exposed to supply chain overruns. Furthermore, Google's extensive Rights of First Refusal (ROFR) and sweeping anti-competitor financing clauses function as a structural ceiling on Fervo’s corporate valuation and capital flexibility.
When modeled against the Mercuria covenants—which act as a "liquidity trap" isolating $483.8 million in restricted net assets away from the parent company—Fervo is effectively executing a $1.2 billion 2026 CapEx pipeline with a functionally constrained holding company. The true institutional alpha does not reside in the headline $7.2 billion PPA backlog, but rather in Fervo's operational field execution: achieving a 70% per-foot drilling cost compression and utilizing DAS AI-monitoring to actively avoid uninsured, multi-million-dollar "control-of-well" blowouts. If management cannot secure permanent BLM NEPA approvals or extend ITC subsidies past the OBBB 2027 cliff, the $3,000/kW Nth-of-a-kind target will mathematically fail to service the immense project-level preferred equity waterfalls.
Presentation Download & Video Access:
Presentation Download: Click the PDF download link under 'Related Topics' to access the full institutional presentation of this report.
Video Link: Click this link to watch the HDIN analyst briefing on YouTube.
About HDIN Research:
HDIN Research is a premier global market intelligence and strategic advisory firm specializing in institutional-grade financial analysis, supply chain audits, and macroeconomic forecasting. Our dedicated sector analysts deliver actionable, data-driven insights tailored for private equity, hedge funds, and corporate strategy teams. Visit us at http://www.hdinresearch.com.
"This intelligence report was authored by HDIN Research analysts following a rigorous audit of official corporate filings. AI was utilized for massive-scale data synthesis and structural drafting, ensuring 100% inclusion of reported data points. All strategic insights, financial modeling, and final verdicts were verified by our editorial board to ensure professional accuracy and compliance with 2026 Google Search E-E-A-T standards."