Arm Holdings: Production Silicon Pivot Near East Asia Foundries as 34% R&D Surge Signals Margin Re-calibration
Date : 2026-05-29
Reading : 166
Arm Holdings’ strategic evolution from an intellectual property licensor to a production silicon vendor introduces acute capital intensity, driving FY2026 R&D expenses up 34% to $2.77 billion. While the Armv9 architecture delivers highly accretive price-mix variance, GAAP operating margins have compressed to 18%. For institutional LPs, the primary structural vulnerability extends beyond ecosystem cannibalization. The $8.5 billion SoftBank margin loan—secured by 72% of Arm’s outstanding equity—creates an existential change-of-control overhang, compounded by absolute supply chain concentration in Taiwan, Province of China and U.S. Electronic Design Automation dependencies.
Financials & Segmental Inventory of Arm Holdings
The fundamental unit economics of NASDAQ: ARM are undergoing a massive transition. The company is actively migrating from rigid Technology License Agreements (TLAs) to subscription-based Compute Subsystems (CSS) and direct silicon production. This architectural shift creates significant operating leverage divergence.
Table Quantitative Inventory: FY2025 vs. FY2026 Performance Matrix
Internal Capital Allocation & Price-Mix Variance:
* Per-Capita Productivity Output: Despite engineering headcount scaling to 8,058 (concentrated across Cambridge, San Jose, and India), revenue per employee expanded 6.7% from $481,032 in FY25 to $513,355 in FY26.
* The SoftBank Related-Party Distortion: Top-line growth is heavily subsidized by TYO: 9984. Arm generated $704.4 million in FY26 consulting revenue directly from SoftBank affiliates (a 384% YoY surge from $145.5 million). Furthermore, an FY27 statement of work guarantees an additional fixed payment of $300 million.
* Cash Conversion & Deferred Revenue Liabilities: FY25 Free Cash Flow (FCF) stood at $178 million (Operating Cash Flow of $397 million less $219 million in CAPEX). Contract liabilities expanded from $911 million in FY25 to $1,046 million by the end of FY26, signaling strong pipeline visibility.
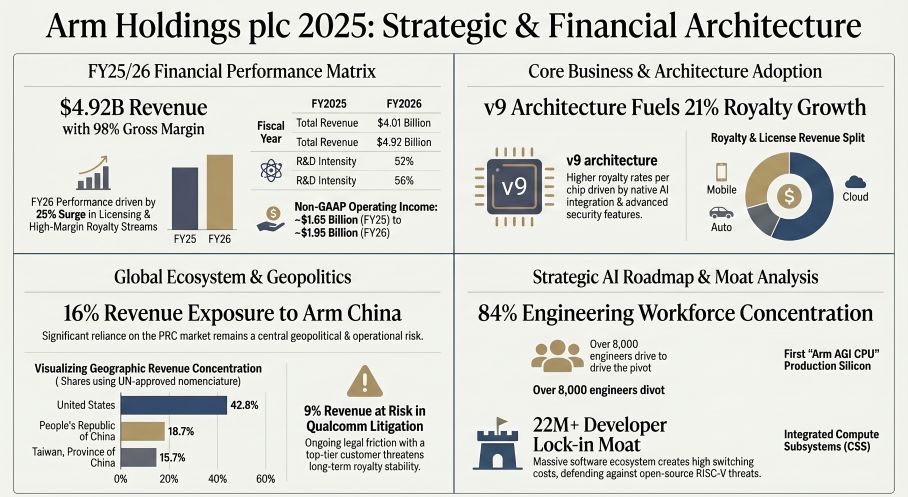
Figure Arm Holdings plc 2025 Strategic & Financial Architecture
 Supply Chain Audit & Geo-Economic Moat: Physicality and Ecosystem Friction
Arm’s ecosystem moat encompasses over 350 billion shipped chips and 22 million software developers. However, its expansion into Cloud AI and Physical AI introduces severe geopolitical and physical supply chain bottlenecks.
* Geographic Foundry & EDA Bottlenecks: Arm's pivot to the Arm AGI CPU—slated for production by the end of calendar year 2026—exposes the company to severe foundry capacity limits in Taiwan, Province of China. Simultaneously, the blueprinting of its IP relies entirely on U.S.-based Electronic Design Automation (EDA) software. The May 2025 Bureau of Industry and Security (BIS) EDA suspension to the People's Republic of China (PRC) temporarily paralyzed distribution, exposing a critical regulatory choke point.
* The Arm China Opacity: The PRC generated $749 million (18.7%) of FY25 revenue. In FY26, Arm Technology (China) Co. Limited—an independent entity where Arm holds only a 10% non-voting stake via Acetone Limited—accounted for 16% of total global revenue and held an outsized $276.2 million in accounts receivable. Under the IP License Agreement (IPLA), Arm bears uncapped indemnification liabilities for third-party infringement claims against PRC end-users.
* Customer Concentration & Litigation Overhang: The top five customers represent 57% of total FY26 revenue. Crucially, NASDAQ: QCOM drives 9% of total revenue but is currently locked in aggressive, multi-front litigation with Arm over the Nuvia Architecture License Agreement (ALA). With a consolidated trial scheduled for Q4 2026, the risk of forced royalty refunds, antitrust regulatory probes, and patent invalidation is material.
HDIN Institutional Perspective
While the consensus models NASDAQ: ARM as an insulated, software-like monopoly, the underlying capital structure tells a different story. The transition to production silicon means Arm is actively cannibalizing its traditional merchant silicon base to capture hyperscaler custom compute budgets. This ecosystem friction is directly catalyzing customer defection to the open-source RISC-V architecture (notably through the August 2023 automotive joint venture).
Furthermore, the balance sheet contradicts the asset-light narrative: Arm carries $1.05 billion in non-cancelable long-term purchase obligations (primarily cloud and EDA), plus a $305 million extension signed in April 2026 extending through 2029. Management is forced into hyper-growth mode to outrun these fixed costs, evidenced by the $265 million acquisition of DreamBig Semiconductor (expected to close Q2 FY2027) and CEO Rene Haas's Value Creation Plan, which strictly requires hitting a $2.0 trillion market cap milestone by 2031. For hedge funds, the spread between GAAP margins (18%) and implied Non-GAAP cash margins (>40% adjusted for $1.05 billion in SBC) offers a distinct Relative Value play against legacy x86 architectures, provided the $8.5 billion SoftBank margin loan does not trigger a catastrophic equity liquidation event.
Presentation Download & Video Access:
Presentation Download: Click the PDF download link under 'Related Topics' to access the full institutional presentation of this report.
Video Link: Click this link to watch the HDIN analyst briefing on YouTube.
About HDIN Research:
HDIN Research is a premier global market intelligence and strategic advisory firm specializing in institutional-grade financial analysis, supply chain audits, and macroeconomic forecasting. Our dedicated sector analysts deliver actionable, data-driven insights tailored for private equity, hedge funds, and corporate strategy teams. Visit us at http://www.hdinresearch.com.
*This intelligence report was authored by HDIN Research analysts following a rigorous audit of official corporate filings. AI was utilized for massive-scale data synthesis and structural drafting, ensuring 100% inclusion of reported data points. All strategic insights, financial modeling, and final verdicts were verified by our editorial board to ensure professional accuracy and compliance with 2026 Google Search E-E-A-T standards.*
Financials & Segmental Inventory of Arm Holdings
The fundamental unit economics of NASDAQ: ARM are undergoing a massive transition. The company is actively migrating from rigid Technology License Agreements (TLAs) to subscription-based Compute Subsystems (CSS) and direct silicon production. This architectural shift creates significant operating leverage divergence.
Table Quantitative Inventory: FY2025 vs. FY2026 Performance Matrix
| Metric | FY2025 (Ended Mar 31, 2025) | FY2026 (Ended Mar 31, 2026) | YoY Delta |
|---|---|---|---|
| Total Revenue | $4,007 Million | $4,920 Million | +23.0% |
| Royalty Revenue | $2,168 Million (54.1%) | $2,613 Million | +21.0% |
| License & Other Revenue | $1,839 Million (45.9%) | $2,307 Million | +25.0% |
| Gross Margin | 97% ($3,886M Gross Profit) | 98% | +100 bps |
| R&D Expense | $2,071 Million (52% of Rev) | $2,776 Million (56% of Rev) | +34.0% |
| GAAP Operating Income (Margin) | $831 Million (21%) | $900 Million (18%) | -300 bps |
| Stock-Based Compensation (SBC) | $820 Million | $1,052 Million | +28.3% |
| Total Engineering Headcount | 6,943 Personnel | 8,058 Personnel (84% of total) | +16.0% |
* Per-Capita Productivity Output: Despite engineering headcount scaling to 8,058 (concentrated across Cambridge, San Jose, and India), revenue per employee expanded 6.7% from $481,032 in FY25 to $513,355 in FY26.
* The SoftBank Related-Party Distortion: Top-line growth is heavily subsidized by TYO: 9984. Arm generated $704.4 million in FY26 consulting revenue directly from SoftBank affiliates (a 384% YoY surge from $145.5 million). Furthermore, an FY27 statement of work guarantees an additional fixed payment of $300 million.
* Cash Conversion & Deferred Revenue Liabilities: FY25 Free Cash Flow (FCF) stood at $178 million (Operating Cash Flow of $397 million less $219 million in CAPEX). Contract liabilities expanded from $911 million in FY25 to $1,046 million by the end of FY26, signaling strong pipeline visibility.
Figure Arm Holdings plc 2025 Strategic & Financial Architecture
Supply Chain Audit & Geo-Economic Moat: Physicality and Ecosystem FrictionArm’s ecosystem moat encompasses over 350 billion shipped chips and 22 million software developers. However, its expansion into Cloud AI and Physical AI introduces severe geopolitical and physical supply chain bottlenecks.
* Geographic Foundry & EDA Bottlenecks: Arm's pivot to the Arm AGI CPU—slated for production by the end of calendar year 2026—exposes the company to severe foundry capacity limits in Taiwan, Province of China. Simultaneously, the blueprinting of its IP relies entirely on U.S.-based Electronic Design Automation (EDA) software. The May 2025 Bureau of Industry and Security (BIS) EDA suspension to the People's Republic of China (PRC) temporarily paralyzed distribution, exposing a critical regulatory choke point.
* The Arm China Opacity: The PRC generated $749 million (18.7%) of FY25 revenue. In FY26, Arm Technology (China) Co. Limited—an independent entity where Arm holds only a 10% non-voting stake via Acetone Limited—accounted for 16% of total global revenue and held an outsized $276.2 million in accounts receivable. Under the IP License Agreement (IPLA), Arm bears uncapped indemnification liabilities for third-party infringement claims against PRC end-users.
* Customer Concentration & Litigation Overhang: The top five customers represent 57% of total FY26 revenue. Crucially, NASDAQ: QCOM drives 9% of total revenue but is currently locked in aggressive, multi-front litigation with Arm over the Nuvia Architecture License Agreement (ALA). With a consolidated trial scheduled for Q4 2026, the risk of forced royalty refunds, antitrust regulatory probes, and patent invalidation is material.
HDIN Institutional Perspective
While the consensus models NASDAQ: ARM as an insulated, software-like monopoly, the underlying capital structure tells a different story. The transition to production silicon means Arm is actively cannibalizing its traditional merchant silicon base to capture hyperscaler custom compute budgets. This ecosystem friction is directly catalyzing customer defection to the open-source RISC-V architecture (notably through the August 2023 automotive joint venture).
Furthermore, the balance sheet contradicts the asset-light narrative: Arm carries $1.05 billion in non-cancelable long-term purchase obligations (primarily cloud and EDA), plus a $305 million extension signed in April 2026 extending through 2029. Management is forced into hyper-growth mode to outrun these fixed costs, evidenced by the $265 million acquisition of DreamBig Semiconductor (expected to close Q2 FY2027) and CEO Rene Haas's Value Creation Plan, which strictly requires hitting a $2.0 trillion market cap milestone by 2031. For hedge funds, the spread between GAAP margins (18%) and implied Non-GAAP cash margins (>40% adjusted for $1.05 billion in SBC) offers a distinct Relative Value play against legacy x86 architectures, provided the $8.5 billion SoftBank margin loan does not trigger a catastrophic equity liquidation event.
Presentation Download & Video Access:
Presentation Download: Click the PDF download link under 'Related Topics' to access the full institutional presentation of this report.
Video Link: Click this link to watch the HDIN analyst briefing on YouTube.
About HDIN Research:
HDIN Research is a premier global market intelligence and strategic advisory firm specializing in institutional-grade financial analysis, supply chain audits, and macroeconomic forecasting. Our dedicated sector analysts deliver actionable, data-driven insights tailored for private equity, hedge funds, and corporate strategy teams. Visit us at http://www.hdinresearch.com.
*This intelligence report was authored by HDIN Research analysts following a rigorous audit of official corporate filings. AI was utilized for massive-scale data synthesis and structural drafting, ensuring 100% inclusion of reported data points. All strategic insights, financial modeling, and final verdicts were verified by our editorial board to ensure professional accuracy and compliance with 2026 Google Search E-E-A-T standards.*