KOWA CO., LTD.: Premiumization Pivot Near Sakai HQ as Yen Depreciation Signals Capital Realignment in Guangdong
Date : 2026-06-02
Reading : 83
KOWA CO., LTD. navigates Japan’s silver economy with a highly defensive capital posture, maintaining flat FY2026 revenue of $42.75M amid severe macro cost-push pressures. The structural reliance on its Dongguan manufacturing hub exposes the firm to a depreciating yen and logistics inflation, triggering an intentional premiumization pivot via its AURULA and Zista brands. For institutional LPs, KOWA presents a pristine $7.55M net cash balance sheet and an elite 1.60x OCF-to-Net Income conversion. However, a 21.2% distribution dependency on Panasonic and a contracting ROE (13.5%) signal a strict capital preservation mandate prioritizing yield over aggressive expansion.
FY2026 Financials & Segmental Inventory
KOWA’s FY2026 earnings quality remains robust, but margin compression reveals the limits of its current operating leverage. Despite maintaining gross margins through price-mix optimization, SG&A inflation—driven by freight and localized transition costs—has fundamentally compressed the bottom line. Management is actively allocating surplus capital into yield-bearing assets ($6.26M) rather than aggressive PP&E reinvestment ($0.56M).
Figure KOWA: Strategic Resilience and Defensive Premiumization in the Silver Economy
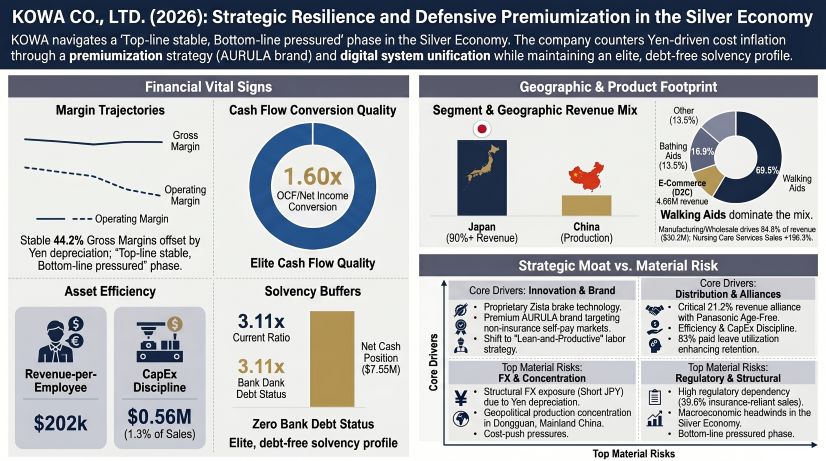
Table Forensic Financial Data Matrix (FY2026 vs. FY2025/Targets)
Segmental & Product Unit Economics:
* Core Manufacturing (Mobility & Bathing): Walking Aids generated $29.77M (69.6% of revenue), while Bathing Aids contributed $9.60M (22.5%). The core manufacturing segment remains the cash cow, delivering $36.23M in revenue and $6.87M in segment profit.
* D2C E-Commerce: Generated $4.66M (10.9% of revenue) with a marginal $0.32M profit, contracting 6.4% YoY as advertising effects normalized.
* Nursing Care Services: Surged 196.3% to $1.87M following the Person Care Co., Ltd. acquisition, but acts as a margin drag with a -$0.42M operating loss.
* Tax & Asset Accounting: KOWA transitioned to a Group Tax Sharing System, adjusting its statutory tax rate forward to 35.43% (effective March 1, 2027) due to Japan's impending Defense Tax. Gross Deferred Tax Assets (DTA) stood at $401,996, alongside a significantly improved inventory write-down of just $31,751. Parent-level loans to subsidiaries reflect massive standalone impairments ($0.86M provisioned against a $1.17M loan to Kowa Life Zation).
Supply Chain Audit & Geo-Economic Moat
KOWA operates a structurally bifurcated geographic arbitrage model, separating its domestic revenue generation from its offshore manufacturing base. This setup presents both high capital efficiency and acute geopolitical/FX risk.
* The Dongguan Production Hub: KOWA’s internal production is heavily concentrated at its wholly-owned subsidiary, Dongguan Kowa Household Necessities Co., Ltd., located in Shijie, Dongguan, Guangdong Province, China. Internal production value here equaled $13.71M. Relocation of this facility in FY2026 resulted in a $0.67M impairment/expense hit.
* Sakai HQ & Localized R&D: Product design, quality assurance (JIS, SG, ISO9001), and back-office operations are anchored at the Sakai headquarters and the Osaka maintenance center in Japan (total domestic PP&E: $4.12M).
* Procurement Arbitrage & Commodity Exposure: The company outsources aggressively for non-core SKUs, with external merchandise purchasing hitting $17.76M. The supply chain is highly vulnerable to raw material cost fluctuations (specifically aluminum pipes and resins) and FX exposure. The $0.59M recorded FX loss is a direct result of being structurally short the Japanese Yen while importing finished goods from the Shijie facility.
* Labor & System Unification: To combat localized wage inflation (parent average salary: $33,817), KOWA successfully executed a digital system unification. This optimization reduced the workforce from 218 to 211 FTEs while achieving an elite $202,618 revenue-per-employee and an 83% paid leave utilization rate.
HDIN Institutional Perspective: Confirming the Balance Sheet, Challenging the Growth Trajectory
While KOWA’s mid-term management plan outlines an aggressive target of $48.35M in revenue and $8.30M in operating profit, HDIN's forensic audit of the FY2027 guidance ($5.03M OP / $42.81M Revenue) indicates a structural disconnect. Management is acutely aware that macroeconomic cost-push pressures (logistics and FX) are permanently elevating the cost floor.
The Differentiated Viewpoint: The Street may view KOWA as a pure-play demographic winner in Japan’s aging society, but the operational reality reveals a hyper-concentrated distribution bottleneck. With 21.2% ($9.06M) of revenue tied exclusively to Panasonic Age-Free Co., Ltd., pricing power is capped. To break this dependency, KOWA is subsidizing its forward-integration into direct rentals and D2C via intra-group loans. The $0.40M R&D investment—focused strictly on mechanical IP like the Zista series speed-control brakes and the de-medicalized AURULA aesthetic line—is highly capital-efficient. However, until the D2C and self-pay channels reach critical mass, KOWA’s massive treasury share hoard (17.43%) and cash parking strategy confirm a company bracing for margin defense, not top-line acceleration.
Presentation Download & Video Access:
Presentation Download: Click the PDF download link under 'Related Topics' to access the full institutional presentation of this report.
Video Link: Click this link to watch the HDIN analyst briefing on YouTube.
About HDIN Research:
HDIN Research is a premier global market intelligence and strategic advisory firm specializing in institutional-grade financial analysis, supply chain audits, and macroeconomic forecasting. Our dedicated sector analysts deliver actionable, data-driven insights tailored for private equity, hedge funds, and corporate strategy teams. Visit us at http://www.hdinresearch.com.
2026 AI Transparency Footer (C2PA Compliant):
*This intelligence report was authored by HDIN Research analysts following a rigorous audit of official corporate filings. AI was utilized for massive-scale data synthesis and structural drafting, ensuring 100% inclusion of reported data points. All strategic insights, financial modeling, and final verdicts were verified by our editorial board to ensure professional accuracy and compliance with 2026 Google Search E-E-A-T standards.*
FY2026 Financials & Segmental Inventory
KOWA’s FY2026 earnings quality remains robust, but margin compression reveals the limits of its current operating leverage. Despite maintaining gross margins through price-mix optimization, SG&A inflation—driven by freight and localized transition costs—has fundamentally compressed the bottom line. Management is actively allocating surplus capital into yield-bearing assets ($6.26M) rather than aggressive PP&E reinvestment ($0.56M).
Figure KOWA: Strategic Resilience and Defensive Premiumization in the Silver Economy
Table Forensic Financial Data Matrix (FY2026 vs. FY2025/Targets)
| Financial Metric | FY2026 Actual (USD) | YoY / Context | Mid-Term Target / FY27 Guidance |
|---|---|---|---|
| Consolidated Net Sales | $42.75M | +0.4% YoY | FY27: $42.81M / Mid-term: $48.35M |
| Gross Profit (Margin) | $18.91M (44.2%) | Flat (vs. 44.4% in FY25) | N/A |
| Operating Profit (Margin) | $5.00M (11.7%) | -6.2% YoY (vs. 12.5% in FY25) | FY27: $5.03M / Mid-term: $8.30M |
| Net Income (Margin) | $2.86M (6.7%) | -30.6% YoY (vs. 9.7% in FY25) | FY27: $3.25M / Mid-term: $5.33M |
| Operating Cash Flow (OCF) | $4.57M | 1.60x OCF-to-Net Income | N/A |
| SG&A Expenses | $13.91M | Driven by high freight costs | N/A |
| R&D Expenditure | $0.40M | 0.95% intensity (expensed) | N/A |
| Interest-Bearing Debt | $1.35M | Leases only (Zero bank debt) | N/A |
| Net Cash Position | $7.55M | Total Cash: $8.90M | N/A |
| Dividends Paid | $0.33M | 13 JPY per share (up from 12 JPY) | N/A |
Segmental & Product Unit Economics:
* Core Manufacturing (Mobility & Bathing): Walking Aids generated $29.77M (69.6% of revenue), while Bathing Aids contributed $9.60M (22.5%). The core manufacturing segment remains the cash cow, delivering $36.23M in revenue and $6.87M in segment profit.
* D2C E-Commerce: Generated $4.66M (10.9% of revenue) with a marginal $0.32M profit, contracting 6.4% YoY as advertising effects normalized.
* Nursing Care Services: Surged 196.3% to $1.87M following the Person Care Co., Ltd. acquisition, but acts as a margin drag with a -$0.42M operating loss.
* Tax & Asset Accounting: KOWA transitioned to a Group Tax Sharing System, adjusting its statutory tax rate forward to 35.43% (effective March 1, 2027) due to Japan's impending Defense Tax. Gross Deferred Tax Assets (DTA) stood at $401,996, alongside a significantly improved inventory write-down of just $31,751. Parent-level loans to subsidiaries reflect massive standalone impairments ($0.86M provisioned against a $1.17M loan to Kowa Life Zation).
Supply Chain Audit & Geo-Economic Moat
KOWA operates a structurally bifurcated geographic arbitrage model, separating its domestic revenue generation from its offshore manufacturing base. This setup presents both high capital efficiency and acute geopolitical/FX risk.
* The Dongguan Production Hub: KOWA’s internal production is heavily concentrated at its wholly-owned subsidiary, Dongguan Kowa Household Necessities Co., Ltd., located in Shijie, Dongguan, Guangdong Province, China. Internal production value here equaled $13.71M. Relocation of this facility in FY2026 resulted in a $0.67M impairment/expense hit.
* Sakai HQ & Localized R&D: Product design, quality assurance (JIS, SG, ISO9001), and back-office operations are anchored at the Sakai headquarters and the Osaka maintenance center in Japan (total domestic PP&E: $4.12M).
* Procurement Arbitrage & Commodity Exposure: The company outsources aggressively for non-core SKUs, with external merchandise purchasing hitting $17.76M. The supply chain is highly vulnerable to raw material cost fluctuations (specifically aluminum pipes and resins) and FX exposure. The $0.59M recorded FX loss is a direct result of being structurally short the Japanese Yen while importing finished goods from the Shijie facility.
* Labor & System Unification: To combat localized wage inflation (parent average salary: $33,817), KOWA successfully executed a digital system unification. This optimization reduced the workforce from 218 to 211 FTEs while achieving an elite $202,618 revenue-per-employee and an 83% paid leave utilization rate.
HDIN Institutional Perspective: Confirming the Balance Sheet, Challenging the Growth Trajectory
While KOWA’s mid-term management plan outlines an aggressive target of $48.35M in revenue and $8.30M in operating profit, HDIN's forensic audit of the FY2027 guidance ($5.03M OP / $42.81M Revenue) indicates a structural disconnect. Management is acutely aware that macroeconomic cost-push pressures (logistics and FX) are permanently elevating the cost floor.
The Differentiated Viewpoint: The Street may view KOWA as a pure-play demographic winner in Japan’s aging society, but the operational reality reveals a hyper-concentrated distribution bottleneck. With 21.2% ($9.06M) of revenue tied exclusively to Panasonic Age-Free Co., Ltd., pricing power is capped. To break this dependency, KOWA is subsidizing its forward-integration into direct rentals and D2C via intra-group loans. The $0.40M R&D investment—focused strictly on mechanical IP like the Zista series speed-control brakes and the de-medicalized AURULA aesthetic line—is highly capital-efficient. However, until the D2C and self-pay channels reach critical mass, KOWA’s massive treasury share hoard (17.43%) and cash parking strategy confirm a company bracing for margin defense, not top-line acceleration.
Presentation Download & Video Access:
Presentation Download: Click the PDF download link under 'Related Topics' to access the full institutional presentation of this report.
Video Link: Click this link to watch the HDIN analyst briefing on YouTube.
About HDIN Research:
HDIN Research is a premier global market intelligence and strategic advisory firm specializing in institutional-grade financial analysis, supply chain audits, and macroeconomic forecasting. Our dedicated sector analysts deliver actionable, data-driven insights tailored for private equity, hedge funds, and corporate strategy teams. Visit us at http://www.hdinresearch.com.
2026 AI Transparency Footer (C2PA Compliant):
*This intelligence report was authored by HDIN Research analysts following a rigorous audit of official corporate filings. AI was utilized for massive-scale data synthesis and structural drafting, ensuring 100% inclusion of reported data points. All strategic insights, financial modeling, and final verdicts were verified by our editorial board to ensure professional accuracy and compliance with 2026 Google Search E-E-A-T standards.*