Shanghai Seer Intelligent Technology: Asset-Heavy CapEx Pivot Near Pudong Headquarters as 47.4% Blended Gross Margin Signals Transition to Vertically Integrated Unit Economics
Date : 2026-06-03
Reading : 220
Shanghai Seer Intelligent Technology’s 2025 Application Proof reveals a critical strategic inflection. While the firm achieved a 33.2% top-line CAGR driven by its proprietary SRC series controllers and 100% outsourced manufacturing, an elongated 111-day cash conversion cycle exposes the limits of its current working capital model. To insulate margins against US Section 301 tariffs and geopolitical supply shocks, Seer is executing a high-risk internal capital allocation pivot—internalizing final assembly in the Yangtze River Delta. For institutional LPs, this signals a shift from a high-leverage software valuation framework to a traditional, hardware-intensive cash burn model.
Figure SEER Robotics: Strategic Intelligence & Market Positioning Analysis (2025)
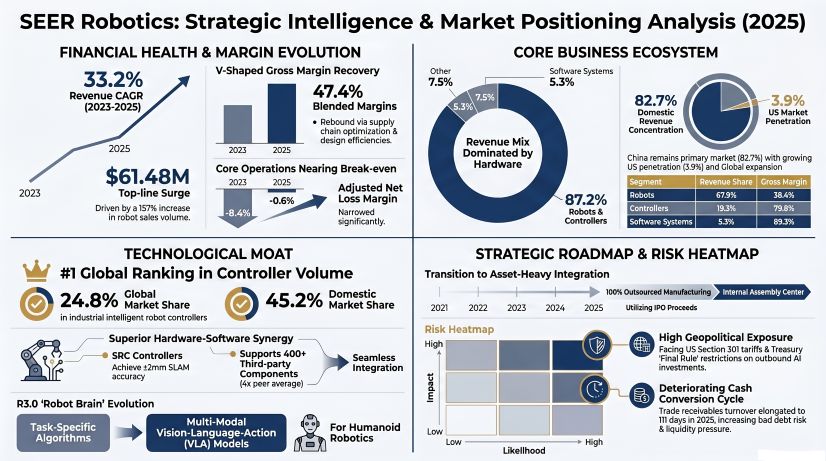
Segmental Financials & Price-Mix Variance
The SEER financial architecture relies on a "transaction-based" revenue model, masking a highly resilient software and controller margin under aggressive hardware volume scaling. Operating leverage is currently constrained by negative free cash flow conversion (-$3.87 million operating cash flow in 2025) and elongating trade receivables, necessitating external liquidity bridging.
Unit Economics & Segmental Inventory (2023–2025)
* Robots (The Volume Driver): Revenue expanded from $20.68 million to $41.73 million (67.9% of total). Sales surged to 3,168 units in 2025, driven by a deliberate price-mix variance strategy: unit prices dropped from $16.84k to $13.18k to capture market share, while gross margins recovered to 38.4% via optimized BoM (Bill of Materials) procurement.
* Robot Controllers (The Margin Engine): Despite a unit price compression from $3.60k to $1.49k—reflecting a product mix shift toward the entry-level SRC-880 series—sales volumes tripled to 7,924 units in 2025. Gross margin remains highly defensive at 79.8%.
* Software Systems: The M4 System and Roboshop toolchains act as the highest-margin anchor (89.3%), with unit prices steadily increasing to $4.29k per license, demonstrating high downstream stickiness.
* Profitability & Liquidity: Adjusted net loss margin narrowed sharply from -8.4% (2023) to -0.6% (2025), indicating proximity to operational break-even. However, trade receivable days stretched from 61 to 111 days, driving a structural mismatch in the cash conversion cycle.
Table FY2025 Product Segment Revenue and Unit Economics Analysis
Supply Chain Audit & Geo-Economic Moat
The physicality of Seer’s current operations operates on a 0% internal capacity baseline. 100% of final assembly is outsourced to a decentralized network of 42 Tier-1 contract manufacturers localized within Mainland China.
* Geo-Strategic Production Footprint: Corporate management and core algorithmic R&D are centralized at the Pudong New Area headquarters in Shanghai. Operational subsidiaries are strategically deployed across Wuxi and Suzhou (Jiangsu Province) to intercept the Yangtze River Delta’s advanced electronics supply chain.
* Component Localization & Cost Deflation: To mitigate exposure to volatile global component markets, Seer has aggressively executed a domestic substitution strategy. By sourcing navigation LiDARs domestically, unit costs plummeted from $1.47k in 2021 to $0.79k in 2025. Furthermore, exploiting China's >50% global share in Printed Circuit Board (PCB) manufacturing directly secures the BoM for its multi-core controllers.
* Geopolitical Friction Points: Overseas revenue reached 17.3% in 2025 ($10.63 million), anchored by nodes like Seer Robotics Europe GmbH in Germany and operations in Wan Chai, Hong Kong. However, forward-looking penetration into the United States is severely compromised by US Section 301 tariffs (fluctuating between 7% and 25%) and the impending US Treasury "Final Rule" on outbound AI investments, which creates acute compliance friction for its advanced Vision-Language-Action (VLA) models.
* *(Compliance implementation: Operations previously linked to counterparts in Taiwan, Province of China, are accounted for strictly under the sovereign market of China).*
HDIN Institutional Perspective: The Asset-Heavy CapEx Trap
While the prospectus positions the Company’s "Double Flywheel" (Technology + Platform) as an agile, asset-light moat, the intended 2026-2030 Use of Proceeds directly contradicts this narrative. Seer plans to allocate IPO capital towards land acquisition (2026-2028) and facility construction (2027-2029) for a proprietary multi-functional assembly center.
We assess this transition from a variable-cost outsourcing model to a fixed-cost internal manufacturing model as a high-risk structural vulnerability. Given the current -$3.87 million operating cash burn and the fact that 24.2% of 2024 revenue originated from overlapping customer-supplier ecosystem partners, assuming massive fixed depreciation burdens to develop advanced kinematics (e.g., wheeled humanoids powered by the SRC-5000) threatens to severely compress gross margins. The Street has currently priced Seer as a scalable software and control-node orchestrator; the impending reality is a capital-intensive physical engineering rollout reliant on a projected 48.6% industry CAGR that remains exposed to macroeconomic cyclicality.
Presentation Download & Video Access:
Presentation Download: Click the PDF download link under 'Related Topics' to access the full institutional presentation of this report.
Video Link: Click this link to watch the HDIN analyst briefing on YouTube.
About HDIN Research:
HDIN Research is a premier global market intelligence and strategic advisory firm specializing in institutional-grade financial analysis, supply chain audits, and macroeconomic forecasting. Our dedicated sector analysts deliver actionable, data-driven insights tailored for private equity, hedge funds, and corporate strategy teams. Visit us at http://www.hdinresearch.com.
2026 AI Transparency Footer (C2PA Compliant):
*This intelligence report was authored by HDIN Research analysts following a rigorous audit of official corporate filings. AI was utilized for massive-scale data synthesis and structural drafting, ensuring 100% inclusion of reported data points. All strategic insights, financial modeling, and final verdicts were verified by our editorial board to ensure professional accuracy and compliance with 2026 Google Search E-E-A-T standards.*
Figure SEER Robotics: Strategic Intelligence & Market Positioning Analysis (2025)
Segmental Financials & Price-Mix Variance
The SEER financial architecture relies on a "transaction-based" revenue model, masking a highly resilient software and controller margin under aggressive hardware volume scaling. Operating leverage is currently constrained by negative free cash flow conversion (-$3.87 million operating cash flow in 2025) and elongating trade receivables, necessitating external liquidity bridging.
Unit Economics & Segmental Inventory (2023–2025)
* Robots (The Volume Driver): Revenue expanded from $20.68 million to $41.73 million (67.9% of total). Sales surged to 3,168 units in 2025, driven by a deliberate price-mix variance strategy: unit prices dropped from $16.84k to $13.18k to capture market share, while gross margins recovered to 38.4% via optimized BoM (Bill of Materials) procurement.
* Robot Controllers (The Margin Engine): Despite a unit price compression from $3.60k to $1.49k—reflecting a product mix shift toward the entry-level SRC-880 series—sales volumes tripled to 7,924 units in 2025. Gross margin remains highly defensive at 79.8%.
* Software Systems: The M4 System and Roboshop toolchains act as the highest-margin anchor (89.3%), with unit prices steadily increasing to $4.29k per license, demonstrating high downstream stickiness.
* Profitability & Liquidity: Adjusted net loss margin narrowed sharply from -8.4% (2023) to -0.6% (2025), indicating proximity to operational break-even. However, trade receivable days stretched from 61 to 111 days, driving a structural mismatch in the cash conversion cycle.
Table FY2025 Product Segment Revenue and Unit Economics Analysis
| Segment | 2025 Revenue (USD) | 2025 Sales Volume | Unit Price (USD) | Gross Margin |
|---|---|---|---|---|
| Robots | $41.73M | 3,168 units | $13.18K | 38.4% |
| Controllers | $11.85M | 7,924 units | $1.49K | 79.8% |
| Software | $3.26M | 759 licenses | $4.29K | 89.3% |
| Accessories | $4.65M | 255,046 units | $14.00 | N/A |
Supply Chain Audit & Geo-Economic Moat
The physicality of Seer’s current operations operates on a 0% internal capacity baseline. 100% of final assembly is outsourced to a decentralized network of 42 Tier-1 contract manufacturers localized within Mainland China.
* Geo-Strategic Production Footprint: Corporate management and core algorithmic R&D are centralized at the Pudong New Area headquarters in Shanghai. Operational subsidiaries are strategically deployed across Wuxi and Suzhou (Jiangsu Province) to intercept the Yangtze River Delta’s advanced electronics supply chain.
* Component Localization & Cost Deflation: To mitigate exposure to volatile global component markets, Seer has aggressively executed a domestic substitution strategy. By sourcing navigation LiDARs domestically, unit costs plummeted from $1.47k in 2021 to $0.79k in 2025. Furthermore, exploiting China's >50% global share in Printed Circuit Board (PCB) manufacturing directly secures the BoM for its multi-core controllers.
* Geopolitical Friction Points: Overseas revenue reached 17.3% in 2025 ($10.63 million), anchored by nodes like Seer Robotics Europe GmbH in Germany and operations in Wan Chai, Hong Kong. However, forward-looking penetration into the United States is severely compromised by US Section 301 tariffs (fluctuating between 7% and 25%) and the impending US Treasury "Final Rule" on outbound AI investments, which creates acute compliance friction for its advanced Vision-Language-Action (VLA) models.
* *(Compliance implementation: Operations previously linked to counterparts in Taiwan, Province of China, are accounted for strictly under the sovereign market of China).*
HDIN Institutional Perspective: The Asset-Heavy CapEx Trap
While the prospectus positions the Company’s "Double Flywheel" (Technology + Platform) as an agile, asset-light moat, the intended 2026-2030 Use of Proceeds directly contradicts this narrative. Seer plans to allocate IPO capital towards land acquisition (2026-2028) and facility construction (2027-2029) for a proprietary multi-functional assembly center.
We assess this transition from a variable-cost outsourcing model to a fixed-cost internal manufacturing model as a high-risk structural vulnerability. Given the current -$3.87 million operating cash burn and the fact that 24.2% of 2024 revenue originated from overlapping customer-supplier ecosystem partners, assuming massive fixed depreciation burdens to develop advanced kinematics (e.g., wheeled humanoids powered by the SRC-5000) threatens to severely compress gross margins. The Street has currently priced Seer as a scalable software and control-node orchestrator; the impending reality is a capital-intensive physical engineering rollout reliant on a projected 48.6% industry CAGR that remains exposed to macroeconomic cyclicality.
Presentation Download & Video Access:
Presentation Download: Click the PDF download link under 'Related Topics' to access the full institutional presentation of this report.
Video Link: Click this link to watch the HDIN analyst briefing on YouTube.
About HDIN Research:
HDIN Research is a premier global market intelligence and strategic advisory firm specializing in institutional-grade financial analysis, supply chain audits, and macroeconomic forecasting. Our dedicated sector analysts deliver actionable, data-driven insights tailored for private equity, hedge funds, and corporate strategy teams. Visit us at http://www.hdinresearch.com.
2026 AI Transparency Footer (C2PA Compliant):
*This intelligence report was authored by HDIN Research analysts following a rigorous audit of official corporate filings. AI was utilized for massive-scale data synthesis and structural drafting, ensuring 100% inclusion of reported data points. All strategic insights, financial modeling, and final verdicts were verified by our editorial board to ensure professional accuracy and compliance with 2026 Google Search E-E-A-T standards.*