ASE Technology Holding: Advanced Packaging Pivot Near Penang and Vietnam as 140-bps Margin Expansion Signals Structural Decoupling
Date : 2026-06-05
Reading : 260
While the market fixates on foundry encroachment, ASE Technology Holding’s 2025 structural pivot reveals a decisive decoupling of profitability from traditional consumer electronics. By surging its advanced packaging footprint by 167%, the firm engineered a 140-bps gross margin expansion despite a 5.2% contraction in its EMS segment. For institutional LPs, the critical narrative lies in its $9.18 billion 2026 CapEx mandate: the enterprise is aggressively regionalizing manufacturing nodes in Penang and Vietnam's Dinh Vu to circumvent BIS 50% rules, cementing its indispensability in the geopolitical AI supply chain.
Figure ASE Technology Holding (ASEH): 2025 Strategic Performance & Al-Integration Roadmap
 Forensic Analysis of 2025 Financials and Segments
An examination of NYSE: ASX reveals a highly bifurcated performance profile, driven by a deliberate price-mix variance favoring high-margin compute infrastructure over legacy wirebonding. The firm's ability to maintain a 128.4% current ratio while executing hyper-expansionary investments illustrates formidable free cash flow (FCF) conversion.
Income Statement & Operating Leverage
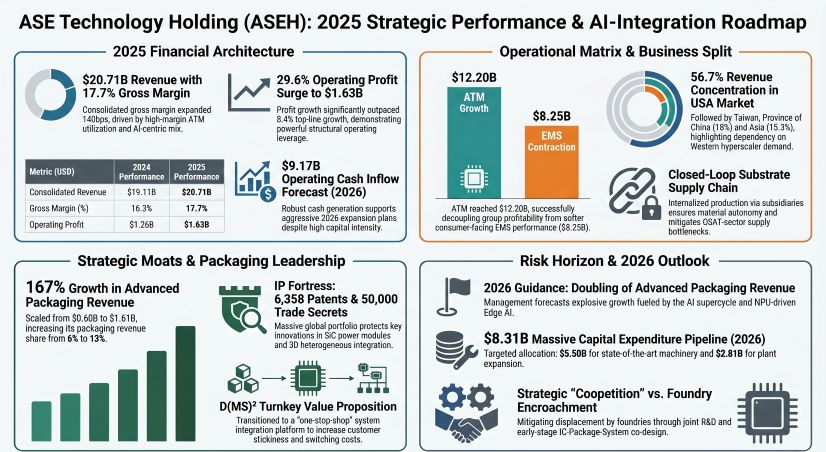
* Consolidated Top-Line: Total revenue reached $20.71 billion (NT$645.4 billion), an 8.4% YoY expansion, supported by a geographic mix favoring the USA (56.68%), Taiwan (17.97%), Asia/Others (15.29%), and Europe (10.06%).
* Segmental Divergence: The ATM segment surged 20.2% YoY to $12.20 billion (NT$380.2 billion). Conversely, cyclical softness drove a 5.2% YoY contraction in the EMS segment to $8.25 billion (NT$257.2 billion).
* Unit Economics & Product Mix: Advanced packaging revenue exploded 167% YoY from $603.2 million (NT$18.8 billion) to $1.61 billion (NT$50.2 billion), increasing its core share from 6% to 13%.
* Margin Trajectory: Gross margin expanded 140 bps to 17.7%, generating $3.66 billion (NT$114.19 billion) in gross profit. Operating profit demonstrated significant leverage, surging 29.6% YoY to $1.63 billion (NT$50.76 billion).
* Bottom Line Anomalies: While net profit registered at $1.34 billion (NT$41.84 billion), Total Comprehensive Income fell 16.4% YoY to $1.24 billion (NT$38.80 billion) due to USD/TWD FX translation headwinds and fair-value markdowns.
Capital Allocation & Balance Sheet Inventory
* Asset & Equity Base: Total assets expanded to $28.54 billion (NT$889.33 billion). Equity attributable to owners stood at $11.13 billion (NT$346.9 billion), yielding a 39.0% equity-to-asset ratio.
* Debt Profile: Liabilities include a $1.60 billion (NT$50 billion) 5-year sustainability-linked syndicated loan and outstanding unsecured corporate bonds totaling $176.47 million (NT$5.5 billion) maturing in 2026/2027. The long-term funds to PP&E ratio is structurally sound at 153.2%.
* CapEx & R&D: 2025 CapEx reached $5.54 billion ($3.42 billion in machinery; $2.11 billion in plant/automation). R&D intensity increased to 5.10% of revenue, hitting $1.05 billion (NT$32.85 billion) to defend the SiP, CPO, and FOPLP technology moats.
* Shareholder Returns: Management authorized a cash dividend of $944.55 million ($0.21 or NT$6.6 per share).
* 2026 Temporal Projections: Forecasted net operating cash inflows of $9.17 billion (NT$285.95 billion) will fund a massive $9.18 billion CapEx guidance ($5.50 billion for machinery, $2.81 billion for land/plants). Volume targets are set at 36.8 billion packaging units and 6.1 billion testing units.
* Contingencies & Fines: Immaterial regulatory provisions included $4,107 (NT$128,000) in environmental fines (lubricating oil, organic waste, lead compounds) and minor Labor Standards Act infractions (fines ranging from $640 to $8,021). The legacy insider trading litigation involving Dr. Tien Wu continues via Supreme Court appeal, though repeated "not guilty" verdicts minimize systemic corporate risk.
Supply Chain Architecture and Regional Moats
The physicality of ASE Technology Holding’s operations has transitioned from centralized cost-efficiency toward decentralized geopolitical resilience. To mitigate reliance on the "Company BB" equipment monopoly (which accounted for 13.1% / $1.52 billion of 2025 purchases), the company heavily internalized substrate manufacturing through its ASE (Shanghai) Inc. and ASE Electronics Inc. subsidiaries.
Customer concentration remains a monitored vulnerability, with "Company Q" driving 25.0% ($5.17 billion) of total net sales, down slightly from 29.0% in 2024. To sustain capacity for hyperscalers while hedging against U.S.-China tariff friction, the company secured a strategic land lease extending to June 2058 in Vietnam's DINH VU Industrial Zone and land leases in Taiwan through July 2069.
At the facility level, the ASE Kaohsiung hub operates as the world’s first 5G mmWave Global Lighthouse Network (GLN) site, complemented by the "Lights-Off" automated testing floor at the ZJ Factory. This hardware optimization is defended by an intellectual property moat of 6,358 granted patents and over 50,000 trade secrets, featuring distinct advancements in Indium-Based Thermal Interface Materials (TIM) and Silicon Carbide (SiC) power modules. Operationally, the rapid scale-up triggered a 25.09% increase in Scope 1 and 2 emissions (to 2.30 million tCO2e), prompting the Board to strictly link 2026 executive stock vesting to 10% reductions in both GHG and water withdrawal intensity.
HDIN Institutional Perspective
While the consensus views pure-play foundries expanding into advanced packaging as a terminal threat to traditional OSATs, we take a differentiated viewpoint. The 2025 metrics confirm ASE Technology Holding is successfully leveraging a "coopetitive" architecture. The critical data point is the PP&E schedule: net carrying amount surged 34.7% YoY to $13.51 billion. With $5.54 billion deployed in 2025 CapEx against an implied depreciation of just $2.06 billion, the enterprise is investing at 2.7x its depreciation run-rate. This hyper-expansionary footprint, combined with deep ecosystem lock-in via its turnkey D(MS)² framework, indicates that the firm's advanced capacity scale is effectively un-replicable by downstream foundries in the near term, ensuring durable pricing power through the 2026 AI supercycle.
Presentation Download & Video Access:
Presentation Download: Click the PDF download link under 'Related Topics' to access the full institutional presentation of this report.
Video Link: Click this link to watch the HDIN analyst briefing on YouTube.
About HDIN Research:
HDIN Research is a premier global market intelligence and strategic advisory firm specializing in institutional-grade financial analysis, supply chain audits, and macroeconomic forecasting. Our dedicated sector analysts deliver actionable, data-driven insights tailored for private equity, hedge funds, and corporate strategy teams. Visit us at http://www.hdinresearch.com.
2026 AI Transparency Footer (C2PA Compliant):
"This intelligence report was authored by HDIN Research analysts following a rigorous audit of official corporate filings. AI was utilized for massive-scale data synthesis and structural drafting, ensuring 100% inclusion of reported data points. All strategic insights, financial modeling, and final verdicts were verified by our editorial board to ensure professional accuracy and compliance with 2026 Google Search E-E-A-T standards."
Figure ASE Technology Holding (ASEH): 2025 Strategic Performance & Al-Integration Roadmap
Forensic Analysis of 2025 Financials and Segments An examination of NYSE: ASX reveals a highly bifurcated performance profile, driven by a deliberate price-mix variance favoring high-margin compute infrastructure over legacy wirebonding. The firm's ability to maintain a 128.4% current ratio while executing hyper-expansionary investments illustrates formidable free cash flow (FCF) conversion.
Income Statement & Operating Leverage
* Consolidated Top-Line: Total revenue reached $20.71 billion (NT$645.4 billion), an 8.4% YoY expansion, supported by a geographic mix favoring the USA (56.68%), Taiwan (17.97%), Asia/Others (15.29%), and Europe (10.06%).
* Segmental Divergence: The ATM segment surged 20.2% YoY to $12.20 billion (NT$380.2 billion). Conversely, cyclical softness drove a 5.2% YoY contraction in the EMS segment to $8.25 billion (NT$257.2 billion).
* Unit Economics & Product Mix: Advanced packaging revenue exploded 167% YoY from $603.2 million (NT$18.8 billion) to $1.61 billion (NT$50.2 billion), increasing its core share from 6% to 13%.
* Margin Trajectory: Gross margin expanded 140 bps to 17.7%, generating $3.66 billion (NT$114.19 billion) in gross profit. Operating profit demonstrated significant leverage, surging 29.6% YoY to $1.63 billion (NT$50.76 billion).
* Bottom Line Anomalies: While net profit registered at $1.34 billion (NT$41.84 billion), Total Comprehensive Income fell 16.4% YoY to $1.24 billion (NT$38.80 billion) due to USD/TWD FX translation headwinds and fair-value markdowns.
Capital Allocation & Balance Sheet Inventory
* Asset & Equity Base: Total assets expanded to $28.54 billion (NT$889.33 billion). Equity attributable to owners stood at $11.13 billion (NT$346.9 billion), yielding a 39.0% equity-to-asset ratio.
* Debt Profile: Liabilities include a $1.60 billion (NT$50 billion) 5-year sustainability-linked syndicated loan and outstanding unsecured corporate bonds totaling $176.47 million (NT$5.5 billion) maturing in 2026/2027. The long-term funds to PP&E ratio is structurally sound at 153.2%.
* CapEx & R&D: 2025 CapEx reached $5.54 billion ($3.42 billion in machinery; $2.11 billion in plant/automation). R&D intensity increased to 5.10% of revenue, hitting $1.05 billion (NT$32.85 billion) to defend the SiP, CPO, and FOPLP technology moats.
* Shareholder Returns: Management authorized a cash dividend of $944.55 million ($0.21 or NT$6.6 per share).
* 2026 Temporal Projections: Forecasted net operating cash inflows of $9.17 billion (NT$285.95 billion) will fund a massive $9.18 billion CapEx guidance ($5.50 billion for machinery, $2.81 billion for land/plants). Volume targets are set at 36.8 billion packaging units and 6.1 billion testing units.
* Contingencies & Fines: Immaterial regulatory provisions included $4,107 (NT$128,000) in environmental fines (lubricating oil, organic waste, lead compounds) and minor Labor Standards Act infractions (fines ranging from $640 to $8,021). The legacy insider trading litigation involving Dr. Tien Wu continues via Supreme Court appeal, though repeated "not guilty" verdicts minimize systemic corporate risk.
Supply Chain Architecture and Regional Moats
The physicality of ASE Technology Holding’s operations has transitioned from centralized cost-efficiency toward decentralized geopolitical resilience. To mitigate reliance on the "Company BB" equipment monopoly (which accounted for 13.1% / $1.52 billion of 2025 purchases), the company heavily internalized substrate manufacturing through its ASE (Shanghai) Inc. and ASE Electronics Inc. subsidiaries.
Customer concentration remains a monitored vulnerability, with "Company Q" driving 25.0% ($5.17 billion) of total net sales, down slightly from 29.0% in 2024. To sustain capacity for hyperscalers while hedging against U.S.-China tariff friction, the company secured a strategic land lease extending to June 2058 in Vietnam's DINH VU Industrial Zone and land leases in Taiwan through July 2069.
At the facility level, the ASE Kaohsiung hub operates as the world’s first 5G mmWave Global Lighthouse Network (GLN) site, complemented by the "Lights-Off" automated testing floor at the ZJ Factory. This hardware optimization is defended by an intellectual property moat of 6,358 granted patents and over 50,000 trade secrets, featuring distinct advancements in Indium-Based Thermal Interface Materials (TIM) and Silicon Carbide (SiC) power modules. Operationally, the rapid scale-up triggered a 25.09% increase in Scope 1 and 2 emissions (to 2.30 million tCO2e), prompting the Board to strictly link 2026 executive stock vesting to 10% reductions in both GHG and water withdrawal intensity.
HDIN Institutional Perspective
While the consensus views pure-play foundries expanding into advanced packaging as a terminal threat to traditional OSATs, we take a differentiated viewpoint. The 2025 metrics confirm ASE Technology Holding is successfully leveraging a "coopetitive" architecture. The critical data point is the PP&E schedule: net carrying amount surged 34.7% YoY to $13.51 billion. With $5.54 billion deployed in 2025 CapEx against an implied depreciation of just $2.06 billion, the enterprise is investing at 2.7x its depreciation run-rate. This hyper-expansionary footprint, combined with deep ecosystem lock-in via its turnkey D(MS)² framework, indicates that the firm's advanced capacity scale is effectively un-replicable by downstream foundries in the near term, ensuring durable pricing power through the 2026 AI supercycle.
Presentation Download & Video Access:
Presentation Download: Click the PDF download link under 'Related Topics' to access the full institutional presentation of this report.
Video Link: Click this link to watch the HDIN analyst briefing on YouTube.
About HDIN Research:
HDIN Research is a premier global market intelligence and strategic advisory firm specializing in institutional-grade financial analysis, supply chain audits, and macroeconomic forecasting. Our dedicated sector analysts deliver actionable, data-driven insights tailored for private equity, hedge funds, and corporate strategy teams. Visit us at http://www.hdinresearch.com.
2026 AI Transparency Footer (C2PA Compliant):
"This intelligence report was authored by HDIN Research analysts following a rigorous audit of official corporate filings. AI was utilized for massive-scale data synthesis and structural drafting, ensuring 100% inclusion of reported data points. All strategic insights, financial modeling, and final verdicts were verified by our editorial board to ensure professional accuracy and compliance with 2026 Google Search E-E-A-T standards."