SharonAI: Aggressive Neocloud Pivot Near Melbourne M2 Facility as $720 Million Unrecorded CAPEX Signals Severe Structural Leverage
Date : 2026-06-08
Reading : 128
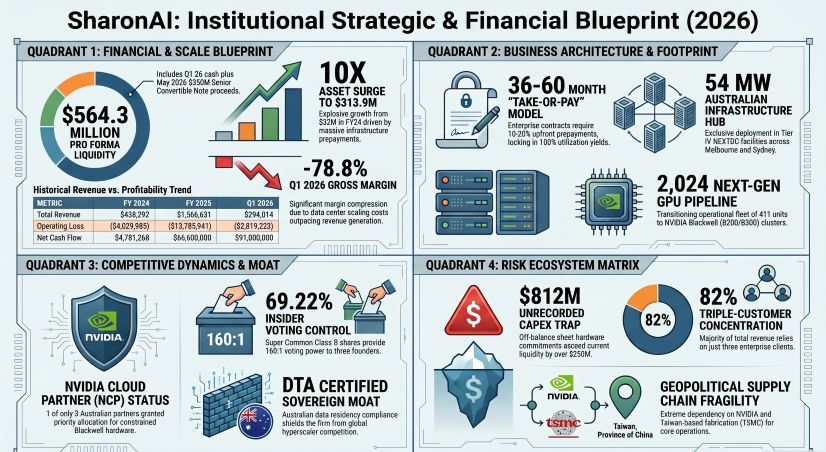
SharonAI’s strategic pivot to a pure-play Neocloud operator relies entirely on a highly leveraged, forward-capacity procurement model. With $164.3 million in Q1 2026 cash heavily outweighed by a massive $720.0 million unrecorded CAPEX commitment for its ESDS Software Solutions contract, the firm is fundamentally bottlenecked by NASDAQ: NVDA supply constraints and Australian sovereign data mandates. For institutional LPs, the 10x asset expansion masks acute working capital strain; survival hinges strictly on executing $350 million in May 2026 convertible notes before structural cash burn outpaces physical hardware deployment.
Figure SharonAl: Institutional Strategic & Financial Blueprint (2026)
 Forensic Financials & Segmental Capital Allocation
The company’s underlying unit economics reflect a highly distressed scaling phase. The shift from a legacy digital asset miner to a GPU-as-a-Service (GPUaaS) provider resulted in a 9.6% YoY top-line revenue contraction to $294,014 in Q1 2026. Cost of revenue vastly outpaced top-line generation, collapsing Q1 2026 gross margins to -78.8% (down 8,240 bps YoY from 3.6% in Q1 2025).
Quality of Earnings (QoE) is severely distorted by fair-value accounting and one-off divestitures. A Forensic Analysis of the Q1 2026 statutory net loss of $(20,011,821) reveals a $70,227,754 non-cash fair-value loss on current convertible notes, offset by a $65,919,712 gain from the sale of its Texas Critical Data Centers (TCDC) joint venture in the Permian Basin.
Quantitative Structural Inventory (FY24 to Q1 2026):
* Asset & Liquidity Expansion: Total assets surged 10x from $32,146,452 (FY24) to $313,886,244 (Q1 2026). Liquidity was salvaged via a $125 million February 2026 NASDAQ IPO, pushing the current ratio from a distressed 0.63x (FY25) to 1.04x (Q1 2026), fortified by $164,288,288 in cash.
* Operating Leverage & Burn: Operating Cash Flow (OCF) burn accelerated to $(7,449,588) in Q1 2026. Investing cash outflows hit $(32,720,098), dominated by $42.4 million in equipment lease prepayments.
* Debt Profile: The capital structure is dominated by $199,358,226 in short-term convertible notes (12-15% interest, mature Dec 2027) and a post-quarter $350,000,000 senior convertible note (6.00% interest, matures May 2031 at a ~$48.24 conversion rate). Finance lease liabilities stand at $4,902,764 with an imputed interest rate of 5.72%.
* Segmental Run-Rate: By Q1 2026, GPUaaS contributed 100% of the $294,012 operating revenue, completely replacing the discontinued digital asset mining ($0) and other legacy revenues ($2).
Geopolitical Supply Chain Audit & Infrastructure Footprint
SharonAI bypasses greenfield capital expenditures by renting contiguous colocation space, anchoring its operations in the Asia-Pacific region to capture Australian Federal Government DTA-certified sovereign AI compute demand. The physical footprint is heavily concentrated within NEXTDC Tier IV facilities:
* Melbourne Hub: The M2 facility serves as the locus for a 40 MW contiguous high-density liquid-to-chip deployment. The operational M3 facility utilizes 1.6 MW to host the initial supercluster of 125 servers and 1,000 B200 GPUs.
* Sydney Node: S6 provides 10.75 MW of distributed capacity, while S3 is slated for a 2 MW single B300 cluster.
* Future Capacity Commitments: A September 2026 contract with GreenSquareDC guarantees 15 MW across a 120-month lifecycle.
Supply Chain Monopsony & Geographic Risk:
The company’s hardware procurement presents an acute single-point-of-failure. With zero long-term guaranteed pricing or volume agreements, SharonAI relies entirely on NASDAQ: NVDA for its 2,024-GPU incoming fleet (1,000 B200s, 1,024 B300s). This upstream reliance is geographically tied to NYSE: TSM in Taiwan, Province of China, exposing the hardware pipeline to severe cross-strait geopolitical tail risks. Networking architecture is heavily reliant on the NASDAQ: CSCO 360 Partner Program (spine and leaf topology), while hardware procurement is financed via Lenovo TruScale.
Unrecorded Liabilities & Intellectual Property Vulnerabilities
The reported Q1 2026 Total Liabilities of $225,255,423 fundamentally understate forward encumbrances. The firm’s $1.26 billion (5-year) customer agreement with ESDS Software Solutions and the $950 million APAC tech contract require immediate fulfillment.
* Off-Balance Sheet Traps: SharonAI is bound by a $720,000,000 unrecorded infrastructure CAPEX commitment for the ESDS contract, plus a $92,000,000 noncancelable hardware order with World Wide Technology (WWT). Additional obligations include a $258,000 (AUD$400,000) managed IT services mandate with Andrew Sjoquist Enterprises (ASE) and nearly $1 million in restricted cash locked in certificates of deposit for bank guarantees.
* R&D vs. IP Realities: The company holds zero patents. FY24 R&D efforts were heavily subsidized by $648,049 in Australian R&D grant income (which dropped to $0 in FY25). Its primary IP, the SharonAI Studio PaaS, relies heavily on open-source frameworks, exposing the company to untested "copyleft" software licensing risks and secondary copyright liabilities.
HDIN Institutional Perspective
While management promotes a capital-efficient "asset-light" Neocloud narrative, the operational reality reflects a hardware-intensive, heavily indebted procurement shell heavily reliant on global supply chain perfection. The 69.22% voting control held by three insiders (via Class B Super Shares with 160:1 voting rights)—including former NASDAQ: MIGI and ASX: TLS executives—structurally alienates institutional index funds. We view the $350 million in newly issued 6.00% debt not as growth capital, but as emergency bridging required to prevent technical insolvency triggered by the unrecorded $720 million ESDS CAPEX commitment. If NVIDIA B300 allocations are delayed by even two quarters, the invested capital base will bloat with idle lease assets, severely compressing the projected ROIC and negating the structural viability of their multi-year "take-or-pay" offtake agreements.
Presentation Download & Video Access:
Presentation Download: Click the PDF download link under 'Related Topics' to access the full institutional presentation of this report.
Video Link: Click this link to watch the HDIN analyst briefing on YouTube.
About HDIN Research:
HDIN Research is a premier global market intelligence and strategic advisory firm specializing in institutional-grade financial analysis, supply chain audits, and macroeconomic forecasting. Our dedicated sector analysts deliver actionable, data-driven insights tailored for private equity, hedge funds, and corporate strategy teams. Visit us at http://www.hdinresearch.com.
2026 AI Transparency Footer (C2PA Compliant):
"This intelligence report was authored by HDIN Research analysts following a rigorous audit of official corporate filings. AI was utilized for massive-scale data synthesis and structural drafting, ensuring 100% inclusion of reported data points. All strategic insights, financial modeling, and final verdicts were verified by our editorial board to ensure professional accuracy and compliance with 2026 Google Search E-E-A-T standards."
Figure SharonAl: Institutional Strategic & Financial Blueprint (2026)
Forensic Financials & Segmental Capital AllocationThe company’s underlying unit economics reflect a highly distressed scaling phase. The shift from a legacy digital asset miner to a GPU-as-a-Service (GPUaaS) provider resulted in a 9.6% YoY top-line revenue contraction to $294,014 in Q1 2026. Cost of revenue vastly outpaced top-line generation, collapsing Q1 2026 gross margins to -78.8% (down 8,240 bps YoY from 3.6% in Q1 2025).
Quality of Earnings (QoE) is severely distorted by fair-value accounting and one-off divestitures. A Forensic Analysis of the Q1 2026 statutory net loss of $(20,011,821) reveals a $70,227,754 non-cash fair-value loss on current convertible notes, offset by a $65,919,712 gain from the sale of its Texas Critical Data Centers (TCDC) joint venture in the Permian Basin.
Quantitative Structural Inventory (FY24 to Q1 2026):
* Asset & Liquidity Expansion: Total assets surged 10x from $32,146,452 (FY24) to $313,886,244 (Q1 2026). Liquidity was salvaged via a $125 million February 2026 NASDAQ IPO, pushing the current ratio from a distressed 0.63x (FY25) to 1.04x (Q1 2026), fortified by $164,288,288 in cash.
* Operating Leverage & Burn: Operating Cash Flow (OCF) burn accelerated to $(7,449,588) in Q1 2026. Investing cash outflows hit $(32,720,098), dominated by $42.4 million in equipment lease prepayments.
* Debt Profile: The capital structure is dominated by $199,358,226 in short-term convertible notes (12-15% interest, mature Dec 2027) and a post-quarter $350,000,000 senior convertible note (6.00% interest, matures May 2031 at a ~$48.24 conversion rate). Finance lease liabilities stand at $4,902,764 with an imputed interest rate of 5.72%.
* Segmental Run-Rate: By Q1 2026, GPUaaS contributed 100% of the $294,012 operating revenue, completely replacing the discontinued digital asset mining ($0) and other legacy revenues ($2).
Geopolitical Supply Chain Audit & Infrastructure Footprint
SharonAI bypasses greenfield capital expenditures by renting contiguous colocation space, anchoring its operations in the Asia-Pacific region to capture Australian Federal Government DTA-certified sovereign AI compute demand. The physical footprint is heavily concentrated within NEXTDC Tier IV facilities:
* Melbourne Hub: The M2 facility serves as the locus for a 40 MW contiguous high-density liquid-to-chip deployment. The operational M3 facility utilizes 1.6 MW to host the initial supercluster of 125 servers and 1,000 B200 GPUs.
* Sydney Node: S6 provides 10.75 MW of distributed capacity, while S3 is slated for a 2 MW single B300 cluster.
* Future Capacity Commitments: A September 2026 contract with GreenSquareDC guarantees 15 MW across a 120-month lifecycle.
Supply Chain Monopsony & Geographic Risk:
The company’s hardware procurement presents an acute single-point-of-failure. With zero long-term guaranteed pricing or volume agreements, SharonAI relies entirely on NASDAQ: NVDA for its 2,024-GPU incoming fleet (1,000 B200s, 1,024 B300s). This upstream reliance is geographically tied to NYSE: TSM in Taiwan, Province of China, exposing the hardware pipeline to severe cross-strait geopolitical tail risks. Networking architecture is heavily reliant on the NASDAQ: CSCO 360 Partner Program (spine and leaf topology), while hardware procurement is financed via Lenovo TruScale.
Unrecorded Liabilities & Intellectual Property Vulnerabilities
The reported Q1 2026 Total Liabilities of $225,255,423 fundamentally understate forward encumbrances. The firm’s $1.26 billion (5-year) customer agreement with ESDS Software Solutions and the $950 million APAC tech contract require immediate fulfillment.
* Off-Balance Sheet Traps: SharonAI is bound by a $720,000,000 unrecorded infrastructure CAPEX commitment for the ESDS contract, plus a $92,000,000 noncancelable hardware order with World Wide Technology (WWT). Additional obligations include a $258,000 (AUD$400,000) managed IT services mandate with Andrew Sjoquist Enterprises (ASE) and nearly $1 million in restricted cash locked in certificates of deposit for bank guarantees.
* R&D vs. IP Realities: The company holds zero patents. FY24 R&D efforts were heavily subsidized by $648,049 in Australian R&D grant income (which dropped to $0 in FY25). Its primary IP, the SharonAI Studio PaaS, relies heavily on open-source frameworks, exposing the company to untested "copyleft" software licensing risks and secondary copyright liabilities.
HDIN Institutional Perspective
While management promotes a capital-efficient "asset-light" Neocloud narrative, the operational reality reflects a hardware-intensive, heavily indebted procurement shell heavily reliant on global supply chain perfection. The 69.22% voting control held by three insiders (via Class B Super Shares with 160:1 voting rights)—including former NASDAQ: MIGI and ASX: TLS executives—structurally alienates institutional index funds. We view the $350 million in newly issued 6.00% debt not as growth capital, but as emergency bridging required to prevent technical insolvency triggered by the unrecorded $720 million ESDS CAPEX commitment. If NVIDIA B300 allocations are delayed by even two quarters, the invested capital base will bloat with idle lease assets, severely compressing the projected ROIC and negating the structural viability of their multi-year "take-or-pay" offtake agreements.
Presentation Download & Video Access:
Presentation Download: Click the PDF download link under 'Related Topics' to access the full institutional presentation of this report.
Video Link: Click this link to watch the HDIN analyst briefing on YouTube.
About HDIN Research:
HDIN Research is a premier global market intelligence and strategic advisory firm specializing in institutional-grade financial analysis, supply chain audits, and macroeconomic forecasting. Our dedicated sector analysts deliver actionable, data-driven insights tailored for private equity, hedge funds, and corporate strategy teams. Visit us at http://www.hdinresearch.com.
2026 AI Transparency Footer (C2PA Compliant):
"This intelligence report was authored by HDIN Research analysts following a rigorous audit of official corporate filings. AI was utilized for massive-scale data synthesis and structural drafting, ensuring 100% inclusion of reported data points. All strategic insights, financial modeling, and final verdicts were verified by our editorial board to ensure professional accuracy and compliance with 2026 Google Search E-E-A-T standards."