SRF Limited: High-Margin Fluorochemical Pivot Near Odisha and Dahej as 23.34% EBITDA Surge Signals Peak Operating Leverage
Date : 2026-06-09
Reading : 130
SRF Limited is aggressively cannibalizing its commoditized packaging and textile cash flows to fund a $263.92 million capital pivot toward next-generation Hydrofluoroolefins near its Odisha and Dahej hubs. Driven by Montreal Protocol mandates and systemic Chinese dumping, management is utilizing peak operational leverage to sustain aggregate free cash flow. For institutional LPs, the critical valuation delta lies in SRF’s covert reliance on $239.89 million in off-balance-sheet supply chain financing and receivable discounting to artificially stretch payable days to 180, compressing its cash conversion cycle amid structural macroeconomic headwinds.
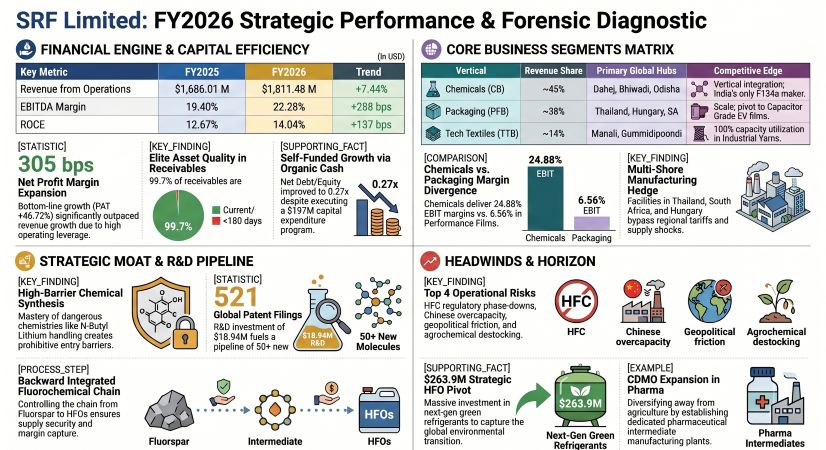
Figure SRF Limited: FY2026 Strategic Performance & Forensic Diagnostic
 Margin Aggregation & Internal Capital Allocation
The FY2026 consolidated architecture of NSE: SRF demonstrates a highly bifurcated profitability profile. The Chemicals Business (CB) acts as the primary margin engine, shielding the enterprise from cyclic compressions in the Performance Films & Foil (PFB) and Technical Textiles (TTB) segments.
Table FY2025–FY2026 Consolidated Financial Performance Analysis
* Operating Leverage & P&L Friction: The 288 bps EBITDA margin expansion masks severe segmental divergence. While PFB and TTB absorbed massive Chinese pricing pressure on packaging films and Polyester Industrial Yarns (PIY), the firm utilized 100% capacity velocity to absorb fixed costs. Bottom-line quality was slightly distorted by a $9.75 M one-off charge for new Labour Codes, perfectly offset by an $11.37 M Carbon Emission Reduction (CER) tax reversal.
* Capital Allocation & Unit Economics: SRF executed a ruthless capital allocation strategy in FY2026. Of the $197.02 M total CapEx, 50.36% ($99.22 M) was forcefully injected into PFB to pivot toward Capacitor Grade BOPP lines (targeting the EV supply chain), while 43.42% ($85.55 M) was deployed to CB. TTB was intentionally starved of capital, receiving just 3.06% ($6.02 M) for minor debottlenecking.
* R&D-to-Moat Translation: SRF allocated $18.94 M toward R&D, skewing 89.33% into operating expenditure to retain elite scientific human capital. This R&D apparatus successfully advanced 35+ molecules to scale-up studies and secured 5 new patents (156 granted globally), establishing a moat in Chiral Chemistry, Photo Bromination, and N-Butyl Lithium handling.
Multi-Shore Defenses & Geo-Economic Moats
SRF’s economic moat is deeply physical, relying on an ecosystem of extreme-hazard chemical engineering and decentralized geographic manufacturing to bypass geopolitical chokepoints.
* Geo-Economic Production Hubs: The firm operates a sprawling infrastructure. Domestic core operations in Dahej (Gujarat), Bhiwadi (Rajasthan), and the newly commissioned Odisha site handle high-hazard fluorochemical syntheses. The technical textiles and films are distributed across Indore, Manali, Gummidipoondi, and Kashipur.
* Tariff Evasion & Near-Shoring: To circumvent US reciprocal tariffs and Middle Eastern shipping bottlenecks, SRF actively leverages its offshore facilities in Thailand, South Africa, and Hungary. The establishment of SRF Middle East LLC in Dubai explicitly localizes supply chains for EMEA markets, neutralizing freight friction which cost the firm $65.78 M in FY2026.
* Supply Chain Localization & Energy Pivot: Raw material procurement is highly insulated, with 72.36% of inputs sourced domestically. To manage the 212,000 MT of Fluorspar and 43,800 MT of Caprolactam consumed annually, SRF utilizes formula-based pricing algorithms. In anticipation of the EU's Carbon Border Adjustment Mechanism (CBAM), SRF pivoted its energy mix, drawing 42.12% from renewables and replacing diesel with Pipeline Natural Gas (PNG) at its Bhiwadi and Dahej hubs, reducing GHG intensity by >9%.
* Tier-1 OEM Integration: The ultimate structural moat is the contractual alliance with The Chemours Company. By acting as a dedicated capacity partner for fluoroelastomers, SRF physically embeds its HFOs and Dymel® propellants into the global semiconductor, aerospace, and EV supply architecture.
HDIN Institutional Perspective: The Synthetic Liquidity Illusion
While the FY2026 balance sheet optically projects a pristine liquidity profile—highlighted by an 80.72% surge in the Debt Service Coverage Ratio (DSCR) to 3.30x and an inventory turnover stabilized at 6.14x (59 days)—a Forensic Analysis reveals a highly engineered working capital cycle. SRF's ability to fund its aggressive $286.87 M FY2027 CapEx is inherently tethered to off-balance-sheet financial engineering.
The company currently sustains its 101–103.88 day payable cycle via a structured Supply Chain Financing (SCF) arrangement covering $139.61 M in trade payables (allowing 175-180 days to settle). Concurrently, $100.28 M in receivables have been irrevocably discounted and derecognized. The Street is pricing SRF based on its 0.27x Net Debt-to-Equity ratio, but fails to account for the $239.89 M in synthetic liquidity. Should institutional banks tighten credit lines due to macro-volatility, SRF's organic cash conversion cycle will face immediate, severe friction, forcing a potential scale-back of its high-margin pharmaceutical CDMO expansions. However, exceptional corporate governance—evidenced by promoter remuneration (Ashish and Kartik Bharat Ram) being strictly capped at 1.02% of statutory net profits with 87% variable linkage—confirms management's alignment with long-term shareholder capital preservation.
Presentation Download & Video Access:
Presentation Download: Click the PDF download link under 'Related Topics' to access the full institutional presentation of this report.
Video Link: Click this link to watch the HDIN analyst briefing on YouTube.
About HDIN Research:
HDIN Research is a premier global market intelligence and strategic advisory firm specializing in institutional-grade financial analysis, supply chain audits, and macroeconomic forecasting. Our dedicated sector analysts deliver actionable, data-driven insights tailored for private equity, hedge funds, and corporate strategy teams. Visit us at http://www.hdinresearch.com.
*2026 AI Transparency Footer (C2PA Compliant):*
"This intelligence report was authored by HDIN Research analysts following a rigorous audit of official corporate filings. AI was utilized for massive-scale data synthesis and structural drafting, ensuring 100% inclusion of reported data points. All strategic insights, financial modeling, and final verdicts were verified by our editorial board to ensure professional accuracy and compliance with 2026 Google Search E-E-A-T standards."
Figure SRF Limited: FY2026 Strategic Performance & Forensic Diagnostic
Margin Aggregation & Internal Capital AllocationThe FY2026 consolidated architecture of NSE: SRF demonstrates a highly bifurcated profitability profile. The Chemicals Business (CB) acts as the primary margin engine, shielding the enterprise from cyclic compressions in the Performance Films & Foil (PFB) and Technical Textiles (TTB) segments.
Table FY2025–FY2026 Consolidated Financial Performance Analysis
| Metric (Consolidated) | FY2025 | FY2026 | Y-o-Y Variance / Structural Driver |
|---|---|---|---|
| Revenue from Operations | $1,686.01M | $1,811.48M | +7.44% (Driven by 16% growth in CB to $892.6M) |
| PBIDT (EBITDA) | $327.17M | $403.54M | +23.34% (Indicators of peak operating leverage) |
| Net Profit (PAT) | $143.53M | $210.58M | +46.72% (Assisted by a decline in finance costs to $31.90M) |
| EBITDA Margin | 19.40% | 22.28% | +288 bps (Effective pass-through pricing in the CB segment) |
| Net Debt to Equity | 0.29× | 0.27× | De-leveraging achieved despite $197.02M of CapEx deployment |
| Return on Capital Employed (ROCE) | 12.67% | 14.04% | +137 bps (Standalone ROCE reached 17.60%) |
* Operating Leverage & P&L Friction: The 288 bps EBITDA margin expansion masks severe segmental divergence. While PFB and TTB absorbed massive Chinese pricing pressure on packaging films and Polyester Industrial Yarns (PIY), the firm utilized 100% capacity velocity to absorb fixed costs. Bottom-line quality was slightly distorted by a $9.75 M one-off charge for new Labour Codes, perfectly offset by an $11.37 M Carbon Emission Reduction (CER) tax reversal.
* Capital Allocation & Unit Economics: SRF executed a ruthless capital allocation strategy in FY2026. Of the $197.02 M total CapEx, 50.36% ($99.22 M) was forcefully injected into PFB to pivot toward Capacitor Grade BOPP lines (targeting the EV supply chain), while 43.42% ($85.55 M) was deployed to CB. TTB was intentionally starved of capital, receiving just 3.06% ($6.02 M) for minor debottlenecking.
* R&D-to-Moat Translation: SRF allocated $18.94 M toward R&D, skewing 89.33% into operating expenditure to retain elite scientific human capital. This R&D apparatus successfully advanced 35+ molecules to scale-up studies and secured 5 new patents (156 granted globally), establishing a moat in Chiral Chemistry, Photo Bromination, and N-Butyl Lithium handling.
Multi-Shore Defenses & Geo-Economic Moats
SRF’s economic moat is deeply physical, relying on an ecosystem of extreme-hazard chemical engineering and decentralized geographic manufacturing to bypass geopolitical chokepoints.
* Geo-Economic Production Hubs: The firm operates a sprawling infrastructure. Domestic core operations in Dahej (Gujarat), Bhiwadi (Rajasthan), and the newly commissioned Odisha site handle high-hazard fluorochemical syntheses. The technical textiles and films are distributed across Indore, Manali, Gummidipoondi, and Kashipur.
* Tariff Evasion & Near-Shoring: To circumvent US reciprocal tariffs and Middle Eastern shipping bottlenecks, SRF actively leverages its offshore facilities in Thailand, South Africa, and Hungary. The establishment of SRF Middle East LLC in Dubai explicitly localizes supply chains for EMEA markets, neutralizing freight friction which cost the firm $65.78 M in FY2026.
* Supply Chain Localization & Energy Pivot: Raw material procurement is highly insulated, with 72.36% of inputs sourced domestically. To manage the 212,000 MT of Fluorspar and 43,800 MT of Caprolactam consumed annually, SRF utilizes formula-based pricing algorithms. In anticipation of the EU's Carbon Border Adjustment Mechanism (CBAM), SRF pivoted its energy mix, drawing 42.12% from renewables and replacing diesel with Pipeline Natural Gas (PNG) at its Bhiwadi and Dahej hubs, reducing GHG intensity by >9%.
* Tier-1 OEM Integration: The ultimate structural moat is the contractual alliance with The Chemours Company. By acting as a dedicated capacity partner for fluoroelastomers, SRF physically embeds its HFOs and Dymel® propellants into the global semiconductor, aerospace, and EV supply architecture.
HDIN Institutional Perspective: The Synthetic Liquidity Illusion
While the FY2026 balance sheet optically projects a pristine liquidity profile—highlighted by an 80.72% surge in the Debt Service Coverage Ratio (DSCR) to 3.30x and an inventory turnover stabilized at 6.14x (59 days)—a Forensic Analysis reveals a highly engineered working capital cycle. SRF's ability to fund its aggressive $286.87 M FY2027 CapEx is inherently tethered to off-balance-sheet financial engineering.
The company currently sustains its 101–103.88 day payable cycle via a structured Supply Chain Financing (SCF) arrangement covering $139.61 M in trade payables (allowing 175-180 days to settle). Concurrently, $100.28 M in receivables have been irrevocably discounted and derecognized. The Street is pricing SRF based on its 0.27x Net Debt-to-Equity ratio, but fails to account for the $239.89 M in synthetic liquidity. Should institutional banks tighten credit lines due to macro-volatility, SRF's organic cash conversion cycle will face immediate, severe friction, forcing a potential scale-back of its high-margin pharmaceutical CDMO expansions. However, exceptional corporate governance—evidenced by promoter remuneration (Ashish and Kartik Bharat Ram) being strictly capped at 1.02% of statutory net profits with 87% variable linkage—confirms management's alignment with long-term shareholder capital preservation.
Presentation Download & Video Access:
Presentation Download: Click the PDF download link under 'Related Topics' to access the full institutional presentation of this report.
Video Link: Click this link to watch the HDIN analyst briefing on YouTube.
About HDIN Research:
HDIN Research is a premier global market intelligence and strategic advisory firm specializing in institutional-grade financial analysis, supply chain audits, and macroeconomic forecasting. Our dedicated sector analysts deliver actionable, data-driven insights tailored for private equity, hedge funds, and corporate strategy teams. Visit us at http://www.hdinresearch.com.
*2026 AI Transparency Footer (C2PA Compliant):*
"This intelligence report was authored by HDIN Research analysts following a rigorous audit of official corporate filings. AI was utilized for massive-scale data synthesis and structural drafting, ensuring 100% inclusion of reported data points. All strategic insights, financial modeling, and final verdicts were verified by our editorial board to ensure professional accuracy and compliance with 2026 Google Search E-E-A-T standards."