Toyota Motor Corporation: CapEx Pivot Near North Carolina and Shanghai as $9.23 Billion Tariff Hit Signals North American Margin Collapse
Date : 2026-06-12
Reading : 315
In FY2026, Toyota Motor Corporation absorbed a massive $9.23 billion operating profit hit from US protectionist tariffs, directly driving North American margins into a $1.29 billion loss despite an 8.5% volume expansion. To insulate operations from geopolitical fragmentation, management is aggressively localizing its battery supply chain—deploying heavy CapEx into North Carolina and Shanghai—while executing a $24.45 billion share buyback to artificially defend EPS. For institutional LPs, this pivot highlights a brutal reality: manufacturing scale no longer guarantees margin resilience without strict supply chain sovereignty and tactical financial engineering.
Figure Toyota FY2026 Strategic Blueprint: Navigating Mobility 3.0 Amidst Geopolitical Volatility
 Forensic Margin Deconstruction & Segmental Capital Allocation
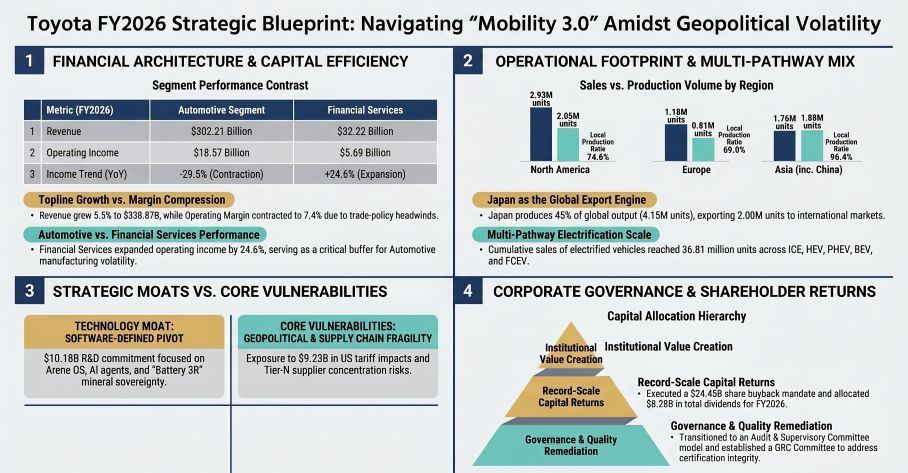
Toyota’s FY2026 financial architecture demonstrates a severe divergence between volume growth and operational profitability. While the consolidated topline expanded 5.5% YoY to $338.87 billion, operating margins contracted from 10.0% to 7.4%. The structural breakeven point has risen substantially, necessitating a heavy reliance on the Financial Services segment to absorb automotive manufacturing shocks.
Segmental & Financial Inventory:
* Consolidated Revenue & Profit: Total revenue reached $338.87 billion (¥50.68 trillion). Operating income declined 21.5% YoY to $25.18 billion, with net income attributable to owners falling 19.2% to $25.73 billion.
* Geographic Margin Inversion: North America generated $138.14 billion in revenue (2.93 million units) but swung to a $1.29 billion operating loss due to tariffs and overhead. Conversely, Japan remains the primary profit engine, producing 4.15 million units and generating $15.52 billion in operating profit.
* Financial Services Moat: Acting as a critical operational hedge, this segment generated $32.22 billion in revenue and expanded operating income by 24.6% to $5.69 billion, backed by a $260.52 billion portfolio of retail/wholesale loans.
* R&D vs. Capitalization: Toyota maintains highly conservative accounting, expensing 93.0% of its $10.18 billion R&D outlay immediately. Only $713.73 million was capitalized as intangible development assets.
* Contingent Liabilities: Quality Assurance Liabilities grew to $14.03 billion, with $9.57 billion specifically earmarked for product recalls, following significant domestic vehicle certification irregularities.
* Shareholder Return Mechanics: Management authorized a $24.45 billion tender offer settling on May 25, 2026, retiring 1.19 billion shares. The parent-level dividend payout ratio expanded to 36.4% ($0.635/share), supported by a $36.59 billion operating cash flow.
Physical Infrastructure Audit & Geopolitical Moat
To counter supply chain decoupling and raw material inflation, Toyota is actively unwinding its traditional linear procurement model in favor of a closed-loop "Battery 3R" (Reduce, Reuse, Recycle) ecosystem. The physicality of this transition requires intense regional localization to bypass cross-border friction.
Supply Chain Sovereignty & Facility Footprint:
* North American Localization: Toyota is deploying multi-billion-dollar CapEx into the Toyota Battery Manufacturing facility in North Carolina, aiming to match the 74.6% local vehicle production ratio with localized battery cell integration.
* Asian & Japanese Hubs: In China, the newly established Lexus (Shanghai) New Energy aims to insulate EV development from global tariffs, complementing existing 50/50 joint ventures like FAW Toyota and GAC Toyota. In Japan, heavy capital continues to flow into Prime Planet Energy & Solutions (a Panasonic JV) and the Toyota Woven City incubator launched in September 2025.
* Keiretsu Ecosystem Restructuring: Toyota purchased $95.20 billion in inventory from related-party Tier-1 suppliers (e.g., Denso, Aisin) in FY2026. However, legacy cross-shareholdings are being liquidated—evidenced by the $5.27 billion asset reclassification tied to taking Toyota Industries private—freeing trapped capital for Software-Defined Vehicle (SDV) infrastructure.
* Risk & Vulnerabilities: Management explicitly warns of "Tier-N" supplier concentration risks. While direct Tier-1 networks are diversified, acute bottlenecks remain in critical minerals (Lithium, Cobalt, Nickel) sourced from specialized lower-tier vendors vulnerable to geopolitical sanctions.
HDIN Institutional Perspective
The Street continues to model Toyota as a lagging transition story, overly focused on its delayed Battery Electric Vehicle (BEV) rollout. However, Forensic Analysis of the FY2026 footnotes reveals a highly tactical capital retention strategy that equity markets are mispricing.
While the "Multi-Pathway" strategy is publicly billed as an environmental transition hedge, it is practically functioning as a massive cash flow preservation mechanism. By refusing to allocate stranded CapEx into margin-negative BEV volume, Toyota generated $36.59 billion in operating cash flow. The true institutional signal is not the $10.18 billion spent on R&D for the "Arene" platform; it is the aggressive financial engineering. By warehousing 2.79 billion treasury shares (17.64% of issued stock) and executing a $24.45 billion buyback, Toyota is artificially establishing an EPS floor to weather the $9.23 billion US tariff shock. If the Governance, Risk, and Compliance (GRC) Committee can successfully remediate the $14.03 billion quality assurance leakage tied to recent certification scandals, the mathematically compressed equity base guarantees an outsized EPS expansion the moment US trade headwinds normalize.
Presentation Download & Video Access:
Presentation Download: Click the PDF download link under 'Related Topics' to access the full institutional presentation of this report.
Video Link: Click this link to watch the HDIN analyst briefing on YouTube.
About HDIN Research:
HDIN Research is a premier global market intelligence and strategic advisory firm specializing in institutional-grade financial analysis, supply chain audits, and macroeconomic forecasting. Our dedicated sector analysts deliver actionable, data-driven insights tailored for private equity, hedge funds, and corporate strategy teams. Visit us at http://www.hdinresearch.com.
*2026 AI Transparency Footer (C2PA Compliant):*
"This intelligence report was authored by HDIN Research analysts following a rigorous audit of official corporate filings. AI was utilized for massive-scale data synthesis and structural drafting, ensuring 100% inclusion of reported data points. All strategic insights, financial modeling, and final verdicts were verified by our editorial board to ensure professional accuracy and compliance with 2026 Google Search E-E-A-T standards."
Figure Toyota FY2026 Strategic Blueprint: Navigating Mobility 3.0 Amidst Geopolitical Volatility
Forensic Margin Deconstruction & Segmental Capital AllocationToyota’s FY2026 financial architecture demonstrates a severe divergence between volume growth and operational profitability. While the consolidated topline expanded 5.5% YoY to $338.87 billion, operating margins contracted from 10.0% to 7.4%. The structural breakeven point has risen substantially, necessitating a heavy reliance on the Financial Services segment to absorb automotive manufacturing shocks.
Segmental & Financial Inventory:
* Consolidated Revenue & Profit: Total revenue reached $338.87 billion (¥50.68 trillion). Operating income declined 21.5% YoY to $25.18 billion, with net income attributable to owners falling 19.2% to $25.73 billion.
* Geographic Margin Inversion: North America generated $138.14 billion in revenue (2.93 million units) but swung to a $1.29 billion operating loss due to tariffs and overhead. Conversely, Japan remains the primary profit engine, producing 4.15 million units and generating $15.52 billion in operating profit.
* Financial Services Moat: Acting as a critical operational hedge, this segment generated $32.22 billion in revenue and expanded operating income by 24.6% to $5.69 billion, backed by a $260.52 billion portfolio of retail/wholesale loans.
* R&D vs. Capitalization: Toyota maintains highly conservative accounting, expensing 93.0% of its $10.18 billion R&D outlay immediately. Only $713.73 million was capitalized as intangible development assets.
* Contingent Liabilities: Quality Assurance Liabilities grew to $14.03 billion, with $9.57 billion specifically earmarked for product recalls, following significant domestic vehicle certification irregularities.
* Shareholder Return Mechanics: Management authorized a $24.45 billion tender offer settling on May 25, 2026, retiring 1.19 billion shares. The parent-level dividend payout ratio expanded to 36.4% ($0.635/share), supported by a $36.59 billion operating cash flow.
Physical Infrastructure Audit & Geopolitical Moat
To counter supply chain decoupling and raw material inflation, Toyota is actively unwinding its traditional linear procurement model in favor of a closed-loop "Battery 3R" (Reduce, Reuse, Recycle) ecosystem. The physicality of this transition requires intense regional localization to bypass cross-border friction.
Supply Chain Sovereignty & Facility Footprint:
* North American Localization: Toyota is deploying multi-billion-dollar CapEx into the Toyota Battery Manufacturing facility in North Carolina, aiming to match the 74.6% local vehicle production ratio with localized battery cell integration.
* Asian & Japanese Hubs: In China, the newly established Lexus (Shanghai) New Energy aims to insulate EV development from global tariffs, complementing existing 50/50 joint ventures like FAW Toyota and GAC Toyota. In Japan, heavy capital continues to flow into Prime Planet Energy & Solutions (a Panasonic JV) and the Toyota Woven City incubator launched in September 2025.
* Keiretsu Ecosystem Restructuring: Toyota purchased $95.20 billion in inventory from related-party Tier-1 suppliers (e.g., Denso, Aisin) in FY2026. However, legacy cross-shareholdings are being liquidated—evidenced by the $5.27 billion asset reclassification tied to taking Toyota Industries private—freeing trapped capital for Software-Defined Vehicle (SDV) infrastructure.
* Risk & Vulnerabilities: Management explicitly warns of "Tier-N" supplier concentration risks. While direct Tier-1 networks are diversified, acute bottlenecks remain in critical minerals (Lithium, Cobalt, Nickel) sourced from specialized lower-tier vendors vulnerable to geopolitical sanctions.
HDIN Institutional Perspective
The Street continues to model Toyota as a lagging transition story, overly focused on its delayed Battery Electric Vehicle (BEV) rollout. However, Forensic Analysis of the FY2026 footnotes reveals a highly tactical capital retention strategy that equity markets are mispricing.
While the "Multi-Pathway" strategy is publicly billed as an environmental transition hedge, it is practically functioning as a massive cash flow preservation mechanism. By refusing to allocate stranded CapEx into margin-negative BEV volume, Toyota generated $36.59 billion in operating cash flow. The true institutional signal is not the $10.18 billion spent on R&D for the "Arene" platform; it is the aggressive financial engineering. By warehousing 2.79 billion treasury shares (17.64% of issued stock) and executing a $24.45 billion buyback, Toyota is artificially establishing an EPS floor to weather the $9.23 billion US tariff shock. If the Governance, Risk, and Compliance (GRC) Committee can successfully remediate the $14.03 billion quality assurance leakage tied to recent certification scandals, the mathematically compressed equity base guarantees an outsized EPS expansion the moment US trade headwinds normalize.
Presentation Download & Video Access:
Presentation Download: Click the PDF download link under 'Related Topics' to access the full institutional presentation of this report.
Video Link: Click this link to watch the HDIN analyst briefing on YouTube.
About HDIN Research:
HDIN Research is a premier global market intelligence and strategic advisory firm specializing in institutional-grade financial analysis, supply chain audits, and macroeconomic forecasting. Our dedicated sector analysts deliver actionable, data-driven insights tailored for private equity, hedge funds, and corporate strategy teams. Visit us at http://www.hdinresearch.com.
*2026 AI Transparency Footer (C2PA Compliant):*
"This intelligence report was authored by HDIN Research analysts following a rigorous audit of official corporate filings. AI was utilized for massive-scale data synthesis and structural drafting, ensuring 100% inclusion of reported data points. All strategic insights, financial modeling, and final verdicts were verified by our editorial board to ensure professional accuracy and compliance with 2026 Google Search E-E-A-T standards."