Guangdong Sinopatt Semiconductor Technology Co., Ltd.: $146.09 Million CapEx Deployment Near Dongguan Eco-Park Campus as 81.28% Client Concentration Signals Severe Oligopolistic Vulnerability
Date : 2026-06-16
Reading : 92
HDIN Executive Takeaways
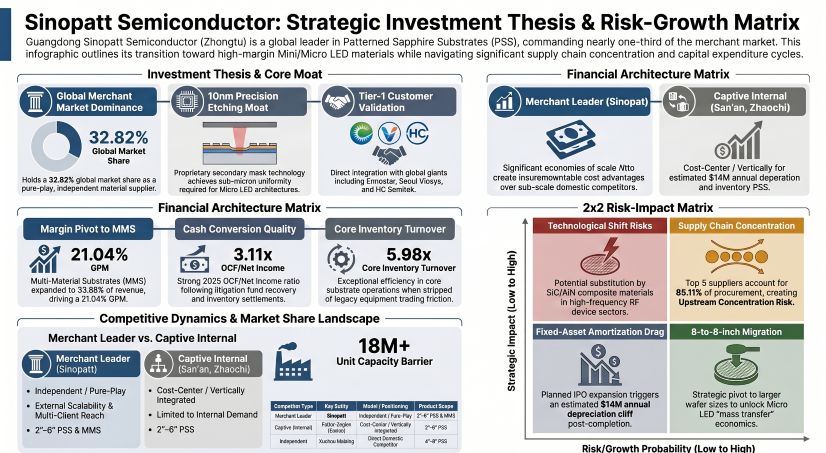
* Operational Margins Mask Core Contraction: While Guangdong Sinopatt Semiconductor Technology Co., Ltd. operated at a 96.41% capacity utilization rate in 2025, core net profit contracted 31.9% year-over-year to $8.62 million. A $2.51 million one-off debt restructuring gain artificially distorted the bottom line, smoothing over acute downward pricing pressures (-5.84% on PSS units) in the upstream Gallium Nitride (GaN) LED supply chain.
* Working Capital Friction via Shanghai Retrofits: The firm’s inventory turnover deteriorated to 1.06x, bogged down by a massive $78.52 million stockpile of decommissioned overseas semiconductor equipment managed partially through its Shanghai Tanyue subsidiary. If this illiquid equipment trading arm is excluded, core substrate turnover remains highly efficient at 5.98x.
* Impending CapEx Depreciation Cliff: The allocation of $146.09 million in IPO proceeds toward a 6-to-8-inch Multi-Material Substrate (MMS) transition will trigger an estimated $14.00 million annual depreciation tax on future gross margins, a structural vulnerability given the company’s 81.28% revenue dependency on merely five downstream chipmakers.
Figure Sinopatt Semiconductor: Strategic Investment Thesis & Risk-Growth Matrix
Segmental Realities and Margin Compression
Guangdong Sinopatt Semiconductor Technology Co., Ltd. [STAR: SINOPATT] commands a 32.82% global market share in the merchant patterned substrate sector, yet exhibits a transitional financial profile characterized by top-line contraction and working capital drag. Consolidated revenue fell 12.8% cumulatively, recording $168.11 million (2023), $159.89 million (2024), and $146.57 million (2025). Main business revenue followed this trajectory at $130.03 million, $145.08 million, and $137.55 million, respectively.
Despite top-line compression, consolidated Gross Profit Margin (GPM) expanded from 16.25% (2023) to 21.04% (2025), driven strictly by raw material procurement cost suppression rather than pricing power. In 2025, average selling prices for Patterned Sapphire Substrates (PSS) and Multi-Material Substrates (MMS) dropped by 5.84% and 3.43%, respectively. Net profit recorded $10.31 million, $13.14 million, and $11.71 million across the three-year period, maintaining a Net Profit Margin (NPM) between 6.1% and 8.2%.
Revenue Architecture & Product Stratification
* Patterned Sapphire Substrates (PSS): $94.90 million (72.98% of main revenue in 2023) → $100.48 million (69.26% in 2024) → $90.67 million (65.92% in 2025). 2025 GPM stood at 19.57%.
* Multi-Material Substrates (MMS): $34.70 million (26.69% in 2023) → $44.35 million (30.57% in 2024) → $46.58 million (33.86% in 2025). MMS revenue grew 27.79% in 2024 and 5.03% in 2025. 2025 GPM stood at 23.90%.
* Entrusted Processing: $0.44 million (0.34% in 2023) → $0.25 million (0.17% in 2024) → $0.30 million (0.22% in 2025).
* Geographic Mix (Mainland China): $116.12 million (89.30% in 2023) → $130.98 million (90.29% in 2024) → $131.96 million (95.94% in 2025).
* Geographic Mix (Overseas - Taiwan, Province of China; South Korea; USA): $13.91 million (10.70% in 2023) → $14.10 million (9.71% in 2024) → $5.59 million (4.06% in 2025).
Fiscal Dependencies & Earnings Distortions
Core operations are augmented by non-operating fiscal levers. Total Profit (Profit Before Tax) recorded $12.17 million (2023), $13.82 million (2024), and $12.11 million (2025).
* Government Grants: Recognized primarily via $3.71 million in Deferred Income amortized into "Other Income." Grants contributed $0.67 million (5.53% of Total Profit in 2023), $1.49 million (10.79% in 2024), and $1.16 million (9.60% in 2025).
* Estimated Tax Relief (15% High-Tech Rate): Contributed $1.60 million (13.15%), $2.61 million (18.92%), and $2.06 million (17.03%). Total fiscal dependency aggregated to 18.68%, 29.71%, and 26.63% across the three years.
* Non-Recurring P&L Distortion: In 2025, non-recurring items surged to $3.09 million (26.41% of total net profit). This artificially smoothed a 31.9% contraction in Core Net Profit, which plummeted from $12.65 million in 2024 to $8.62 million in 2025. The distortion was anchored by a $2.51 million (18.06 million CNY) debt restructuring gain.
Operational Metrics & Capacity Constraints (4-inch equivalent)
* Annual Capacity: 17.99 million (2023) → 19.30 million (2024) → 19.38 million (2025).
* Actual Output: 16.30 million (2023) → 18.86 million (2024) → 18.68 million (2025).
* Sales Volume: 16.15 million (2023) → 18.92 million (2024) → 18.85 million (2025).
* Utilization & Liquidation: Capacity utilization peaked at 97.70% in 2024, closing at 96.41% in 2025. Sales-to-Output ratios consistently breached parity: 99.11%, 100.34%, and 100.90%.
Working Capital Cycles & Balance Sheet Solvency
The consolidated asset-liability ratio stabilized at 35.15% (2023), 37.02% (2024), and 36.09% (2025), with 2025 current and quick ratios at 1.92x and 1.13x. Short-term borrowings dropped from $31.85 million in 2024 to $7.62 million in 2025, while new long-term dedicated debt reached $4.74 million.
* Receivables (DSO): Accounts Receivable turnover compressed from 3.11x to 1.97x, extending DSO from approximately 117 days to 185 days. Bad debt provisions stand at $3.77 million. The firm impaired 100% of a $3.56 million exposure to Wuhu Dehao before recovering $2.31 million via the aforementioned restructuring.
* Operating Cash Flow (OCF): Exhibited extreme variance: $18.91 million (2023) → -$14.91 million (2024) → $34.68 million (2025). The 2025 OCF/Net Income conversion rebounded to an exceptional 3.11x.
Inventory Structural Breakdown ($94.47 million / 679.01 million CNY in 2025)
Total inventory turnover decelerated from 1.30x (2023) to 1.21x (2024) to 1.06x (2025), drastically trailing the peer average of 3.00x (e.g., San'an Optoelectronics, Focus Lightings). This friction is isolated entirely within the equipment trading segment.
* Raw Materials ($35.51M): Core sapphire flats represent only $3.36 million; decommissioned equipment awaiting modification represents $32.15 million.
* Work-in-Progress ($15.93M): Traditional substrate WIP represents $2.37 million; equipment undergoing retrofitting accounts for $13.56 million.
* Finished Goods ($42.27M): Standard PSS/MMS products represent $5.97 million; finalized equipment ready for sale represents $36.30 million.
* Shipped Goods ($11.74M): Substrates pending client acceptance.
* Impairment Profile: The total inventory impairment provision surged from $4.73 million (2023) to $11.76 million (2025). The decommissioned equipment asset block totals $78.52 million (564.33 million CNY), representing 33.95% of current assets. Consequently, $7.56 million (64%) of the 2025 provision is directly tied to this equipment, reaching up to $9.87 million via aggressive 95% depreciation rates (5% residual value) applied to illiquid diffusion furnaces and curing machines.
Infrastructure Layout and Regional Moats
Guangdong Sinopatt Semiconductor Technology Co., Ltd. operates a highly concentrated infrastructure matrix centralized in Guangdong Province, utilizing proprietary secondary mask etching technology capable of etching 1 to 10 billion nano-scale cone structures with 10nm precision and ±50nm uniformity tolerances. The manufacturing ecosystem heavily favors in-house execution, with entrusted third-party OEM processing generating a negligible 0.22% of revenue.
Physical Footprint & Capability Centers
* Songshan Lake Campus (Dongguan, Guangdong): The principal headquarters and manufacturing epicenter. This site houses interconnected Plant 1 and Plant 2, generating the entirety of the 19.38 million unit substrate capacity.
* Eco-Park Campus (Dongguan, Guangdong): Currently under construction with an anticipated $138.17 million physical investment for the "Mini/Micro LED & Auto LED Project." Construction in Progress (CIP) reached $31.96 million (229.69 million CNY) in 2025. The company mortgaged 40,000.96 square meters of land use rights here (No. 56 Road and Dongyuan Avenue) to China Merchants Bank.
* Shanghai Tanyue Semiconductor Equipment Co., Ltd. (80% Subsidiary, Pudong New Area): Acts as a supply chain hedge, retrofitting decommissioned lithography machines for internal application and external trading.
* Dongguan Sinak Material Technology Co., Ltd. (100% Subsidiary, Dongguan): Dedicated to Silicon Carbide (SiC) consumables, specifically SiC trays and aluminum tray covers.
* Overseas Sales Hubs (Sinopatt Korea, Seoul; Sinopatt HK, Hong Kong): Established to execute direct sales (99.31% of total revenue) to premium clients like Seoul Viosys and Ennostar, completely phasing out legacy third-party distributors Jingzhi and EGK.
Oligopolistic Supply Chain Dependencies
The firm's customer architecture exposes severe dependency. Top 5 client concentration climbed from 69.35% (2023) to 77.16% (2024), peaking at 81.28% ($119.13 million) in 2025. The 2025 client ledger is dominated by HC Semitek (29.67%), Jucan Optoelectronics (21.99%), Ennostar (16.15%), Focus Lightings (9.62%), and Fujian Electronics Information Group (3.85%).
Simultaneously, Top 5 supplier concentration surged from 69.61% (2023) to 85.11% ($78.85 million) in 2025, operating primarily under a Vendor Managed Inventory (VMI) model. Domestic sapphire flat wafer sourcing relies acutely on Yunnan Lanjing (a wholly-owned subsidiary of client HC Semitek, providing 38.71%), Qingdao Huaxin Jingdian (23.41%), and Aurora (12.13%). Overseas procurement is highly exposed to semiconductor CapEx cycles, evidenced by a single $20.54 million to $20.67 million (14,856.40 million CNY converted) purchase of legacy lithography machines from SurplusGLOBAL, Inc. in 2024, representing 16.96% of total procurement that year. An earlier $4.64 million prepayment to Capital Asset Exchange and Trading, LLC failed, triggering a CIETAC Shanghai Sub-Commission arbitration that successfully recovered $4.35 million plus $0.20 million in compensation in July 2025.
Innovation Ecosystem & Talent Architecture
R&D expenditures remained absolute at $7.68 million (2023), $7.66 million (2024), and $7.62 million (2025), mathematically rising from 4.57% to 5.20% of the declining revenue base. All internal research expenditures are 100% expensed to the P&L. The IP moat is robust, containing 133 authorized patents (51 Invention, 79 Utility Model, 3 Design). Of the 51 Invention patents, 43 (84.3%) are solely self-developed, 1 was co-developed with Peking University, and 7 were acquired via transfer.
To mitigate human capital flight, the firm institutes extreme financial switching costs for its 92 R&D personnel (total 2025 R&D payroll: $3.46 million / 2,490.61 million CNY; baseline average: $37,665 USD). The top 5 core scientific personnel command massive premiums: Chairman Kang Kai ($385,850 / 277.33w CNY), Zhang Neng ($125,217 / 90.00w CNY), Wang Zirong ($117,746 / 84.63w CNY), Zhang Jianqiao ($114,073 / 81.99w CNY), and Lu Qianjun ($97,307 / 69.94w CNY). Equity incentives ($3.47 million, $1.82 million, and $1.76 million in share-based payment expenses from 2023-2025) anchor talent to three platforms: Dongguan Turui (3.34%), Dongguan Tuhong (3.29%), and Dongguan Tuke (0.31%). Kang Kai directly holds 0.90%, totaling 3.81% equity under strict 36-month lock-ups and 25% annual sell-down limits.
HDIN Institutional Verdict
Guangdong Sinopatt Semiconductor Technology Co., Ltd. is utilizing its IPO as an exit valve for a choked manufacturing ceiling, deploying $146.09 million of a total $194.52 million investment plan. Capital extraction is highly concentrated: $138.17 million total ($104.35 million IPO) targeting Mini/Micro LED Industrialization to add 5 million pieces of 4-to-6-inch PSS and 2.2 million pieces of MMS; $28.52 million total ($13.91 million IPO) for an Engineering Tech R&D Center to accelerate 6-to-8-inch migrations and GaN-on-Sapphire RF architectures; and $27.83 million in pure supplemental working capital.
However, management’s aggressive CapEx footprint introduces a severe capitalization cliff. Once the $31.96 million Eco-Park CIP transitions to fixed assets, the firm faces an estimated annual depreciation and amortization tax of $14.00 million (100.65 million CNY). If Micro LED commercialization by tier-1 brands (Apple, Samsung, Meta) delays further, this unabsorbed depreciation will mathematically crush net margins.
Furthermore, off-balance sheet leverage and controller concentration present acute governance risks. Actual Controller Chen Jianmin (direct 46.39%, indirect 33.27% via Zhongmin Holding) exercises 79.66% pre-IPO voting rights. The company relies entirely on Chen’s related party, Guangda Enterprise Group, for joint-liability bank guarantees, operating credit lines of $32.00 million (ICBC), $23.65 million and $11.13 million (China Merchants Bank), $16.70 million (Bank of Dongguan), and $13.91 million (CITIC Bank) without counter-pledges. Secondary encumbrances include Patent No. ZL202320922166.3 pledged to ICBC for a $0.83 million (6.00 million CNY) line and $0.28 million (2.00 million CNY) in notes pledged for bill pools. Operational RPTs are immaterial—sales to affiliate Zhongjing Technology topped at $0.95 million (0.65% of revenue)—and clear technical boundaries exist against Chen’s other entity, Zhongjia Semiconductor (MOCVD/HVPE homogeneous GaN laser substrates).
Ultimately, HDIN Research assesses that the firm's merchant position is critically exposed to the "Captive" threat. Subsidiaries of vertically integrated giants (Fujian Jing'an for San'an Optoelectronics; Zhaochi Semiconductor for Zhaochi) operate exclusively as internal cost-centers. If Sinopatt's core clients, who represent an 81.28% concentration, opt to expand their own captive substrate integration, or if substitute materials like Silicon Carbide (SiC) and Aluminum Nitride (AlN) accelerate, Sinopatt's $78.52 million legacy equipment stockpile and impending Eco-Park capacity will rapidly devolve into stranded assets. The firm successfully survived a malicious $7.42 million (53.34 million CNY) fund freeze by Guangfa Bank (Harbin Branch) regarding a Qiuguan Optoelectronics dispute and a $208.70 (1,500 CNY) Shenzhen Customs fine, proving legal resilience, but macroeconomic exposure remains strictly unhedged.
Presentation Download & Video Access:
- Presentation Download: Click the PDF download link under 'Related Topics' to access the full institutional presentation of this report.
- Video Link: Click this link to watch the HDIN analyst briefing on YouTube.
About HDIN Research:
HDIN Research is a premier global market intelligence and strategic advisory firm specializing in institutional-grade financial analysis, supply chain audits, and macroeconomic forecasting. Our dedicated sector analysts deliver actionable, data-driven insights tailored for private equity, hedge funds, and corporate strategy teams. Visit us at http://www.hdinresearch.com.
2026 AI Transparency Footer:
"This intelligence report was authored by HDIN Research analysts following a rigorous audit of official corporate filings. AI was utilized for massive-scale data synthesis and structural drafting, ensuring 100% inclusion of reported data points. All strategic insights, financial modeling, and final verdicts were verified by our editorial board to ensure professional accuracy and compliance with 2026 Google Search E-E-A-T standards."