Aisin Corporation: $1,493.3M R&D Realignment Near Anjo Hub as 9.5-Day Cash Cycle Expansion Signals Supply Chain Liquidity Contraction
Date : 2026-06-15
Reading : 209
HDIN Executive Takeaways
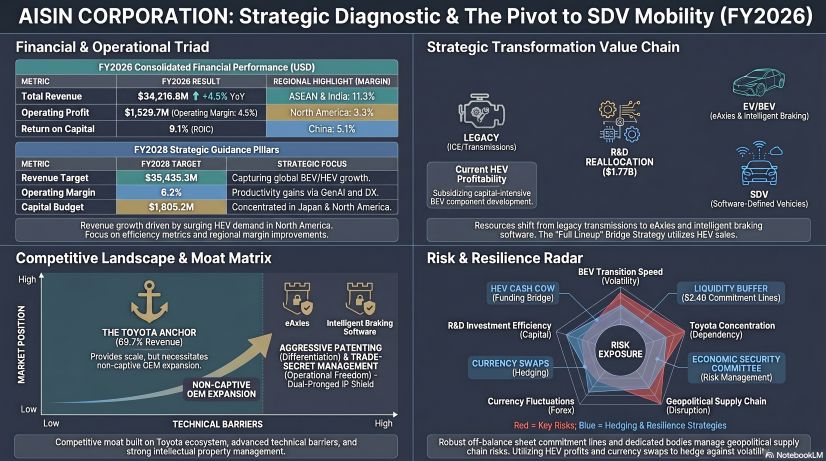
* FY2026 consolidated revenue expanded 4.5% year-over-year to $34,216.8M, yielding an operating margin of 4.5% ($1,529.7M), trailing management’s 6.2% FY2028 margin target as the dual capital burden of legacy internal combustion engine (ICE) support and battery electric vehicle (BEV) R&D compresses immediate profitability.
* Deep integration with Toyota Motor Corporation guarantees scale, driving $23,855.0M (69.7% of total revenue) to the top line, but triggers systemic platform cancellation risks, evidenced by a $30.8M intangible asset impairment localized in Japan over aborted OEM vehicle development.
* Days Payable Outstanding (DPO) compressed from 78.2 to 71.4 days following a 45.3% reduction in electronic notes payable, signaling active downstream liquidity bailouts of tier-2 suppliers amidst severe raw material inflation.
Figure AISIN CORPORATlON: Strategic Diagnostic & The Pivot to SDV Mobility (FY2026)
 Segmental Realities and Margin Compression
Aisin Corporation operates under structural capital constraints, actively monetizing a global resurgence in Hybrid Electric Vehicle (HEV) and Plug-in Hybrid (PHEV) demand to fund its capital-intensive pivot toward Software-Defined Vehicle (SDV) components. In FY2026, the company deployed $1,775.1M in R&D (reported as $1,774.4M consolidated) alongside $1,493.3M (reported alternately as $1,493.2M) in capital expenditures. FY2028 financial targets dictate a total top-line of $35,435.3M, an operating profit of $2,206.3M (6.2% margin), a Return on Invested Capital (ROIC) of 11.0% (currently 9.1%), and a Return on Equity (ROE) of 10.0% (currently 8.2%). Management targets $1,805.2M in FY2028 CAPEX.
Total production value reached $39,902.1M (+4.6% YoY) across the fiscal year. Segmental performance demonstrates a deep divergence in regional profitability:
Table FY2026 Revenue and Operating Performance by Geographic Region
Top-line revenue generated by the core Automotive Parts Division reached $33,372.7M (97.5% of total revenue). Sales to the broader Toyota Group accounted for 69.7% of total revenue, with direct sales to Toyota Motor Corporation totaling $10,104.1M (29.5%). Non-captive OEM and other customer sales reached $9,517.6M. The Energy Solutions & Other division generated $844.2M (2.5%), anchored by gas heat pump air conditioners and next-generation incubation vectors like Bio-M-Coke and Perovskite solar cells.
Analysis of working capital reveals a 9.5-day deterioration in the Cash Conversion Cycle (CCC), shifting from 21.4 days in FY2025 to 30.9 days in FY2026.
* Days Sales Outstanding (DSO) lengthened slightly from 54.9 days to 55.2 days, with total receivables moving from $4,928.9M against FY2025 revenue of $32,734.8M to $5,173.5M against FY2026 revenue of $34,216.8M.
* Days Inventory Outstanding (DIO) expanded by 2.4 days (44.7 to 47.1 days) as inventory climbed from $3,544.1M to $3,879.6M against COGS of $28,967.4M (FY2025) and $30,078.7M (FY2026). A prior $21.8M inventory write-down reversed into a $35.7M liquidation gain driven by legacy HEV demand.
* Days Payable Outstanding (DPO) compressed from 78.2 to 71.4 days. Total payables declined from $6,208.5M to $5,880.5M. While standard accounts payable remained flat ($2,686.0M to $2,701.0M), notes payable and electronically recorded obligations plummeted 45.3% from $606.6M to $332.0M.
Financial exposure on the balance sheet is anchored by $676.44M in total quality defect vulnerabilities. Accrued expenses for realized market treatments total $521.59M. A separate product warranty provision holds $154.85M, part of a total $278.96M warranty provision. A structural accounting shift to a "comprehensive provision at the time of sale" model generated a $39.19M margin relief recorded in SG&A. Additionally, the company recognized a $101.8M total impairment loss. The China segment recognized $57.3M in fixed asset impairments tied to legacy Automatic Transmission (AT) depreciation. Intangible asset write-downs reached $30.9M globally, with $30.8M explicitly isolated in Japan due to OEM platform cancellations. Asset Retirement Obligations (ARO) are systematically capitalized within Property, Plant, and Equipment without a standalone material provision. Unrecognized capital commitments stand at $258.97M, backstopped by a completely undrawn $2,406.92M syndicated commitment line. Equity-method affiliates carry a book value of $565.06M, contributing $37.29M in net profit and $46.06M in comprehensive income, stabilizing after the prior fiscal year’s $108.43M loss on the divestiture of EXEDY Corporation.
Infrastructure Layout and Regional Moats
The company’s global footprint is heavily localized to proximity-serve regional automakers, mitigate export tariffs, and absorb supply chain shocks. The consolidated workforce numbers 113,292 permanent employees alongside an average of 23,417 temporary workers.
* Japan (Mother Plants & Advanced R&D): Total regional output hit $21,533.4M (+2.7%). Hubs in Anjo, Nishio, Tahara, and Okazaki control powertrain components, eAxles, and Energy Solutions. Handa handles Chassis, Braking systems, and Location-Based Services (LBS), while Shintoyo manufactures body-related components. FY2028 CAPEX allocation sets aside $976.1M for Japanese operations. The domestic workforce totals 63,954 permanent and 16,989 temporary personnel.
* North America (HEV Hub): Regional production output reached $8,067.0M (+10.3%). US manufacturing sites span Indiana, Texas, North Carolina, Ohio, Kentucky, and Tennessee. Mexico acts as the primary USMCA nearshoring hub via Guanajuato and Jalisco. FY2028 CAPEX targets $401.1M in the region. The workforce consists of 15,626 permanent and 1,315 temporary employees.
* ASEAN & India: Maximum growth region with production output totaling $4,216.9M (+19.1%). Manufacturing is clustered in Thailand (Chonburi, Prachinburi), Indonesia (West Java), the Philippines (Laguna), and India (Haryana, Karnataka). Operations utilize 17,599 permanent and 3,929 temporary workers.
* China (Mainland Transit Hub): Production output contracted to $4,014.1M (-2.6%), generating a 5.3% year-over-year decline in operating profit. Footprint adheres strictly to the One-China standard, mapping facilities across Tangshan (Hebei), Ningbo (Zhejiang), Suzhou (Jiangsu), Tianjin, and Guangzhou (Guangdong). Strategic operations rely on joint ventures including GAC Aisin Automatic Transmission and Zhejiang Geely Aisin. The regional labor force holds 13,020 permanent and 975 temporary workers.
* Europe: European output contracted to $1,805.9M (-7.9%). Operations are anchored by a powertrain hub in South Bohemia, Czech Republic, and regional headquarters in Braine-l'Alleud, Belgium. Staffing includes 2,274 permanent and 184 temporary workers.
Joint ventures define the intelligence moat, specifically ADVICS—a technological alliance with Denso, Sumitomo Electric, and Toyota driving high-margin intelligent braking components. Human capital strategy features an average annual parent company salary of $51,962 (+5.4% YoY wage base-up). Reskilling programs recorded 2,235 participants in problem-solving modules, 127 in advanced MAST leadership, and 6,944 in management-level OMOIYARI communication training.
Emissions protocols dictate carbon neutrality by 2050. The FY2030 targets demand a 46.2% reduction in Scope 1 and Scope 2 emissions and a 27.5% reduction in Scope 3 (Categories 1 and 11) relative to a 2019 baseline. Current actuals verify a 20.5% cut in Scope 1 and 2 emissions down to 2.21M t-CO2e, alongside an 8.0% drop in Scope 3 emissions.
HDIN Institutional Verdict
A forensic analysis of Aisin Corporation’s FY2026 data exposes the profound friction of parallel legacy and next-generation capital mandates. The headline 12.7% consolidated operating profit expansion is mechanically inflated by a $39.19M reduction in warranty provisions stemming from a shift toward a comprehensive accrual model, masking the 5.4% wage inflation that dragged core operational margins. The 45.3% reduction in electronic notes payable strictly defines a liquidity transfer from Aisin to its upstream tier-2 suppliers, degrading the cash conversion cycle by 9.5 days to prevent supply-side insolvencies.
Governance mechanisms display aggressive top-tier alignment, capping executive compensation via a 25% fixed, 25% short-term bonus, and 50% long-term stock split saddled with a 30-year restriction period. Short-term bonus metrics explicitly tether 40% of payout to operating profit, 40% to ROIC, and 20% to sustainability targets. However, the post-June 2026 board realignment—reducing independent directors from 4 (50%) out of an 8-member board down to 3 (37.5%)—structurally consolidates Toyota's oversight. Female representation remains at 3 members out of the 12 total officers (25.0%). Ultimately, Aisin’s 69.7% revenue dependence on the Toyota Group secures volume but forces capital absorption of OEM strategic delays, as the $30.8M domestic intangible impairment explicitly quantifies the immediate financial destruction of sudden platform cancellations.
Presentation Download & Video Access:
- Presentation Download: Click the PDF download link under 'Related Topics' to access the full institutional presentation of this report.
- Video Link: Click this link to watch the HDIN analyst briefing on YouTube.
About HDIN Research:
HDIN Research is a premier global market intelligence and strategic advisory firm specializing in institutional-grade financial analysis, supply chain audits, and macroeconomic forecasting. Our dedicated sector analysts deliver actionable, data-driven insights tailored for private equity, hedge funds, and corporate strategy teams. Visit us at http://www.hdinresearch.com.
2026 AI Transparency Footer:
"This intelligence report was authored by HDIN Research analysts following a rigorous audit of official corporate filings. AI was utilized for massive-scale data synthesis and structural drafting, ensuring 100% inclusion of reported data points. All strategic insights, financial modeling, and final verdicts were verified by our editorial board to ensure professional accuracy and compliance with 2026 Google Search E-E-A-T standards."
* FY2026 consolidated revenue expanded 4.5% year-over-year to $34,216.8M, yielding an operating margin of 4.5% ($1,529.7M), trailing management’s 6.2% FY2028 margin target as the dual capital burden of legacy internal combustion engine (ICE) support and battery electric vehicle (BEV) R&D compresses immediate profitability.
* Deep integration with Toyota Motor Corporation guarantees scale, driving $23,855.0M (69.7% of total revenue) to the top line, but triggers systemic platform cancellation risks, evidenced by a $30.8M intangible asset impairment localized in Japan over aborted OEM vehicle development.
* Days Payable Outstanding (DPO) compressed from 78.2 to 71.4 days following a 45.3% reduction in electronic notes payable, signaling active downstream liquidity bailouts of tier-2 suppliers amidst severe raw material inflation.
Figure AISIN CORPORATlON: Strategic Diagnostic & The Pivot to SDV Mobility (FY2026)
Segmental Realities and Margin CompressionAisin Corporation operates under structural capital constraints, actively monetizing a global resurgence in Hybrid Electric Vehicle (HEV) and Plug-in Hybrid (PHEV) demand to fund its capital-intensive pivot toward Software-Defined Vehicle (SDV) components. In FY2026, the company deployed $1,775.1M in R&D (reported as $1,774.4M consolidated) alongside $1,493.3M (reported alternately as $1,493.2M) in capital expenditures. FY2028 financial targets dictate a total top-line of $35,435.3M, an operating profit of $2,206.3M (6.2% margin), a Return on Invested Capital (ROIC) of 11.0% (currently 9.1%), and a Return on Equity (ROE) of 10.0% (currently 8.2%). Management targets $1,805.2M in FY2028 CAPEX.
Total production value reached $39,902.1M (+4.6% YoY) across the fiscal year. Segmental performance demonstrates a deep divergence in regional profitability:
Table FY2026 Revenue and Operating Performance by Geographic Region
| Geographic Region | FY2026 Revenue | YoY Growth | Operating Income | Operating Margin |
|---|---|---|---|---|
| Japan | $21,493.4M | +2.4% | $536.6M | 2.5% |
| North America | $7,995.3M | +10.0% | $261.6M | 3.3% |
| ASEAN & India | $4,101.2M | +15.7% | $465.5M | 11.3% |
| China | $4,004.3M | -3.2% | $205.0M | 5.1% |
| Europe | $1,900.5M | -3.9% | $27.6M | 1.5% |
| Other / Corporate Adjustments | -$5,282.7M | N/A | $5.1M | N/A |
Top-line revenue generated by the core Automotive Parts Division reached $33,372.7M (97.5% of total revenue). Sales to the broader Toyota Group accounted for 69.7% of total revenue, with direct sales to Toyota Motor Corporation totaling $10,104.1M (29.5%). Non-captive OEM and other customer sales reached $9,517.6M. The Energy Solutions & Other division generated $844.2M (2.5%), anchored by gas heat pump air conditioners and next-generation incubation vectors like Bio-M-Coke and Perovskite solar cells.
Analysis of working capital reveals a 9.5-day deterioration in the Cash Conversion Cycle (CCC), shifting from 21.4 days in FY2025 to 30.9 days in FY2026.
* Days Sales Outstanding (DSO) lengthened slightly from 54.9 days to 55.2 days, with total receivables moving from $4,928.9M against FY2025 revenue of $32,734.8M to $5,173.5M against FY2026 revenue of $34,216.8M.
* Days Inventory Outstanding (DIO) expanded by 2.4 days (44.7 to 47.1 days) as inventory climbed from $3,544.1M to $3,879.6M against COGS of $28,967.4M (FY2025) and $30,078.7M (FY2026). A prior $21.8M inventory write-down reversed into a $35.7M liquidation gain driven by legacy HEV demand.
* Days Payable Outstanding (DPO) compressed from 78.2 to 71.4 days. Total payables declined from $6,208.5M to $5,880.5M. While standard accounts payable remained flat ($2,686.0M to $2,701.0M), notes payable and electronically recorded obligations plummeted 45.3% from $606.6M to $332.0M.
Financial exposure on the balance sheet is anchored by $676.44M in total quality defect vulnerabilities. Accrued expenses for realized market treatments total $521.59M. A separate product warranty provision holds $154.85M, part of a total $278.96M warranty provision. A structural accounting shift to a "comprehensive provision at the time of sale" model generated a $39.19M margin relief recorded in SG&A. Additionally, the company recognized a $101.8M total impairment loss. The China segment recognized $57.3M in fixed asset impairments tied to legacy Automatic Transmission (AT) depreciation. Intangible asset write-downs reached $30.9M globally, with $30.8M explicitly isolated in Japan due to OEM platform cancellations. Asset Retirement Obligations (ARO) are systematically capitalized within Property, Plant, and Equipment without a standalone material provision. Unrecognized capital commitments stand at $258.97M, backstopped by a completely undrawn $2,406.92M syndicated commitment line. Equity-method affiliates carry a book value of $565.06M, contributing $37.29M in net profit and $46.06M in comprehensive income, stabilizing after the prior fiscal year’s $108.43M loss on the divestiture of EXEDY Corporation.
Infrastructure Layout and Regional Moats
The company’s global footprint is heavily localized to proximity-serve regional automakers, mitigate export tariffs, and absorb supply chain shocks. The consolidated workforce numbers 113,292 permanent employees alongside an average of 23,417 temporary workers.
* Japan (Mother Plants & Advanced R&D): Total regional output hit $21,533.4M (+2.7%). Hubs in Anjo, Nishio, Tahara, and Okazaki control powertrain components, eAxles, and Energy Solutions. Handa handles Chassis, Braking systems, and Location-Based Services (LBS), while Shintoyo manufactures body-related components. FY2028 CAPEX allocation sets aside $976.1M for Japanese operations. The domestic workforce totals 63,954 permanent and 16,989 temporary personnel.
* North America (HEV Hub): Regional production output reached $8,067.0M (+10.3%). US manufacturing sites span Indiana, Texas, North Carolina, Ohio, Kentucky, and Tennessee. Mexico acts as the primary USMCA nearshoring hub via Guanajuato and Jalisco. FY2028 CAPEX targets $401.1M in the region. The workforce consists of 15,626 permanent and 1,315 temporary employees.
* ASEAN & India: Maximum growth region with production output totaling $4,216.9M (+19.1%). Manufacturing is clustered in Thailand (Chonburi, Prachinburi), Indonesia (West Java), the Philippines (Laguna), and India (Haryana, Karnataka). Operations utilize 17,599 permanent and 3,929 temporary workers.
* China (Mainland Transit Hub): Production output contracted to $4,014.1M (-2.6%), generating a 5.3% year-over-year decline in operating profit. Footprint adheres strictly to the One-China standard, mapping facilities across Tangshan (Hebei), Ningbo (Zhejiang), Suzhou (Jiangsu), Tianjin, and Guangzhou (Guangdong). Strategic operations rely on joint ventures including GAC Aisin Automatic Transmission and Zhejiang Geely Aisin. The regional labor force holds 13,020 permanent and 975 temporary workers.
* Europe: European output contracted to $1,805.9M (-7.9%). Operations are anchored by a powertrain hub in South Bohemia, Czech Republic, and regional headquarters in Braine-l'Alleud, Belgium. Staffing includes 2,274 permanent and 184 temporary workers.
Joint ventures define the intelligence moat, specifically ADVICS—a technological alliance with Denso, Sumitomo Electric, and Toyota driving high-margin intelligent braking components. Human capital strategy features an average annual parent company salary of $51,962 (+5.4% YoY wage base-up). Reskilling programs recorded 2,235 participants in problem-solving modules, 127 in advanced MAST leadership, and 6,944 in management-level OMOIYARI communication training.
Emissions protocols dictate carbon neutrality by 2050. The FY2030 targets demand a 46.2% reduction in Scope 1 and Scope 2 emissions and a 27.5% reduction in Scope 3 (Categories 1 and 11) relative to a 2019 baseline. Current actuals verify a 20.5% cut in Scope 1 and 2 emissions down to 2.21M t-CO2e, alongside an 8.0% drop in Scope 3 emissions.
HDIN Institutional Verdict
A forensic analysis of Aisin Corporation’s FY2026 data exposes the profound friction of parallel legacy and next-generation capital mandates. The headline 12.7% consolidated operating profit expansion is mechanically inflated by a $39.19M reduction in warranty provisions stemming from a shift toward a comprehensive accrual model, masking the 5.4% wage inflation that dragged core operational margins. The 45.3% reduction in electronic notes payable strictly defines a liquidity transfer from Aisin to its upstream tier-2 suppliers, degrading the cash conversion cycle by 9.5 days to prevent supply-side insolvencies.
Governance mechanisms display aggressive top-tier alignment, capping executive compensation via a 25% fixed, 25% short-term bonus, and 50% long-term stock split saddled with a 30-year restriction period. Short-term bonus metrics explicitly tether 40% of payout to operating profit, 40% to ROIC, and 20% to sustainability targets. However, the post-June 2026 board realignment—reducing independent directors from 4 (50%) out of an 8-member board down to 3 (37.5%)—structurally consolidates Toyota's oversight. Female representation remains at 3 members out of the 12 total officers (25.0%). Ultimately, Aisin’s 69.7% revenue dependence on the Toyota Group secures volume but forces capital absorption of OEM strategic delays, as the $30.8M domestic intangible impairment explicitly quantifies the immediate financial destruction of sudden platform cancellations.
Presentation Download & Video Access:
- Presentation Download: Click the PDF download link under 'Related Topics' to access the full institutional presentation of this report.
- Video Link: Click this link to watch the HDIN analyst briefing on YouTube.
About HDIN Research:
HDIN Research is a premier global market intelligence and strategic advisory firm specializing in institutional-grade financial analysis, supply chain audits, and macroeconomic forecasting. Our dedicated sector analysts deliver actionable, data-driven insights tailored for private equity, hedge funds, and corporate strategy teams. Visit us at http://www.hdinresearch.com.
2026 AI Transparency Footer:
"This intelligence report was authored by HDIN Research analysts following a rigorous audit of official corporate filings. AI was utilized for massive-scale data synthesis and structural drafting, ensuring 100% inclusion of reported data points. All strategic insights, financial modeling, and final verdicts were verified by our editorial board to ensure professional accuracy and compliance with 2026 Google Search E-E-A-T standards."