Jedat Inc.: 2026 Capex Realignment Near Tokyo as $7.20M Backlog Contraction Signals Domestic Flat Panel Display Weakness
Date : 2026-06-16
Reading : 136
HDIN Executive Takeaways
* Jedat Inc.'s FY2026 order backlog compressed 24.9% to $7.20 million, driven by a 65.6% collapse in 2-to-3-year commitments, reflecting structural domestic contraction and a $3.40 million Flat Panel Display (FPD) revenue baseline.
* Operating a fabless Minato-ku, Tokyo infrastructure with Osaka disaster recovery, the firm maintains a 20% revenue dependency on overseas suppliers like Primarius Technologies and Simplify Design Automation.
* Despite yielding 2.2x operating cash flow-to-net income, hoarding $24.36 million in zero-yield cash limits ROE to 4.78%, creating a severe capital efficiency drag amid zero M&A capital deployment.
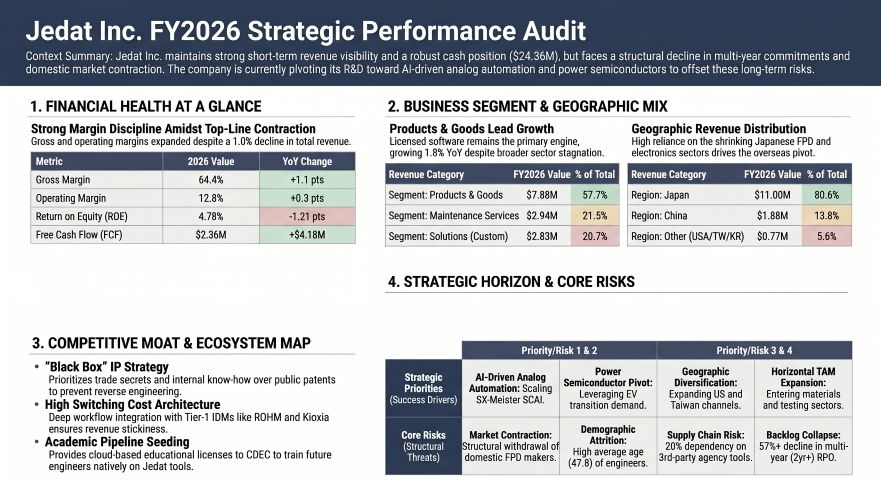
Figure Jedat Inc FY2026 Strategic Performance Audit
 Segmental Realities and Margin Compression
Jedat Inc. [TSE: 3841] converts 100% of reported FY2026 financials at a fixed 1 USD = 149.5686 JPY. Total revenue contracted 1.0% year-over-year to $13.65 million (2.04 billion JPY) from FY2025’s $13.79 million, down from a FY2024 peak of $13.78 million and up from FY2022's $13.19 million. Despite top-line pressure, gross profit reached $8.79 million, expanding gross margin by 110 basis points from 63.3% to 64.4%. Operating profit climbed 1.4% to $1.74 million (12.8% margin), surpassing management's $\ge$ 10% ordinary profit margin target by achieving 12.3% ($1.68 million / 251.25 million JPY). Conversely, net profit compressed 19.4% to $1.15 million (8.43% margin), down from $1.43 million in FY2025 and $2.20 million in FY2024. This bottom-line decay was strictly non-operational, driven by a $189,351 (rounded to $189,000 in macro disclosures, or 28.32 million JPY) operating loss from unlisted Investment Limited Partnerships, whose carrying value dropped from $883,347 (132.12 million JPY) to $756,870 (113.20 million JPY).
Total assets stand at $28.93 million against a zero-debt capital structure, relying on an equity ratio of 83.49% and an equity multiplier of 1.20x. Due to depressed asset turnover (0.47x), Return on Equity (ROE) degraded to 4.78%, down from 5.99% in FY2025 and 9.61% in FY2024.
Forward Visibility, Backlog & Duration
Total Order Intake fell 19.9% year-over-year to $11.27 million, driving total Order Backlog down 24.9% from $9.58 million to $7.20 million.
Table Revenue Mix, Order Intake, Backlog Position, and Remaining Performance Obligations (RPO)
* FPD Segment: Revenue contracted 2.1% to $3.40 million.
* Remaining Performance Obligations (RPO) Duration:
* 0–12 Months: $5.08 million (up from $5.04 million).
* 1–2 Years: $1.44 million (-57.1% from $3.36 million).
* 2–3 Years: $370,400 (-65.6% from $1.08 million).
* 5+ Years: $0 (down from $34,900).
Working Capital & Cash Flow Conversion
The firm displays negligible credit and inventory risk. Accounts Receivable (AR) dropped from $1.92 million to $1.74 million, while Electronic Record Receivables fell from $1.47 million to $0.86 million, achieving a 97.12% collection rate and an 11.4-day average collection cycle. Inventory and work-in-process balances represent a nominal $1.86 thousand. Contract liabilities (Advances Received) ended at $2.63 million (down 10.9% from $2.95 million), with $1.98 million recognized as revenue during the period.
Cash flow conversion remains highly efficient. Operating Cash Flow (OCF) measured $2.53 million, generating a 2.2x OCF-to-Net-Income conversion ratio. Free Cash Flow (FCF) recovered to $2.36 million, up from -$0.46 million in FY2024 and down from $5.19 million in FY2022. The firm declared a $0.27 (40 JPY) per share dividend, executing a total cash outflow of $1.03 million and forcing the payout ratio up to 89.46% (from 72.14%). Treasury stock remained stagnant at 60,472 shares.
Infrastructure Layout and Regional Moats
Geographic revenue dependency is severely tilted toward the domestic ecosystem: Japan accounts for $11.00 million (80.6%), China for $1.88 million (13.8%), and other regions (the United States, Taiwan, Province of China, and the Republic of Korea) account for $0.77 million (5.6%). The firm operates zero physical manufacturing plants, holding a heavily depreciated fixed asset base of $107,937. Software is depreciated on a 5-year straight-line schedule, while tangible assets utilize declining-balance, except for buildings post-1998/2016 which use straight-line. Asset Retirement Obligations (ARO) stand at a nominal $24,738 (3.70 million JPY).
Geographic & Cloud Architecture
Core R&D is centralized at the Minato-ku, Tokyo headquarters, with historical operations extending to a Kumamoto Design Center. To prevent catastrophic data loss, backup infrastructure is decentralized across Chuo-ku, Tokyo, and Osaka City, Osaka. The firm explicitly identifies Iran-related geopolitical instability and oil supply disruptions as macro threats to this domestic infrastructure. In April 2026, Jedat launched a cloud iteration of SX-Meister in partnership with Kimura Information Technology Co., Ltd., specifically targeting academic seeding at the Circuit Design and Education Center (CDEC) at Ariake National College of Technology.
Supply Chain Dependencies & Account Receivables
Jedat offsets proprietary R&D constraints by sourcing 20% of its sales from third-party "agency products" supplied by overseas venture firms, specifically Simplify Design Automation, Inc., Primarius Technologies Co., Ltd., and Avant Technology Inc. Domestic distribution relies heavily on a 2006 "HOTSCOPE" alliance with Dai Nippon Printing (DNP).
While zero individual customers account for $\ge$ 10% ($1.36 million) of total revenue, counterparty exposure is measurable via contract advances and receivables:
* Advances Received: ROHM Co., Ltd. ($884,000), Primarius Technologies Co., Ltd. ($622,900), Avant Technology Inc. ($195,500), and Kioxia Corporation ($148,775, rounded to $148,800 in macro schedules).
* Receivable Book: Sharp Corporation ($373,661 Electronic AR), ABLIC Inc. ($293,591 AR, $231,405 Electronic AR), Toshiba Information Systems Corporation ($133,851 AR), University of Tokyo ($111,788 AR), and HOYA Corporation ($74,454 Electronic AR).
HDIN Institutional Verdict
Jedat's capital allocation framework exhibits a stark expectation gap between purported strategic intent and actual deployment. Despite maintaining 84.2% of total assets as excess liquidity—holding $18.35 million in cash alongside long-term deposits of $6.01 million (adjusted rounding to $6.02 million) for a combined $24.36 million—zero capital was deployed for inorganic acquisitions in FY2026. This hyper-conservative cash hoarding mechanically suppresses Asset Turnover and ensures ROE remains locked below 5.00%, insulating the firm from bankruptcy at the direct expense of capital efficiency.
Operationally, the firm is successfully defending its analog micro-monopoly against US Electronic Design Automation (EDA) majors. The June 2025 release of SX-Meister PowerVolt (V19.0) achieved world-first CAD electrostatic discharge verification, followed by SX-Meister V20.0 (SCAI) in December 2025. However, this relies on a volatile human capital base. The 130-person workforce (119 dedicated to EDA) features extreme retention (12.0 years tenure) but an aging demographic (47.8 years average age) and non-competitive global compensation at $43,622 (6,524,583 JPY). R&D expenditure dropped 4.4% year-over-year to $2.32 million (347.20 million JPY) from $2.43 million (363.27 million JPY), maintaining a 17.0% intensity rate. Rather than patenting these algorithms, management explicitly prefers a trade-secret structure, leaving the firm open to contingent litigation risks from well-capitalized competitors.
Governance remains concentrated, with Argo Graphics Inc. (51.4%) and Seiko Instruments Inc. (21.2%) holding 72.6% of equity. The 9-person officer structure (6 directors with 2 outside; 3 auditors with 2 outside) operates on strict compensation caps: $303,539 (45.40 million JPY) for internal directors, $28,080 (4.20 million JPY) for the internal auditor, and $72,207 (10.80 million JPY) for outside officers. Diversity targets (15% female, 15% female management, 60% paid leave, 30% male childcare) are tracking against current actuals of 11.1% (1 female officer), 11% overall female, 10% female management, 64% paid leave, and 100% male childcare among 3 eligible employees. Finally, analysts must model the unapplied ASBJ Statement No. 34 (Accounting Standard for Leases). Scheduled for adoption in April 2028 (FY2029), this will unilaterally force off-balance-sheet operating leases onto the balance sheet, dismantling the firm’s current zero-debt visual structure and further compressing baseline ROA.
Presentation Download & Video Access:
- Presentation Download: Click the PDF download link under 'Related Topics' to access the full institutional presentation of this report.
- Video Link: Click this link to watch the HDIN analyst briefing on YouTube.
About HDIN Research:
HDIN Research is a premier global market intelligence and strategic advisory firm specializing in institutional-grade financial analysis, supply chain audits, and macroeconomic forecasting. Our dedicated sector analysts deliver actionable, data-driven insights tailored for private equity, hedge funds, and corporate strategy teams. Visit us at http://www.hdinresearch.com.
"This intelligence report was authored by HDIN Research analysts following a rigorous audit of official corporate filings. AI was utilized for massive-scale data synthesis and structural drafting, ensuring 100% inclusion of reported data points. All strategic insights, financial modeling, and final verdicts were verified by our editorial board to ensure professional accuracy and compliance with 2026 Google Search E-E-A-T standards."
* Jedat Inc.'s FY2026 order backlog compressed 24.9% to $7.20 million, driven by a 65.6% collapse in 2-to-3-year commitments, reflecting structural domestic contraction and a $3.40 million Flat Panel Display (FPD) revenue baseline.
* Operating a fabless Minato-ku, Tokyo infrastructure with Osaka disaster recovery, the firm maintains a 20% revenue dependency on overseas suppliers like Primarius Technologies and Simplify Design Automation.
* Despite yielding 2.2x operating cash flow-to-net income, hoarding $24.36 million in zero-yield cash limits ROE to 4.78%, creating a severe capital efficiency drag amid zero M&A capital deployment.
Figure Jedat Inc FY2026 Strategic Performance Audit
Segmental Realities and Margin CompressionJedat Inc. [TSE: 3841] converts 100% of reported FY2026 financials at a fixed 1 USD = 149.5686 JPY. Total revenue contracted 1.0% year-over-year to $13.65 million (2.04 billion JPY) from FY2025’s $13.79 million, down from a FY2024 peak of $13.78 million and up from FY2022's $13.19 million. Despite top-line pressure, gross profit reached $8.79 million, expanding gross margin by 110 basis points from 63.3% to 64.4%. Operating profit climbed 1.4% to $1.74 million (12.8% margin), surpassing management's $\ge$ 10% ordinary profit margin target by achieving 12.3% ($1.68 million / 251.25 million JPY). Conversely, net profit compressed 19.4% to $1.15 million (8.43% margin), down from $1.43 million in FY2025 and $2.20 million in FY2024. This bottom-line decay was strictly non-operational, driven by a $189,351 (rounded to $189,000 in macro disclosures, or 28.32 million JPY) operating loss from unlisted Investment Limited Partnerships, whose carrying value dropped from $883,347 (132.12 million JPY) to $756,870 (113.20 million JPY).
Total assets stand at $28.93 million against a zero-debt capital structure, relying on an equity ratio of 83.49% and an equity multiplier of 1.20x. Due to depressed asset turnover (0.47x), Return on Equity (ROE) degraded to 4.78%, down from 5.99% in FY2025 and 9.61% in FY2024.
Forward Visibility, Backlog & Duration
Total Order Intake fell 19.9% year-over-year to $11.27 million, driving total Order Backlog down 24.9% from $9.58 million to $7.20 million.
Table Revenue Mix, Order Intake, Backlog Position, and Remaining Performance Obligations (RPO)
| Business Category | Revenue | % of Total Revenue | YoY Revenue Growth | Order Intake | YoY Intake Growth | Backlog | YoY Backlog Growth |
|---|---|---|---|---|---|---|---|
| Products and Goods | $7.88M | 57.7% | +1.8% | $6.21M | -17.4% | $4.87M | -25.5% |
| Maintenance Services | $2.94M | 21.5% | +5.0% | $2.53M | -14.1% | $2.09M | -16.3% |
| Solutions | $2.83M | 20.7% | -13.0% | $2.53M | -29.8% | $240.7K | -56.0% |
* FPD Segment: Revenue contracted 2.1% to $3.40 million.
* Remaining Performance Obligations (RPO) Duration:
* 0–12 Months: $5.08 million (up from $5.04 million).
* 1–2 Years: $1.44 million (-57.1% from $3.36 million).
* 2–3 Years: $370,400 (-65.6% from $1.08 million).
* 5+ Years: $0 (down from $34,900).
Working Capital & Cash Flow Conversion
The firm displays negligible credit and inventory risk. Accounts Receivable (AR) dropped from $1.92 million to $1.74 million, while Electronic Record Receivables fell from $1.47 million to $0.86 million, achieving a 97.12% collection rate and an 11.4-day average collection cycle. Inventory and work-in-process balances represent a nominal $1.86 thousand. Contract liabilities (Advances Received) ended at $2.63 million (down 10.9% from $2.95 million), with $1.98 million recognized as revenue during the period.
Cash flow conversion remains highly efficient. Operating Cash Flow (OCF) measured $2.53 million, generating a 2.2x OCF-to-Net-Income conversion ratio. Free Cash Flow (FCF) recovered to $2.36 million, up from -$0.46 million in FY2024 and down from $5.19 million in FY2022. The firm declared a $0.27 (40 JPY) per share dividend, executing a total cash outflow of $1.03 million and forcing the payout ratio up to 89.46% (from 72.14%). Treasury stock remained stagnant at 60,472 shares.
Infrastructure Layout and Regional Moats
Geographic revenue dependency is severely tilted toward the domestic ecosystem: Japan accounts for $11.00 million (80.6%), China for $1.88 million (13.8%), and other regions (the United States, Taiwan, Province of China, and the Republic of Korea) account for $0.77 million (5.6%). The firm operates zero physical manufacturing plants, holding a heavily depreciated fixed asset base of $107,937. Software is depreciated on a 5-year straight-line schedule, while tangible assets utilize declining-balance, except for buildings post-1998/2016 which use straight-line. Asset Retirement Obligations (ARO) stand at a nominal $24,738 (3.70 million JPY).
Geographic & Cloud Architecture
Core R&D is centralized at the Minato-ku, Tokyo headquarters, with historical operations extending to a Kumamoto Design Center. To prevent catastrophic data loss, backup infrastructure is decentralized across Chuo-ku, Tokyo, and Osaka City, Osaka. The firm explicitly identifies Iran-related geopolitical instability and oil supply disruptions as macro threats to this domestic infrastructure. In April 2026, Jedat launched a cloud iteration of SX-Meister in partnership with Kimura Information Technology Co., Ltd., specifically targeting academic seeding at the Circuit Design and Education Center (CDEC) at Ariake National College of Technology.
Supply Chain Dependencies & Account Receivables
Jedat offsets proprietary R&D constraints by sourcing 20% of its sales from third-party "agency products" supplied by overseas venture firms, specifically Simplify Design Automation, Inc., Primarius Technologies Co., Ltd., and Avant Technology Inc. Domestic distribution relies heavily on a 2006 "HOTSCOPE" alliance with Dai Nippon Printing (DNP).
While zero individual customers account for $\ge$ 10% ($1.36 million) of total revenue, counterparty exposure is measurable via contract advances and receivables:
* Advances Received: ROHM Co., Ltd. ($884,000), Primarius Technologies Co., Ltd. ($622,900), Avant Technology Inc. ($195,500), and Kioxia Corporation ($148,775, rounded to $148,800 in macro schedules).
* Receivable Book: Sharp Corporation ($373,661 Electronic AR), ABLIC Inc. ($293,591 AR, $231,405 Electronic AR), Toshiba Information Systems Corporation ($133,851 AR), University of Tokyo ($111,788 AR), and HOYA Corporation ($74,454 Electronic AR).
HDIN Institutional Verdict
Jedat's capital allocation framework exhibits a stark expectation gap between purported strategic intent and actual deployment. Despite maintaining 84.2% of total assets as excess liquidity—holding $18.35 million in cash alongside long-term deposits of $6.01 million (adjusted rounding to $6.02 million) for a combined $24.36 million—zero capital was deployed for inorganic acquisitions in FY2026. This hyper-conservative cash hoarding mechanically suppresses Asset Turnover and ensures ROE remains locked below 5.00%, insulating the firm from bankruptcy at the direct expense of capital efficiency.
Operationally, the firm is successfully defending its analog micro-monopoly against US Electronic Design Automation (EDA) majors. The June 2025 release of SX-Meister PowerVolt (V19.0) achieved world-first CAD electrostatic discharge verification, followed by SX-Meister V20.0 (SCAI) in December 2025. However, this relies on a volatile human capital base. The 130-person workforce (119 dedicated to EDA) features extreme retention (12.0 years tenure) but an aging demographic (47.8 years average age) and non-competitive global compensation at $43,622 (6,524,583 JPY). R&D expenditure dropped 4.4% year-over-year to $2.32 million (347.20 million JPY) from $2.43 million (363.27 million JPY), maintaining a 17.0% intensity rate. Rather than patenting these algorithms, management explicitly prefers a trade-secret structure, leaving the firm open to contingent litigation risks from well-capitalized competitors.
Governance remains concentrated, with Argo Graphics Inc. (51.4%) and Seiko Instruments Inc. (21.2%) holding 72.6% of equity. The 9-person officer structure (6 directors with 2 outside; 3 auditors with 2 outside) operates on strict compensation caps: $303,539 (45.40 million JPY) for internal directors, $28,080 (4.20 million JPY) for the internal auditor, and $72,207 (10.80 million JPY) for outside officers. Diversity targets (15% female, 15% female management, 60% paid leave, 30% male childcare) are tracking against current actuals of 11.1% (1 female officer), 11% overall female, 10% female management, 64% paid leave, and 100% male childcare among 3 eligible employees. Finally, analysts must model the unapplied ASBJ Statement No. 34 (Accounting Standard for Leases). Scheduled for adoption in April 2028 (FY2029), this will unilaterally force off-balance-sheet operating leases onto the balance sheet, dismantling the firm’s current zero-debt visual structure and further compressing baseline ROA.
Presentation Download & Video Access:
- Presentation Download: Click the PDF download link under 'Related Topics' to access the full institutional presentation of this report.
- Video Link: Click this link to watch the HDIN analyst briefing on YouTube.
About HDIN Research:
HDIN Research is a premier global market intelligence and strategic advisory firm specializing in institutional-grade financial analysis, supply chain audits, and macroeconomic forecasting. Our dedicated sector analysts deliver actionable, data-driven insights tailored for private equity, hedge funds, and corporate strategy teams. Visit us at http://www.hdinresearch.com.
"This intelligence report was authored by HDIN Research analysts following a rigorous audit of official corporate filings. AI was utilized for massive-scale data synthesis and structural drafting, ensuring 100% inclusion of reported data points. All strategic insights, financial modeling, and final verdicts were verified by our editorial board to ensure professional accuracy and compliance with 2026 Google Search E-E-A-T standards."