MARUWA CO., LTD.: $150.60M CapEx Realignment Near Seto Plant as 59.9% Raw Material Surge Signals 2026 AI Infrastructure Ramp
Date : 2026-06-16
Reading : 80
HDIN Executive Takeaways
* Operating margins compressed 400 basis points to 33.5% on $497.94M in total revenue as aggressive $150.60M CapEx outlays and elevated SG&A outpaced immediate top-line growth.
* Supply chain architecture pivots upstream with a 59.9% raw material stockpile surge across Aichi and Melaka, mitigating downstream semiconductor market delays and acting as a physical hedge against external supply shocks.
* A fortress balance sheet featuring a 90.5% equity ratio insulates the firm's short-term operating cash flow contraction (-33.2%), guaranteeing self-funded materials science dominance in next-generation high-thermal substrates.
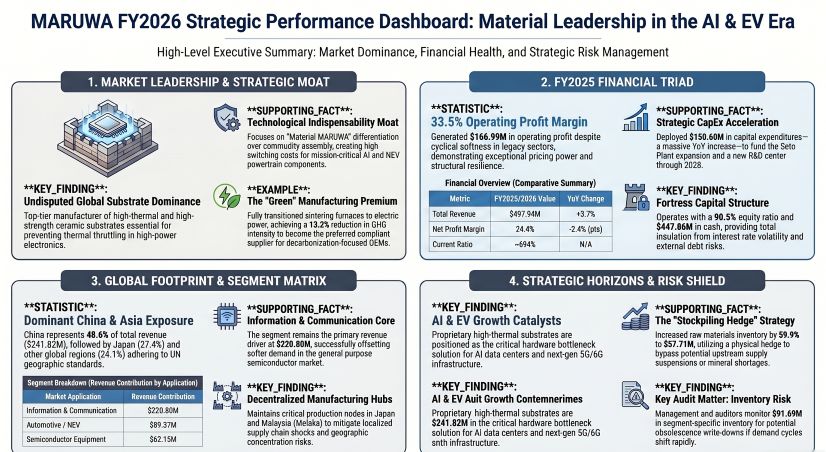
Figure MARUWA FY2026 Strategic Performance Dashboard: Material Leadership in the Al & EV Era
 Segmental Realities and Margin Compression
MARUWA CO., LTD. [TSE: 5344] reported an income statement characterized by structural divergence between top-line expansion and bottom-line contraction. The firm traded immediate margin capture for forward-looking infrastructure and R&D capacity, missing internal management targets of a 35.0% operating margin due to aggressive resource deployment into high-growth secular markets. Cost of Goods Sold (COGS) advanced by 9.1% year-over-year to $236.13M, fundamentally outpacing the 3.7% revenue growth. Concurrently, SG&A expenses expanded by 12.9% to $94.82M, directly driving operating margin degradation.
Consolidated P&L and Margin Analysis
* Total Revenue: $497.94M (+3.7% YoY from $480.38M)
* Gross Profit: $261.81M
* Gross Margin: 52.6% (Contracted 230 bps from 54.9%)
* Operating Profit (OP): $166.99M (-7.2% YoY)
* Operating Margin: 33.5% (Contracted 400 bps from 37.5%)
* Net Profit: $121.44M (-5.6% YoY)
* Net Margin: 24.4% (Contracted 240 bps from 26.8%)
* Return on Equity (ROE): 13.2% (Diluted from 16.2%)
* Return on Assets (ROA): 11.2% (Diluted from 13.5%)
The top-line revenue decomposition highlights extreme dependency on information and communication verticals. Sector cyclicality in general-purpose memory semiconductors and automotive segments restricted volume growth, offset purely by advanced 5G hardware demand.
Revenue by End-Market Application
* Information & Communication: $220.80M
* Automotive: $89.37M
* Lighting: $71.40M
* Semiconductor: $62.15M
* Industrial Equipment: $54.21M
Table Segmental Operations, Orders, and Backlog
Capital Allocation and Shareholder Returns
MARUWA CO., LTD. authorized 31 consecutive terms of progressive dividends and 14 consecutive terms of dividend increases, raising the annual dividend by 8 JPY to 102 JPY per share. Management guidance projects an increased dividend of $0.74 (110 JPY) for the fiscal year ending March 2027. Special accounting items remained immaterial, with a $0.25M loss on the retirement/sale of non-current assets and a $0.28M book-value reduction entry tied to government subsidies. The deferred tax assets schedule indicates a stagnant historical impairment baseline of $0.42M, with zero new impairment losses.
Infrastructure Layout and Regional Moats
MARUWA CO., LTD. utilizes a decentralized global footprint to circumvent geographic concentration risks while securing physical proximity to Asian telecommunications hubs. The physical expansion of its manufacturing capacity acts as a preemptive structural barrier to entry against peer tech manufacturers. In the reporting period, total Cash Flow from Investing (CFI) outflows tripled year-over-year from -$51.36M to -$145.47M, driven primarily by a $150.60M (22,525 million JPY) Capital Expenditure program.
CapEx Deployment and Timelines
* Seto Plant Capacity Expansion (Aichi, Japan): $16.71M (2,500 million JPY) allocated, with $12.19M (1,823 million JPY) currently deployed. Scheduled completion by April 2027.
* New R&D Center (Owariasahi, Aichi, Japan): $16.71M (2,500 million JPY) allocated, with $0.49M (73 million JPY) deployed. Construction commencing in March 2027, targeted for completion by October 2028.
* R&D Operations (OPEX): $14.07M (2,104 million JPY) deployed, representing a 25.8% YoY increase. R&D intensity scaled to 2.83% of revenue (from 2.33%).
Global Facility Operations
* Japan Manufacturing: Toki Plant (Gifu); Seto Plant & Yamanota Plant (Seto, Aichi); Naoetsu Plant & Kasugayama Plant (Joetsu, Niigata); Iwaki Plant & Miharu Plant (Fukushima).
* Overseas Manufacturing Base: Maruwa (Malaysia) Sdn. Bhd. (Melaka, Malaysia).
* Wholly-Owned Direct Sales Network: MARUWA Electronics (Taiwan, China) Co., Ltd.; Maruwa (Shanghai) Trading Co., Ltd. (China); Maruwa Korea Co., Ltd.; MARUWA Electronic (India) Pvt. Ltd.; plus entities across the USA, UK, Germany, and Israel.
Customer and Geographic Revenue Concentrations
* China: $241.82M (48.6% of total revenue).
* Japan: $136.27M (27.4% of total revenue).
* Other Regions: $119.85M (24.1% of total revenue).
* Major Single Client Exposure: HAINAN THING LOT TECHNOLOGY CO.,LTD accounted for $56.29M (8,419 million JPY), representing exactly 11.3% of total consolidated revenue.
ESG Infrastructure and Governance Metrics
The corporate governance apparatus is overseen by a seven-member board (four internal directors, three external independent directors representing 42.9% independence). Environmental manufacturing overhauls achieved a complete transition to 100% electric sintering furnaces. Scope 1 and 2 GHG emissions measured 32,536 tCO2, yielding an emission intensity of 0.59 tCO2 per million JPY (a 13.2% reduction vs. the FY2023 baseline). Proprietary renewable solar power generation reached 1,733,434 kWh, representing a 2.13x YoY increase, tracking toward a 3x expansion target and full carbon neutrality by 2050. Human capital targets mandate a 100% paid leave acquisition rate and a 100% male childcare leave acquisition rate by FY2030.
HDIN Institutional Verdict
The MARUWA CO., LTD. balance sheet is a purely un-levered, zero-goodwill fortress, intentionally absorbing short-term margin compression to finalize long-term inventory stockpiling. Total consolidated assets swelled by 14.3% YoY to $1,087.73M. The firm operates with $689.82M in Current Assets against just $99.33M in Current Liabilities (a 694% Current Ratio) and zero product warranty provisions or active litigation liabilities. Cash and cash equivalents stand at $447.86M, representing 41.1% of the total asset base, sustaining an ultra-conservative 90.5% Equity Ratio (up from 89.9%).
Cash Flow from Operations (CFO) dropped 33.2% YoY from $169.50M to $113.21M. This contraction is a mechanical byproduct of the firm converting liquid cash into hard working capital. Total inventory surged by 37.5% YoY to $108.94M.
Inventory Sub-Classifications and Cash Impact
* Raw Materials & Supplies: Expanded 59.9% YoY from $36.09M (5,398 million JPY) to $57.71M (8,631 million JPY).
* Work-In-Progress (WIP): Expanded 40.8% YoY from $25.43M (3,803 million JPY) to $35.80M (5,354 million JPY).
* Finished Goods: Contracted 12.7% YoY from $17.68M (2,645 million JPY) to $15.44M (2,309 million JPY).
* Cash Drag Elements: The inventory expansion absorbed $28.46M in operating cash, combined with a $6.97M drag from increased trade receivables.
The independent auditors designated the $91.69M (13,714 million JPY) inventory stack residing within the Ceramic Components segment (representing 8.4% of total assets) as a Key Audit Matter due to product lifecycle obsolescence risks. However, the forensic reality of the WIP and raw material accumulation—specifically the 59.9% surge in raw inputs alongside a 12.7% drawdown in finished goods—indicates preemptive hoarding of vital ceramic materials rather than involuntary finished-product stagnation. MARUWA CO., LTD. is leveraging its $447.86M cash pile to execute a physical, self-funded hedge against geopolitical raw material shortages, functionally securing the upstream inputs necessary to dominate the impending AI data center and 5G hardware scale-up cycle.
Presentation Download & Video Access:
Presentation Download: Click the PDF download link under 'Related Topics' to access the full institutional presentation of this report.
Video Link: Click this link to watch the HDIN analyst briefing on YouTube.
About HDIN Research:
HDIN Research is a premier global market intelligence and strategic advisory firm specializing in institutional-grade financial analysis, supply chain audits, and macroeconomic forecasting. Our dedicated sector analysts deliver actionable, data-driven insights tailored for private equity, hedge funds, and corporate strategy teams. Visit us at http://www.hdinresearch.com.
2026 AI Transparency Footer:
"This intelligence report was authored by HDIN Research analysts following a rigorous audit of official corporate filings. AI was utilized for massive-scale data synthesis and structural drafting, ensuring 100% inclusion of reported data points. All strategic insights, financial modeling, and final verdicts were verified by our editorial board to ensure professional accuracy and compliance with 2026 Google Search E-E-A-T standards."
* Operating margins compressed 400 basis points to 33.5% on $497.94M in total revenue as aggressive $150.60M CapEx outlays and elevated SG&A outpaced immediate top-line growth.
* Supply chain architecture pivots upstream with a 59.9% raw material stockpile surge across Aichi and Melaka, mitigating downstream semiconductor market delays and acting as a physical hedge against external supply shocks.
* A fortress balance sheet featuring a 90.5% equity ratio insulates the firm's short-term operating cash flow contraction (-33.2%), guaranteeing self-funded materials science dominance in next-generation high-thermal substrates.
Figure MARUWA FY2026 Strategic Performance Dashboard: Material Leadership in the Al & EV Era
Segmental Realities and Margin CompressionMARUWA CO., LTD. [TSE: 5344] reported an income statement characterized by structural divergence between top-line expansion and bottom-line contraction. The firm traded immediate margin capture for forward-looking infrastructure and R&D capacity, missing internal management targets of a 35.0% operating margin due to aggressive resource deployment into high-growth secular markets. Cost of Goods Sold (COGS) advanced by 9.1% year-over-year to $236.13M, fundamentally outpacing the 3.7% revenue growth. Concurrently, SG&A expenses expanded by 12.9% to $94.82M, directly driving operating margin degradation.
Consolidated P&L and Margin Analysis
* Total Revenue: $497.94M (+3.7% YoY from $480.38M)
* Gross Profit: $261.81M
* Gross Margin: 52.6% (Contracted 230 bps from 54.9%)
* Operating Profit (OP): $166.99M (-7.2% YoY)
* Operating Margin: 33.5% (Contracted 400 bps from 37.5%)
* Net Profit: $121.44M (-5.6% YoY)
* Net Margin: 24.4% (Contracted 240 bps from 26.8%)
* Return on Equity (ROE): 13.2% (Diluted from 16.2%)
* Return on Assets (ROA): 11.2% (Diluted from 13.5%)
The top-line revenue decomposition highlights extreme dependency on information and communication verticals. Sector cyclicality in general-purpose memory semiconductors and automotive segments restricted volume growth, offset purely by advanced 5G hardware demand.
Revenue by End-Market Application
* Information & Communication: $220.80M
* Automotive: $89.37M
* Lighting: $71.40M
* Semiconductor: $62.15M
* Industrial Equipment: $54.21M
Table Segmental Operations, Orders, and Backlog
| Metric | Ceramic Components | Lighting Equipment |
|---|---|---|
| Revenue | $426.54M | $71.40M |
| % of Total Revenue | 85.7% | 14.3% |
| YoY Revenue Growth | +2.1% | +14.1% |
| Segment Profit | $164.29M | $14.31M |
| YoY Profit Growth | -9.3% | +49.0% |
| Production Volume | $417.43M | $18.73M |
| YoY Production Growth | 99.7% | 101.2% |
| Order Intake | $468.33M | $70.74M |
| YoY Intake Growth | 117.9% | 110.4% |
| Backlog | $182.21M | $11.49M |
| YoY Backlog Growth | 129.8% | 94.6% |
MARUWA CO., LTD. authorized 31 consecutive terms of progressive dividends and 14 consecutive terms of dividend increases, raising the annual dividend by 8 JPY to 102 JPY per share. Management guidance projects an increased dividend of $0.74 (110 JPY) for the fiscal year ending March 2027. Special accounting items remained immaterial, with a $0.25M loss on the retirement/sale of non-current assets and a $0.28M book-value reduction entry tied to government subsidies. The deferred tax assets schedule indicates a stagnant historical impairment baseline of $0.42M, with zero new impairment losses.
Infrastructure Layout and Regional Moats
MARUWA CO., LTD. utilizes a decentralized global footprint to circumvent geographic concentration risks while securing physical proximity to Asian telecommunications hubs. The physical expansion of its manufacturing capacity acts as a preemptive structural barrier to entry against peer tech manufacturers. In the reporting period, total Cash Flow from Investing (CFI) outflows tripled year-over-year from -$51.36M to -$145.47M, driven primarily by a $150.60M (22,525 million JPY) Capital Expenditure program.
CapEx Deployment and Timelines
* Seto Plant Capacity Expansion (Aichi, Japan): $16.71M (2,500 million JPY) allocated, with $12.19M (1,823 million JPY) currently deployed. Scheduled completion by April 2027.
* New R&D Center (Owariasahi, Aichi, Japan): $16.71M (2,500 million JPY) allocated, with $0.49M (73 million JPY) deployed. Construction commencing in March 2027, targeted for completion by October 2028.
* R&D Operations (OPEX): $14.07M (2,104 million JPY) deployed, representing a 25.8% YoY increase. R&D intensity scaled to 2.83% of revenue (from 2.33%).
Global Facility Operations
* Japan Manufacturing: Toki Plant (Gifu); Seto Plant & Yamanota Plant (Seto, Aichi); Naoetsu Plant & Kasugayama Plant (Joetsu, Niigata); Iwaki Plant & Miharu Plant (Fukushima).
* Overseas Manufacturing Base: Maruwa (Malaysia) Sdn. Bhd. (Melaka, Malaysia).
* Wholly-Owned Direct Sales Network: MARUWA Electronics (Taiwan, China) Co., Ltd.; Maruwa (Shanghai) Trading Co., Ltd. (China); Maruwa Korea Co., Ltd.; MARUWA Electronic (India) Pvt. Ltd.; plus entities across the USA, UK, Germany, and Israel.
Customer and Geographic Revenue Concentrations
* China: $241.82M (48.6% of total revenue).
* Japan: $136.27M (27.4% of total revenue).
* Other Regions: $119.85M (24.1% of total revenue).
* Major Single Client Exposure: HAINAN THING LOT TECHNOLOGY CO.,LTD accounted for $56.29M (8,419 million JPY), representing exactly 11.3% of total consolidated revenue.
ESG Infrastructure and Governance Metrics
The corporate governance apparatus is overseen by a seven-member board (four internal directors, three external independent directors representing 42.9% independence). Environmental manufacturing overhauls achieved a complete transition to 100% electric sintering furnaces. Scope 1 and 2 GHG emissions measured 32,536 tCO2, yielding an emission intensity of 0.59 tCO2 per million JPY (a 13.2% reduction vs. the FY2023 baseline). Proprietary renewable solar power generation reached 1,733,434 kWh, representing a 2.13x YoY increase, tracking toward a 3x expansion target and full carbon neutrality by 2050. Human capital targets mandate a 100% paid leave acquisition rate and a 100% male childcare leave acquisition rate by FY2030.
HDIN Institutional Verdict
The MARUWA CO., LTD. balance sheet is a purely un-levered, zero-goodwill fortress, intentionally absorbing short-term margin compression to finalize long-term inventory stockpiling. Total consolidated assets swelled by 14.3% YoY to $1,087.73M. The firm operates with $689.82M in Current Assets against just $99.33M in Current Liabilities (a 694% Current Ratio) and zero product warranty provisions or active litigation liabilities. Cash and cash equivalents stand at $447.86M, representing 41.1% of the total asset base, sustaining an ultra-conservative 90.5% Equity Ratio (up from 89.9%).
Cash Flow from Operations (CFO) dropped 33.2% YoY from $169.50M to $113.21M. This contraction is a mechanical byproduct of the firm converting liquid cash into hard working capital. Total inventory surged by 37.5% YoY to $108.94M.
Inventory Sub-Classifications and Cash Impact
* Raw Materials & Supplies: Expanded 59.9% YoY from $36.09M (5,398 million JPY) to $57.71M (8,631 million JPY).
* Work-In-Progress (WIP): Expanded 40.8% YoY from $25.43M (3,803 million JPY) to $35.80M (5,354 million JPY).
* Finished Goods: Contracted 12.7% YoY from $17.68M (2,645 million JPY) to $15.44M (2,309 million JPY).
* Cash Drag Elements: The inventory expansion absorbed $28.46M in operating cash, combined with a $6.97M drag from increased trade receivables.
The independent auditors designated the $91.69M (13,714 million JPY) inventory stack residing within the Ceramic Components segment (representing 8.4% of total assets) as a Key Audit Matter due to product lifecycle obsolescence risks. However, the forensic reality of the WIP and raw material accumulation—specifically the 59.9% surge in raw inputs alongside a 12.7% drawdown in finished goods—indicates preemptive hoarding of vital ceramic materials rather than involuntary finished-product stagnation. MARUWA CO., LTD. is leveraging its $447.86M cash pile to execute a physical, self-funded hedge against geopolitical raw material shortages, functionally securing the upstream inputs necessary to dominate the impending AI data center and 5G hardware scale-up cycle.
Presentation Download & Video Access:
Presentation Download: Click the PDF download link under 'Related Topics' to access the full institutional presentation of this report.
Video Link: Click this link to watch the HDIN analyst briefing on YouTube.
About HDIN Research:
HDIN Research is a premier global market intelligence and strategic advisory firm specializing in institutional-grade financial analysis, supply chain audits, and macroeconomic forecasting. Our dedicated sector analysts deliver actionable, data-driven insights tailored for private equity, hedge funds, and corporate strategy teams. Visit us at http://www.hdinresearch.com.
2026 AI Transparency Footer:
"This intelligence report was authored by HDIN Research analysts following a rigorous audit of official corporate filings. AI was utilized for massive-scale data synthesis and structural drafting, ensuring 100% inclusion of reported data points. All strategic insights, financial modeling, and final verdicts were verified by our editorial board to ensure professional accuracy and compliance with 2026 Google Search E-E-A-T standards."