Vimian Group: Dentistry Pivot Near California Manufacturing Hub as $480.5M Consolidated Revenue Signals 60-Basis-Point Margin Contraction
Date : 2026-06-17
Reading : 107
HDIN Executive Takeaways
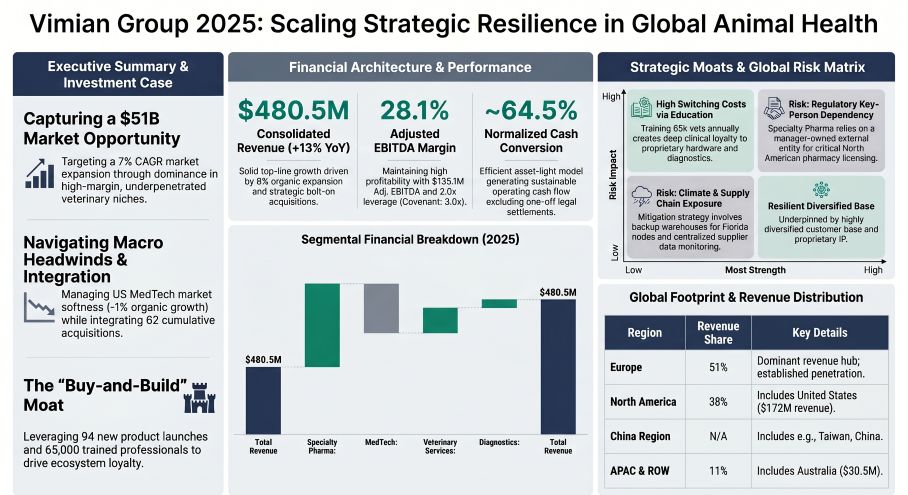
* Vimian Group [STO: VIMIAN] reported 2025 revenue of $480.5 million (EUR 425.0 million), reflecting a bifurcated 6% organic growth rate driven by high-margin Specialty Pharma offsetting a -1% contraction in US orthopedic surgery.
* Operations remain decentralized across 52 global offices; California and Florida anchor the MedTech supply chain, utilizing secondary US warehouses to mitigate documented climate exposure.
* A $104.2 million net M&A cash outflow drove inorganic scale, yet robust $352.6 million absolute liquidity and 2.0x leverage validate an aggressive non-dilutive 2030 consolidation mandate.
Figure Vimian Group 2025: Scaling Strategic Resilience in Global Animal Health
 Segmental Realities and Financial Architecture
The global animal health Total Addressable Market (TAM) is projected to reach $50.88 billion (EUR 45 billion) by 2030, scaling from $31.66 billion (EUR 28 billion) in 2023 at a 7% CAGR. In 2025, Vimian Group expanded consolidated revenue by 13% to $480.5 million (EUR 425.0 million), though the organic growth rate decelerated to 6% from 9% in 2024. Operating leverage metrics present a mixed profile: Adjusted EBITDA held at $135.1 million (EUR 119.5 million) with a 28.1% margin, while Adjusted EBITA reached $119.1 million (EUR 105.3 million), marking a 60-basis-point margin compression to 24.8% from 25.4%.
Statutory Operating Cash Flow (OCF) was reported at $119.5 million (EUR 105.7 million), explicitly inflated by a one-off $32.4 million (EUR 28.7 million) settlement receipt. Normalized OCF stands at $87.1 million, reflecting a highly sustainable 64.5% conversion rate. This cash injection resulted from a Veterinary Orthopedic Implants (VOI) indemnification dispute where the Delaware Superior Court awarded Vimian $40.2 million in damages plus $8.6 million in pre-judgment interest. Former sellers paid $31.9 million, leaving an uncollected $6.2 million receivable classified conservatively as doubtful pending a Supreme Court of Delaware appeal. The firm received an additional $0.90 million (EUR 0.8 million) in separate legacy VOI settlement payments.
Items affecting comparability totaled $16.6 million (EUR 14.7 million), absorbing $4.6 million (EUR 4.1 million) in M&A transaction costs, $2.5 million (EUR 2.2 million) in restructuring charges, and $7.7 million (EUR 6.8 million) in net VOI litigation fees, with exactly $6.90 million (EUR 6.1 million) in legal fees netted against received payments.
Table Segment Performance, Growth & Operational Mix Matrix
Infrastructure Layout and Geographic Moats
Vimian operates across 80 global markets with 1,300 employees distributed among 52 offices, generating 51% of consolidated revenue in Europe, 38% in North America, and 11% in the Rest of World (ROW)/APAC region. Country-specific revenue concentrations are anchored by the United States at $172.0 million (EUR 152.1 million), the United Kingdom at $60.5 million (EUR 53.5 million), and Australia at $30.5 million (EUR 27.0 million). The company asserts a highly fragmented client base, with zero customers exceeding a 10% consolidated revenue threshold.
Physical manufacturing and supply chain operations remain strictly decentralized. The Group headquarters are based in Stockholm. Diagnostics production is housed in Germany and the Netherlands, while Specialty Pharma operates an Italian facility upgraded with solar panel installations to fulfill environmental compliance targets. Within MedTech, the newly acquired AllAccem Inc. manages a dedicated California, USA facility producing proprietary SANOS® veterinary dental sealants. To neutralize extreme climate threats, specifically hurricanes affecting the primary VOI warehouse in Florida, Vimian maintains strategic inventory buffers at a backup facility in a secondary US state. Movora China commands the APAC operational hub from Beijing.
Internal R&D functions commercialized 94 new products in 2025, supported by a portfolio of 300 products engineered to combat antimicrobial resistance (AMR). Specialty Pharma controls 40 patent families and launched 75 products; this catalyzed cross-selling that delivered one-third of the segment's 8% organic growth and pushed direct European online channel expansion over 30%. Critical pipeline rollouts featured the PAX allergy test (co-developed with MacroArray Diagnostics, adding >20 new canine allergens), Peptivet 4, and an unregistered Feline Chronic Gingivostomatitis oral paste. The Diagnostics unit launched 12 products, deploying the AI-driven Ovacyte platform and engineering a rapid 5-month turnaround Bluetongue Disease PCR assay for European cattle.
Veterinary education functions as the core go-to-market engine. The firm trained 65,000 veterinary professionals globally, integrating 200 in-person dental trainings alongside advanced surgical instruction at proprietary orthopedic centers in Boston, USA, and Zurich, Switzerland. The VetFamily platform aggressively expanded, onboarding 2,500 new member clinics to reach 10,900 globally, simultaneously launching the dvmGRO US procurement platform. The B2B2C VetPlan subscription model currently covers over 84,000 enrolled pets.
Geographic segmentation data isolates APAC operations as generating 17% of total MedTech sales, while global dental operations drove 16% of MedTech sales. North America constitutes 41% of regional dental revenues. Veterinary Services derives 78% of its revenue from Europe and 17% from North America. ESG corporate standards mandate an Employee Net Promoter Score (eNPS) of 50—controlling 20% to 30% of executive variable remuneration—and a targeted 42% reduction in Scope 1 and 2 emissions against a 2022 baseline. Centralized supply chain governance successfully enforced a 92% audit completion rate among material suppliers.
Capital Allocation, Balance Sheet Realities, and Institutional Verdict
Vimian’s capital deployment remains aggressively skewed toward inorganic consolidation, approving $17.1 million (EUR 15.1 million) in organic CapEx (3.5% of revenue) versus a net M&A cash outflow of $104.2 million (EUR 92.2 million). This finalized 5 business acquisitions in 2025, elevating the lifetime deal count to 62 acquisitions since 2015. Transactions targeting the dental sub-niche (Dental Focus LLC, AllAccem Inc, Blossom Vets BV, David AI) carried a combined purchase consideration of $73.71 million (EUR 65.2 million). Deal structuring utilized zero equity issuance, relying entirely on $64.00 million (EUR 56.6 million) in cash [86.8%] and $9.72 million (EUR 8.6 million) in earn-outs [13.2%]. These acquisitions bolted on $53.1 million (EUR 47 million) in consolidated revenues, building upon 2024’s iM3 acquisition and preempting the March 2026 I-Vet consolidation.
The standalone $65.12 million (EUR 57.6 million) AllAccem acquisition was executed via $58.23 million in cash and a $6.90 million earn-out, generating $43.53 million in intangibles and $31.43 million in goodwill. Group-wide 2025 Purchase Price Allocation (PPA) recognized $48.62 million (EUR 43.0 million) in intangibles, $35.05 million (EUR 31.0 million) in goodwill, $38.67 million (EUR 34.2 million) in net assets, and -$13.45 million (EUR -11.9 million) in Deferred Tax Liabilities (DTL).
The balance sheet is heavily weighted by $667.17 million (EUR 590.1 million) in aggregate goodwill. Value-in-Use (VIU) testing utilizes a 4-year forecast anchored by a 2.0% terminal rate.
* Specialty Pharma: $321.99 million (EUR 284.8 million) [48% allocation], WACC 11.9%, assumed EBITDA 32-34%.
* MedTech: $214.25 million (EUR 189.5 million) [32% allocation], WACC 13.7%, assumed EBITDA 29-31%.
* Veterinary Services: $111.25 million (EUR 98.4 million), WACC 10.9%, assumed EBITDA 31-35%.
* Diagnostics: $19.67 million (EUR 17.4 million) [3% allocation], WACC 11.8%, assumed EBITDA 12-20%.
Internal modeling withstood stress tests of a 1.0 percentage point terminal growth drop, a 1.5 percentage point WACC surge, or a 1.0 percentage point EBITDA contraction without breaching carrying values. Capitalized R&D tightened to $6.78 million (EUR 6.0 million) from $8.93 million (EUR 7.9 million) in 2024. Amortization schedules apply 5-16 years for patents, 7-15 years for brands, and 5-10 years for internally generated assets.
Off-balance sheet Level 3 liabilities feature $52.57 million (EUR 46.5 million) in contingent considerations tied to 27 agreements, capped at a maximum payable limit of $127.98 million (EUR 113.2 million) over 1-5 years. A modeled 10% target overperformance yields an additional $9.16 million (EUR 8.1 million) liability. Remeasurement of these obligations generated a $5.1 million (EUR 4.5 million) finance expense.
The 29% effective corporate tax rate heavily penalizes the 20.6% Swedish statutory rate. Total DTL sits at $40.14 million (EUR 35.5 million), directly driven by $39.12 million (EUR 34.6 million) in amortization mismatches. Deferred Tax Assets (DTA) of $5.88 million (EUR 5.2 million) are verified by $4.41 million (EUR 3.9 million) in loss carry-forwards. Lease commitments stand at $17.41 million (EUR 15.4 million) matched against $16.73 million (EUR 14.8 million) in Right-of-Use assets. The maturity distribution isolates <12-month obligations at $5.43 million (EUR 4.8 million), 1-3 years at $8.48 million (EUR 7.5 million), and 3-5 years at $3.50 million (EUR 3.1 million). Swiss defined benefit pensions (Kyon AG/Ossium AG) managed via Profond carry a $0.23 million (EUR 0.2 million) obligation fully immunized by $0.23 million (EUR 0.2 million) in assets (net zero). Actuarial sensitivity confirms a +/- 0.25% shift on the 1.20% discount rate yields a $0.0 million impact. Warranty provisions are fixed at $0.0 million, other provisions equal $1.81 million (EUR 1.6 million), and off-balance sheet guarantees total $1.36 million (EUR 1.2 million).
Liquidity metrics firmly defend the M&A pipeline. Net debt reached $277.4 million (EUR 245.4 million), securing a 2.0x Net Debt/Adjusted LTM EBITDA leverage ratio against a rigid 3.0x covenant ceiling. Immediate liquidity equals $352.64 million (EUR 311.9 million), holding $62.2 million (EUR 55.0 million) in cash reserves alongside $290.4 million (EUR 256.9 million) in unutilized revolving facilities. May 2025 debt restructuring locked a $373.1 million (EUR 330 million) syndicated loan maturing in 2030 and a $169.59 million (EUR 150 million) Nordic bond due in 2028. Total committed facilities equal $542.69 million (EUR 480.0 million) with an additional $113.06 million (EUR 100 million) unissued bond framework; total drawn debt is strictly controlled at $252.46 million (EUR 223.3 million).
A 50% interest rate hedge on the Nordic bond mathematically restricts a +100bps rate shock to a $2.26 million (EUR 2.0 million) PBT impact and $0.2 million against USD debt. FX modeling exposes translation vulnerability: a +/- 10% USD/EUR variance alters revenue by $17.75 million (EUR 15.7 million) and EBIT by $2.60 million (EUR 2.3 million). Concurrently, a +/- 10% GBP/EUR variance alters revenue by $5.65 million (EUR 5.0 million) and EBIT by $1.47 million (EUR 1.3 million).
Corporate governance successfully directed a listing transfer to the Nasdaq Stockholm Main Market. The 2030 objective targets an Adjusted EBITA exceeding $339.18 million (EUR 300 million). Board composition includes 5 members (40% female, 60% independent), chaired by Magnus Welander, with Pia Marions leading the Audit Committee following the exits of Robert Belkic and Frida Westerberg. Principal owner Fidelio Capital holds a 58.4% stake via Theodor Bonnier and Gabriel Fitzgerald, charging a $25,495 (SEK 250k) administrative fee. Executive turnover saw former CEO Patrik Eriksson’s July exit, an interim stabilization by Carl-Johan Zetterberg Boudrie, and Alireza Tajbakhsh assuming the CEO mandate in November. The LTI 2025 mandate requires 37 executives to deploy personal capital vesting in 2028, while short-term variable pay remains capped at 100% for the CEO and 75% for other executives. Related Party Transactions (RPTs) recognized $10.97 million (EUR 9.7 million) in licensing income invoiced to an entity owned by manager Nick Bova to secure North American pharmacy compliance, alongside a $0.45 million (EUR 0.4 million) loan to Diagnostics minority interests.
Presentation Download & Video Access:
- Presentation Download: Click the PDF download link under 'Related Topics' to access the full institutional presentation of this report.
- Video Link: Click this link to watch the HDIN analyst briefing on YouTube.
About HDIN Research:
HDIN Research is a premier global market intelligence and strategic advisory firm specializing in institutional-grade financial analysis, supply chain audits, and macroeconomic forecasting. Our dedicated sector analysts deliver actionable, data-driven insights tailored for private equity, hedge funds, and corporate strategy teams. Visit us at http://www.hdinresearch.com.
*2026 AI Transparency Footer:*
"This intelligence report was authored by HDIN Research analysts following a rigorous audit of official corporate filings. AI was utilized for massive-scale data synthesis and structural drafting, ensuring 100% inclusion of reported data points. All strategic insights, financial modeling, and final verdicts were verified by our editorial board to ensure professional accuracy and compliance with 2026 Google Search E-E-A-T standards."
* Vimian Group [STO: VIMIAN] reported 2025 revenue of $480.5 million (EUR 425.0 million), reflecting a bifurcated 6% organic growth rate driven by high-margin Specialty Pharma offsetting a -1% contraction in US orthopedic surgery.
* Operations remain decentralized across 52 global offices; California and Florida anchor the MedTech supply chain, utilizing secondary US warehouses to mitigate documented climate exposure.
* A $104.2 million net M&A cash outflow drove inorganic scale, yet robust $352.6 million absolute liquidity and 2.0x leverage validate an aggressive non-dilutive 2030 consolidation mandate.
Figure Vimian Group 2025: Scaling Strategic Resilience in Global Animal Health
Segmental Realities and Financial ArchitectureThe global animal health Total Addressable Market (TAM) is projected to reach $50.88 billion (EUR 45 billion) by 2030, scaling from $31.66 billion (EUR 28 billion) in 2023 at a 7% CAGR. In 2025, Vimian Group expanded consolidated revenue by 13% to $480.5 million (EUR 425.0 million), though the organic growth rate decelerated to 6% from 9% in 2024. Operating leverage metrics present a mixed profile: Adjusted EBITDA held at $135.1 million (EUR 119.5 million) with a 28.1% margin, while Adjusted EBITA reached $119.1 million (EUR 105.3 million), marking a 60-basis-point margin compression to 24.8% from 25.4%.
Statutory Operating Cash Flow (OCF) was reported at $119.5 million (EUR 105.7 million), explicitly inflated by a one-off $32.4 million (EUR 28.7 million) settlement receipt. Normalized OCF stands at $87.1 million, reflecting a highly sustainable 64.5% conversion rate. This cash injection resulted from a Veterinary Orthopedic Implants (VOI) indemnification dispute where the Delaware Superior Court awarded Vimian $40.2 million in damages plus $8.6 million in pre-judgment interest. Former sellers paid $31.9 million, leaving an uncollected $6.2 million receivable classified conservatively as doubtful pending a Supreme Court of Delaware appeal. The firm received an additional $0.90 million (EUR 0.8 million) in separate legacy VOI settlement payments.
Items affecting comparability totaled $16.6 million (EUR 14.7 million), absorbing $4.6 million (EUR 4.1 million) in M&A transaction costs, $2.5 million (EUR 2.2 million) in restructuring charges, and $7.7 million (EUR 6.8 million) in net VOI litigation fees, with exactly $6.90 million (EUR 6.1 million) in legal fees netted against received payments.
Table Segment Performance, Growth & Operational Mix Matrix
| Operating Segment | Revenue (USD M) | Revenue (EUR M) | Organic Growth | Adj. EBITA (USD M) | Adj. EBITA (EUR M) | Adj. EBITA Margin | Operational Mix Breakdown / Portfolio Notes |
| Specialty Pharma | $206.2 | €182.4 | +8.0% | $60.9 | €53.9 | 29.6% | Spec. Nutrition 40%, Dermatology 24%, Allergy Diagnostics & Treatments 18%, Spec. Pharma 18% |
| MedTech | $175.8 | €155.5 | -1.0% | $44.8 | €39.6 | 25.5% | Orthopedics 42%, Dental 31%, Surgical Solutions 27% |
| Veterinary Services | $72.7 | €64.3 | +11.0% | $20.8 | €18.4 | 28.6% | 11 co-owned clinics in Sweden/Denmark equal ~33% of segment sales |
| Diagnostics | $25.9 | €22.9 | +10.0% | $2.5 | €2.2 | 9.5% | PCR & ELISA solutions 61%, Sample Preparation 32%, Instruments & Services 7% |
| Total / Blended | $480.6 | €425.1 | — | $129.0 | €114.1 | 26.8% | Consolidated Group Portfolio Matrix |
Infrastructure Layout and Geographic Moats
Vimian operates across 80 global markets with 1,300 employees distributed among 52 offices, generating 51% of consolidated revenue in Europe, 38% in North America, and 11% in the Rest of World (ROW)/APAC region. Country-specific revenue concentrations are anchored by the United States at $172.0 million (EUR 152.1 million), the United Kingdom at $60.5 million (EUR 53.5 million), and Australia at $30.5 million (EUR 27.0 million). The company asserts a highly fragmented client base, with zero customers exceeding a 10% consolidated revenue threshold.
Physical manufacturing and supply chain operations remain strictly decentralized. The Group headquarters are based in Stockholm. Diagnostics production is housed in Germany and the Netherlands, while Specialty Pharma operates an Italian facility upgraded with solar panel installations to fulfill environmental compliance targets. Within MedTech, the newly acquired AllAccem Inc. manages a dedicated California, USA facility producing proprietary SANOS® veterinary dental sealants. To neutralize extreme climate threats, specifically hurricanes affecting the primary VOI warehouse in Florida, Vimian maintains strategic inventory buffers at a backup facility in a secondary US state. Movora China commands the APAC operational hub from Beijing.
Internal R&D functions commercialized 94 new products in 2025, supported by a portfolio of 300 products engineered to combat antimicrobial resistance (AMR). Specialty Pharma controls 40 patent families and launched 75 products; this catalyzed cross-selling that delivered one-third of the segment's 8% organic growth and pushed direct European online channel expansion over 30%. Critical pipeline rollouts featured the PAX allergy test (co-developed with MacroArray Diagnostics, adding >20 new canine allergens), Peptivet 4, and an unregistered Feline Chronic Gingivostomatitis oral paste. The Diagnostics unit launched 12 products, deploying the AI-driven Ovacyte platform and engineering a rapid 5-month turnaround Bluetongue Disease PCR assay for European cattle.
Veterinary education functions as the core go-to-market engine. The firm trained 65,000 veterinary professionals globally, integrating 200 in-person dental trainings alongside advanced surgical instruction at proprietary orthopedic centers in Boston, USA, and Zurich, Switzerland. The VetFamily platform aggressively expanded, onboarding 2,500 new member clinics to reach 10,900 globally, simultaneously launching the dvmGRO US procurement platform. The B2B2C VetPlan subscription model currently covers over 84,000 enrolled pets.
Geographic segmentation data isolates APAC operations as generating 17% of total MedTech sales, while global dental operations drove 16% of MedTech sales. North America constitutes 41% of regional dental revenues. Veterinary Services derives 78% of its revenue from Europe and 17% from North America. ESG corporate standards mandate an Employee Net Promoter Score (eNPS) of 50—controlling 20% to 30% of executive variable remuneration—and a targeted 42% reduction in Scope 1 and 2 emissions against a 2022 baseline. Centralized supply chain governance successfully enforced a 92% audit completion rate among material suppliers.
Capital Allocation, Balance Sheet Realities, and Institutional Verdict
Vimian’s capital deployment remains aggressively skewed toward inorganic consolidation, approving $17.1 million (EUR 15.1 million) in organic CapEx (3.5% of revenue) versus a net M&A cash outflow of $104.2 million (EUR 92.2 million). This finalized 5 business acquisitions in 2025, elevating the lifetime deal count to 62 acquisitions since 2015. Transactions targeting the dental sub-niche (Dental Focus LLC, AllAccem Inc, Blossom Vets BV, David AI) carried a combined purchase consideration of $73.71 million (EUR 65.2 million). Deal structuring utilized zero equity issuance, relying entirely on $64.00 million (EUR 56.6 million) in cash [86.8%] and $9.72 million (EUR 8.6 million) in earn-outs [13.2%]. These acquisitions bolted on $53.1 million (EUR 47 million) in consolidated revenues, building upon 2024’s iM3 acquisition and preempting the March 2026 I-Vet consolidation.
The standalone $65.12 million (EUR 57.6 million) AllAccem acquisition was executed via $58.23 million in cash and a $6.90 million earn-out, generating $43.53 million in intangibles and $31.43 million in goodwill. Group-wide 2025 Purchase Price Allocation (PPA) recognized $48.62 million (EUR 43.0 million) in intangibles, $35.05 million (EUR 31.0 million) in goodwill, $38.67 million (EUR 34.2 million) in net assets, and -$13.45 million (EUR -11.9 million) in Deferred Tax Liabilities (DTL).
The balance sheet is heavily weighted by $667.17 million (EUR 590.1 million) in aggregate goodwill. Value-in-Use (VIU) testing utilizes a 4-year forecast anchored by a 2.0% terminal rate.
* Specialty Pharma: $321.99 million (EUR 284.8 million) [48% allocation], WACC 11.9%, assumed EBITDA 32-34%.
* MedTech: $214.25 million (EUR 189.5 million) [32% allocation], WACC 13.7%, assumed EBITDA 29-31%.
* Veterinary Services: $111.25 million (EUR 98.4 million), WACC 10.9%, assumed EBITDA 31-35%.
* Diagnostics: $19.67 million (EUR 17.4 million) [3% allocation], WACC 11.8%, assumed EBITDA 12-20%.
Internal modeling withstood stress tests of a 1.0 percentage point terminal growth drop, a 1.5 percentage point WACC surge, or a 1.0 percentage point EBITDA contraction without breaching carrying values. Capitalized R&D tightened to $6.78 million (EUR 6.0 million) from $8.93 million (EUR 7.9 million) in 2024. Amortization schedules apply 5-16 years for patents, 7-15 years for brands, and 5-10 years for internally generated assets.
Off-balance sheet Level 3 liabilities feature $52.57 million (EUR 46.5 million) in contingent considerations tied to 27 agreements, capped at a maximum payable limit of $127.98 million (EUR 113.2 million) over 1-5 years. A modeled 10% target overperformance yields an additional $9.16 million (EUR 8.1 million) liability. Remeasurement of these obligations generated a $5.1 million (EUR 4.5 million) finance expense.
The 29% effective corporate tax rate heavily penalizes the 20.6% Swedish statutory rate. Total DTL sits at $40.14 million (EUR 35.5 million), directly driven by $39.12 million (EUR 34.6 million) in amortization mismatches. Deferred Tax Assets (DTA) of $5.88 million (EUR 5.2 million) are verified by $4.41 million (EUR 3.9 million) in loss carry-forwards. Lease commitments stand at $17.41 million (EUR 15.4 million) matched against $16.73 million (EUR 14.8 million) in Right-of-Use assets. The maturity distribution isolates <12-month obligations at $5.43 million (EUR 4.8 million), 1-3 years at $8.48 million (EUR 7.5 million), and 3-5 years at $3.50 million (EUR 3.1 million). Swiss defined benefit pensions (Kyon AG/Ossium AG) managed via Profond carry a $0.23 million (EUR 0.2 million) obligation fully immunized by $0.23 million (EUR 0.2 million) in assets (net zero). Actuarial sensitivity confirms a +/- 0.25% shift on the 1.20% discount rate yields a $0.0 million impact. Warranty provisions are fixed at $0.0 million, other provisions equal $1.81 million (EUR 1.6 million), and off-balance sheet guarantees total $1.36 million (EUR 1.2 million).
Liquidity metrics firmly defend the M&A pipeline. Net debt reached $277.4 million (EUR 245.4 million), securing a 2.0x Net Debt/Adjusted LTM EBITDA leverage ratio against a rigid 3.0x covenant ceiling. Immediate liquidity equals $352.64 million (EUR 311.9 million), holding $62.2 million (EUR 55.0 million) in cash reserves alongside $290.4 million (EUR 256.9 million) in unutilized revolving facilities. May 2025 debt restructuring locked a $373.1 million (EUR 330 million) syndicated loan maturing in 2030 and a $169.59 million (EUR 150 million) Nordic bond due in 2028. Total committed facilities equal $542.69 million (EUR 480.0 million) with an additional $113.06 million (EUR 100 million) unissued bond framework; total drawn debt is strictly controlled at $252.46 million (EUR 223.3 million).
A 50% interest rate hedge on the Nordic bond mathematically restricts a +100bps rate shock to a $2.26 million (EUR 2.0 million) PBT impact and $0.2 million against USD debt. FX modeling exposes translation vulnerability: a +/- 10% USD/EUR variance alters revenue by $17.75 million (EUR 15.7 million) and EBIT by $2.60 million (EUR 2.3 million). Concurrently, a +/- 10% GBP/EUR variance alters revenue by $5.65 million (EUR 5.0 million) and EBIT by $1.47 million (EUR 1.3 million).
Corporate governance successfully directed a listing transfer to the Nasdaq Stockholm Main Market. The 2030 objective targets an Adjusted EBITA exceeding $339.18 million (EUR 300 million). Board composition includes 5 members (40% female, 60% independent), chaired by Magnus Welander, with Pia Marions leading the Audit Committee following the exits of Robert Belkic and Frida Westerberg. Principal owner Fidelio Capital holds a 58.4% stake via Theodor Bonnier and Gabriel Fitzgerald, charging a $25,495 (SEK 250k) administrative fee. Executive turnover saw former CEO Patrik Eriksson’s July exit, an interim stabilization by Carl-Johan Zetterberg Boudrie, and Alireza Tajbakhsh assuming the CEO mandate in November. The LTI 2025 mandate requires 37 executives to deploy personal capital vesting in 2028, while short-term variable pay remains capped at 100% for the CEO and 75% for other executives. Related Party Transactions (RPTs) recognized $10.97 million (EUR 9.7 million) in licensing income invoiced to an entity owned by manager Nick Bova to secure North American pharmacy compliance, alongside a $0.45 million (EUR 0.4 million) loan to Diagnostics minority interests.
Presentation Download & Video Access:
- Presentation Download: Click the PDF download link under 'Related Topics' to access the full institutional presentation of this report.
- Video Link: Click this link to watch the HDIN analyst briefing on YouTube.
About HDIN Research:
HDIN Research is a premier global market intelligence and strategic advisory firm specializing in institutional-grade financial analysis, supply chain audits, and macroeconomic forecasting. Our dedicated sector analysts deliver actionable, data-driven insights tailored for private equity, hedge funds, and corporate strategy teams. Visit us at http://www.hdinresearch.com.
*2026 AI Transparency Footer:*
"This intelligence report was authored by HDIN Research analysts following a rigorous audit of official corporate filings. AI was utilized for massive-scale data synthesis and structural drafting, ensuring 100% inclusion of reported data points. All strategic insights, financial modeling, and final verdicts were verified by our editorial board to ensure professional accuracy and compliance with 2026 Google Search E-E-A-T standards."