Dynavox Group AB: Aggressive Direct-to-Market Pivot Near Stockholm and Pittsburgh as 34.4% FX-Adjusted Top-Line Velocity Signals Structural AAC Sector Consolidation
Date : 2026-06-17
Reading : 203
HDIN Executive Takeaways
* Dynavox Group AB [STO: DYVOX] delivered a 34.4% FX-adjusted revenue expansion to $251.58M, driven by 26,996 total solutions supplied (+28% YoY) and a shifting hardware mix (72% Touch solutions, 28% Eye-tracking solutions).
* To counter physical climate risks across its China and Taiwan, China manufacturing nodes, management artificially lengthened the cash conversion cycle, absorbing $22.33M to maintain a 161-day inventory buffer.
* Despite EBIT margin compression to 10.3%, the $122.37M Swedbank social loan facility provides ample M&A liquidity, isolating the firm from $10.81M in non-recurring 2025 OPEX anomalies.
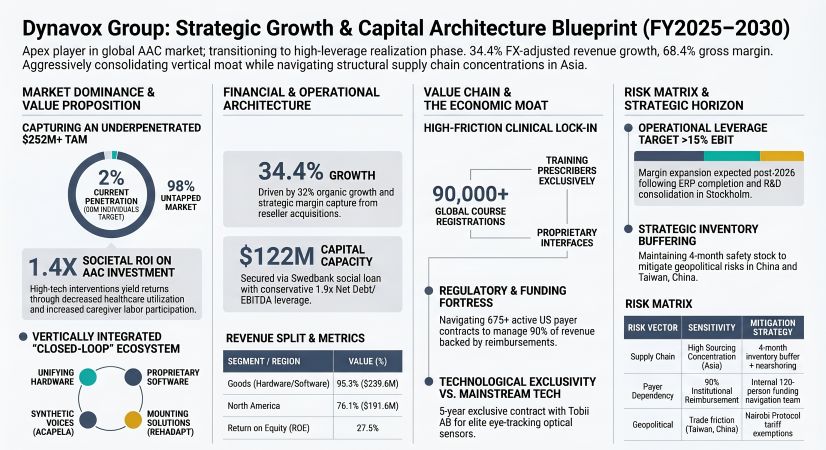
Figure Dynavox Group: Strategic Growth & Capital Architecture Blueprint (FY2025-2030)
 Segmental Realities and Margin Compression
Dynavox Group AB exhibits high top-line velocity characterized by a 25.1% nominal revenue expansion to $251.58M (32% organic growth, 2% M&A contribution). Foreign exchange fluctuations exacted a 9% drag on reported top-line figures. Total point-in-time revenue realization for hardware and perpetual software reached $228.55M (2,241.2M SEK), while extended warranties and service subscriptions recorded as deferred contract liabilities totaled $23.03M (225.8M SEK).
Geographically, operations are strictly bifurcated between direct market presence across 11 nations and legacy distributor reliance across 54+ external markets. North America generated $191.59M (76.1% of group revenue, +32% in local currency), supported by an internal 120-person funding team managing over 675 active U.S. payer contracts. Europe produced $46.96M (18.7%), while Other Countries recorded $13.03M (5.2%), notably propelled by 117% growth in Australia and New Zealand. Approximately 75% of total revenue is denominated in USD and EUR. Revenue deductions are strictly provisioned: final U.S. healthcare payer discounts average 3% to 4% of the accounts receivable book, while European retail volume discounts mandate an accrued $0.61M (6M SEK) annual revenue reduction.
Gross margins contracted 40 basis points from 68.8% to 68.4%, directly resulting from a $3.16M (31M SEK) transaction penalty incurred when selling USD-denominated inventory during periods of Swedish Krona strengthening. Concurrently, operating margins (EBIT) compressed from 11.6% to 10.3%. This 130-basis-point OPEX dilution isolates three specific non-recurring expenditures totaling $10.81M (106M SEK): a $4.18M (41M SEK) restructuring charge to consolidate U.S. product development into the Stockholm R&D hub, a $2.86M (28M SEK) North American ERP system rollout, and a $1.84M (18M SEK) share-based compensation anomaly including a $0.51M (5M SEK) historical catch-up cost. SG&A costs reached $120.38M.
Table Financial & Capital Allocation Data (1 USD = 9.806 SEK)
Infrastructure Layout and Regional Moats
Dynavox Group AB operates an end-to-end Augmentative and Alternative Communication (AAC) ecosystem targeting a Total Addressable Market (TAM) of 50 million individuals (approximately 2 million diagnosed annually, maintaining a ~2% penetration rate). The societal health economic ROI of these systems measures 1.4x over a 5-year period.
The global footprint separates intellectual property generation from high-volume hardware assembly. Global HQ and R&D operations are centralized in Stockholm, Sweden. Fulfillment is anchored by a newly relocated North American Hub in Pittsburgh, Pennsylvania, USA, supported by a 2025-established secondary technical hub in Mississauga, Canada. Final assembly of the TD I-110 and Navio series is executed in China, while proprietary Rehadapt aluminum mounting solutions are manufactured in Kassel, Germany. The upstream supply chain relies heavily on electronic components from Asia (specifically China and Taiwan, China). To preserve its technological moat in the high-acuity market, Dynavox Group AB executed a 5-year supply extension in June 2025 with Tobii AB (Sweden), cementing absolute sole-source exclusivity for elite eye-tracking optical sensors.
Physical climate risk (evaluated under IPCC scenario RCP8.5) and U.S.-China trade friction present structural bottlenecks. Although currently exempt from U.S. tariffs under the Nairobi Protocol, management artificially forces balance sheet inefficiency to maintain operational continuity, holding a 4-month strategic buffer inventory. This drove inventory up 40 days to 161 days, while receivable days compressed by 11 to 61 days, and payable days dropped by 30 to 52 days. Consequently, operating cash flow (OCF) deteriorated 30.4% to $20.05M (from $28.81M), burdened entirely by a $22.33M (219M SEK) working capital absorption. Total accounts receivable measure $42.25M (414.3M SEK), devoid of any single customer exceeding a 10% concentration threshold.
The Direct Presence M&A strategy targets margin capture from former distributors. Investing Cash Flow recorded -$32.27M (+12.7% YoY), deploying $10.50M (103M SEK) into cash M&A transactions while adding $16.87M (165.4M SEK) in goodwill and intangibles. The acquisition of Cenomy (France) required a $5.99M initial consideration with a Level 3 contingent earn-out up to $4.18M (EUR 3.7M). RehaMedia (Germany) required a $6.44M initial consideration, featuring a deferred $0.34M (EUR 0.3M) Q1 2026 payment and a contingent earn-out up to $3.62M (EUR 3.2M). Consequently, total contingent consideration liabilities escalated to $7.77M (76.2M SEK) from $3.22M (31.6M SEK). Management confirmed SR Labs Healthcare (Italy) will close in H1 2026.
Financing Cash Flow inverted to +$20.21M (from -$3.79M), netting a $7.99M cash increase to reserve $19.85M (194.7M SEK). Total Assets sit at $252.35M (+23.9%), Equity at $61.42M (+32.7%), and Liabilities at $190.91M (+21.2%). Net Debt expanded 38.3% to $92.70M (909M SEK). The firm utilizes a floating-rate $122.37M (1.2B SEK) Swedbank social loan facility, drawing $20.64M (202.4M SEK) and pushing the Net Debt/EBITDA ratio to 1.9x (covenant maximum: 3.5x). A covenant clause was invoked to pause principal repayments during Q1 2026 to optimize liquidity. Interest rate sensitivity dictates that a 100-basis-point hike reduces profit by $0.62M (6.1M SEK). Foreign exchange sensitivity indicates a 10% SEK fluctuation impacts net profit by $0.22M / 2.2M SEK (reduced from $0.57M / 5.6M SEK in 2024) and consolidated equity by $9.58M (93.9M SEK). Management initiated a proposed dividend of $0.051/share (0.5 SEK), aligning with the mandate to distribute ≥40% of net profit.
HDIN Institutional Verdict
Dynavox Group AB asserts an undisputed apex position within the B2B2C medical device matrix, leveraging a proprietary ecosystem encompassing TD Snap software, Acapela Group synthetic voices, and Boardmaker software housing 85,000+ Picture Communication Symbols (PCS). With 90% of revenue tethered to third-party public and private payers, the firm insulates against standard consumer default risk but trades it for institutional policy exposure. To mitigate this, the company subsidizes prescriber lock-in, generating over 90,000 global course registrations for speech-language pathologists (capturing the 5-10% of the 200,000 potential U.S. prescribers actively working in AAC).
Governance structures are highly aligned with shareholder wealth creation. CEO Fredrik Ruben received total FY2025 remuneration of $1.13M / 11.1M SEK ($0.46M base, $0.18M STI strictly capped at 100% of base, and $0.50M LTI), while eight other executives received a combined $3.88M (38.1M SEK). The Board of Directors features six non-executive members, 50% female representation, and 83% independence (co-founder Henrik Eskilsson serving as the sole non-independent member under Chair Gitte Pugholm Aabo). Group Management is contractually compelled to hold one year's base salary in Dynavox stock for five years. The LTI 2025 program (encompassing 97 participants and 329,457 stock units) demands an EBIT CAGR of 10% to 40%, mirroring the stringency of the LTI 2022 program which mandated a 105% Total Shareholder Return (TSR). Furthermore, Parent Company operations remain pristine; intra-group transactions (77% of Parent net sales and 24% of Parent OPEX) are cleanly eliminated upon consolidation. The firm maintains zero related-party transactions and limits off-balance-sheet pledges to a single $5.10M (50M SEK) commercial mortgage.
Regulatory and ESG execution transitions from compliance to operational strategy. The 2025 "Core First High Contrast" software release expanded clinical market access, while the firm prepares for the January 2027 adoption of IFRS 18. Medical device classifications strictly adhere to ISO 13485, EU MDR 2017/745, and FDA 21 CFR Part 820. Zero data breaches were recorded in 2025, supported by a 95% employee privacy training target by 2026. The independent WhistleB platform logged 13 complaints, recording zero severe violations. Environmentally, the company targets Net Zero by 2050, anchoring interim 2030 targets to a 35% absolute GHG reduction (via a 20% Scope 1 fleet reduction and a 25% Scope 2 renewables transition). Simultaneously, the newly integrated 5-Year Eco-Design plan mandates battery circularity and 100% recyclable packaging by 2030, running parallel to the firm's core social objective of improving 400,000 lives by 2030 (currently at 145,137 cumulative lives improved).
Presentation Download & Video Access:
- Presentation Download: Click the PDF download link under 'Related Topics' to access the full institutional presentation of this report.
- Video Link: Click this link to watch the HDIN analyst briefing on YouTube.
About HDIN Research:
HDIN Research is a premier global market intelligence and strategic advisory firm specializing in institutional-grade financial analysis, supply chain audits, and macroeconomic forecasting. Our dedicated sector analysts deliver actionable, data-driven insights tailored for private equity, hedge funds, and corporate strategy teams. Visit us at http://www.hdinresearch.com.
2026 AI Transparency Footer:
"This intelligence report was authored by HDIN Research analysts following a rigorous audit of official corporate filings. AI was utilized for massive-scale data synthesis and structural drafting, ensuring 100% inclusion of reported data points. All strategic insights, financial modeling, and final verdicts were verified by our editorial board to ensure professional accuracy and compliance with 2026 Google Search E-E-A-T standards."
* Dynavox Group AB [STO: DYVOX] delivered a 34.4% FX-adjusted revenue expansion to $251.58M, driven by 26,996 total solutions supplied (+28% YoY) and a shifting hardware mix (72% Touch solutions, 28% Eye-tracking solutions).
* To counter physical climate risks across its China and Taiwan, China manufacturing nodes, management artificially lengthened the cash conversion cycle, absorbing $22.33M to maintain a 161-day inventory buffer.
* Despite EBIT margin compression to 10.3%, the $122.37M Swedbank social loan facility provides ample M&A liquidity, isolating the firm from $10.81M in non-recurring 2025 OPEX anomalies.
Figure Dynavox Group: Strategic Growth & Capital Architecture Blueprint (FY2025-2030)
Segmental Realities and Margin CompressionDynavox Group AB exhibits high top-line velocity characterized by a 25.1% nominal revenue expansion to $251.58M (32% organic growth, 2% M&A contribution). Foreign exchange fluctuations exacted a 9% drag on reported top-line figures. Total point-in-time revenue realization for hardware and perpetual software reached $228.55M (2,241.2M SEK), while extended warranties and service subscriptions recorded as deferred contract liabilities totaled $23.03M (225.8M SEK).
Geographically, operations are strictly bifurcated between direct market presence across 11 nations and legacy distributor reliance across 54+ external markets. North America generated $191.59M (76.1% of group revenue, +32% in local currency), supported by an internal 120-person funding team managing over 675 active U.S. payer contracts. Europe produced $46.96M (18.7%), while Other Countries recorded $13.03M (5.2%), notably propelled by 117% growth in Australia and New Zealand. Approximately 75% of total revenue is denominated in USD and EUR. Revenue deductions are strictly provisioned: final U.S. healthcare payer discounts average 3% to 4% of the accounts receivable book, while European retail volume discounts mandate an accrued $0.61M (6M SEK) annual revenue reduction.
Gross margins contracted 40 basis points from 68.8% to 68.4%, directly resulting from a $3.16M (31M SEK) transaction penalty incurred when selling USD-denominated inventory during periods of Swedish Krona strengthening. Concurrently, operating margins (EBIT) compressed from 11.6% to 10.3%. This 130-basis-point OPEX dilution isolates three specific non-recurring expenditures totaling $10.81M (106M SEK): a $4.18M (41M SEK) restructuring charge to consolidate U.S. product development into the Stockholm R&D hub, a $2.86M (28M SEK) North American ERP system rollout, and a $1.84M (18M SEK) share-based compensation anomaly including a $0.51M (5M SEK) historical catch-up cost. SG&A costs reached $120.38M.
Table Financial & Capital Allocation Data (1 USD = 9.806 SEK)
| Financial Metric / Component | Amount (USD M) | Amount (SEK M) | YoY / Rate / Margin | Disclosures & Operational Context |
| PART I: REVENUE ARCHITECTURE & EARNINGS METRICS | ||||
| Total Revenue | $251.58 | 2,467.00 SEK | — | Segmental sum ($251.59M) differs marginally due to IFRS rounding. |
| — Goods Revenue | $239.64 | 2,349.91 SEK | 95.3% | Core manufacturing and product sales volume. |
| — Services Revenue | $11.32 | 111.00 SEK | 4.5% | Secondary recurring service revenue stream. |
| — Royalties Revenue | $0.63 | 6.18 SEK | 0.2% | IP licensing and third-party royalty fee income. |
| Gross Profit | $172.16 | 1,688.20 SEK | +24.5% YoY | Demonstrates robust cross-segment margin pricing power. |
| Cost of Goods Sold (COGS) | ($79.42) | (778.79 SEK) | +26.4% YoY | Reflects moderate raw material and shipping inflation. |
| EBITDA | $49.14 | 481.87 SEK | +12.5% YoY | Represents a 19.5% consolidated margin baseline. |
| EBIT (Operating Profit) | $25.91 | 254.07 SEK | +11.2% YoY | Represents a 10.3% consolidated margin baseline. |
| Net Profit | $16.90 | 165.72 SEK | +13.6% YoY | Attributable to owners; represents a 6.7% net profit margin. |
| PART II: CAPITAL EFFICIENCY RATIOS | ||||
| Return on Equity (ROE) | — | — | 27.5% | Compressed from 32.1% in the prior fiscal period. |
| Return on Capital Employed (ROCE) | — | — | 14.2% | Moderated from 16.7% due to expansionary asset injection. |
| Return on Investment / Assets (ROI/ROA) | — | — | 6.7% | Shifted from 7.3% in the prior fiscal period. |
| PART III: R&D PIPELINE & INTANGIBLE ASSETS | ||||
| Gross R&D Expenditure | $23.66 | 232.00 SEK | +28.2% YoY | Accelerated strategic core R&D pipeline from $18.46M. |
| — Capitalized R&D Component | $11.01 | 108.00 SEK | 46.5% Cap Rate | Contracted from $11.73M (prior year capitalization rate: 63.5%). |
| Total Amortization Charges | ($11.85) | (116.20 SEK) | — | Non-cash impact fully absorbed within operating expenses. |
| Total Intangible Assets Balance | $106.07 | 1,040.10 SEK | 42.0% of Assets | Tested at a 13.69% WACC against a 2.0% terminal growth rate. |
| — Goodwill Carrying Value | $41.07 | 402.70 SEK | — | Tied to historic and current synergistic corporate M&A. |
| — Trademarks & Brands | $39.36 | 386.00 SEK | — | Valued and tracked as a primary marketing intangible. |
| — Total Patents Carrying Value | $0.29 | 2.80 SEK | — | Includes $0.09M (0.9M SEK) in brand-new patent acquisitions. |
| PART IV: LEASES & DEFERRED TAXATION DYNAMICS | ||||
| Right-of-Use (RoU) Assets | $18.22 | 178.70 SEK | — | Capitalized lease arrangements under standardized reporting. |
| Lease Liabilities | ($21.16) | (207.50 SEK) | — | Corresponding payment obligations for active operational leases. |
| Deferred Tax Assets (DTA) | $6.00 | 58.80 SEK | — | Includes $2.55M (25.0M SEK) in unutilized loss carry-forwards. |
| — Unrecognized Tax Shields | $2.19 | 21.50 SEK | — | Off-balance sheet protective tax optimization reservoir. |
| Deferred Tax Liabilities (DTL) | ($1.38) | (13.50 SEK) | — | Derived from corporate asset temporary timing variations. |
Infrastructure Layout and Regional Moats
Dynavox Group AB operates an end-to-end Augmentative and Alternative Communication (AAC) ecosystem targeting a Total Addressable Market (TAM) of 50 million individuals (approximately 2 million diagnosed annually, maintaining a ~2% penetration rate). The societal health economic ROI of these systems measures 1.4x over a 5-year period.
The global footprint separates intellectual property generation from high-volume hardware assembly. Global HQ and R&D operations are centralized in Stockholm, Sweden. Fulfillment is anchored by a newly relocated North American Hub in Pittsburgh, Pennsylvania, USA, supported by a 2025-established secondary technical hub in Mississauga, Canada. Final assembly of the TD I-110 and Navio series is executed in China, while proprietary Rehadapt aluminum mounting solutions are manufactured in Kassel, Germany. The upstream supply chain relies heavily on electronic components from Asia (specifically China and Taiwan, China). To preserve its technological moat in the high-acuity market, Dynavox Group AB executed a 5-year supply extension in June 2025 with Tobii AB (Sweden), cementing absolute sole-source exclusivity for elite eye-tracking optical sensors.
Physical climate risk (evaluated under IPCC scenario RCP8.5) and U.S.-China trade friction present structural bottlenecks. Although currently exempt from U.S. tariffs under the Nairobi Protocol, management artificially forces balance sheet inefficiency to maintain operational continuity, holding a 4-month strategic buffer inventory. This drove inventory up 40 days to 161 days, while receivable days compressed by 11 to 61 days, and payable days dropped by 30 to 52 days. Consequently, operating cash flow (OCF) deteriorated 30.4% to $20.05M (from $28.81M), burdened entirely by a $22.33M (219M SEK) working capital absorption. Total accounts receivable measure $42.25M (414.3M SEK), devoid of any single customer exceeding a 10% concentration threshold.
The Direct Presence M&A strategy targets margin capture from former distributors. Investing Cash Flow recorded -$32.27M (+12.7% YoY), deploying $10.50M (103M SEK) into cash M&A transactions while adding $16.87M (165.4M SEK) in goodwill and intangibles. The acquisition of Cenomy (France) required a $5.99M initial consideration with a Level 3 contingent earn-out up to $4.18M (EUR 3.7M). RehaMedia (Germany) required a $6.44M initial consideration, featuring a deferred $0.34M (EUR 0.3M) Q1 2026 payment and a contingent earn-out up to $3.62M (EUR 3.2M). Consequently, total contingent consideration liabilities escalated to $7.77M (76.2M SEK) from $3.22M (31.6M SEK). Management confirmed SR Labs Healthcare (Italy) will close in H1 2026.
Financing Cash Flow inverted to +$20.21M (from -$3.79M), netting a $7.99M cash increase to reserve $19.85M (194.7M SEK). Total Assets sit at $252.35M (+23.9%), Equity at $61.42M (+32.7%), and Liabilities at $190.91M (+21.2%). Net Debt expanded 38.3% to $92.70M (909M SEK). The firm utilizes a floating-rate $122.37M (1.2B SEK) Swedbank social loan facility, drawing $20.64M (202.4M SEK) and pushing the Net Debt/EBITDA ratio to 1.9x (covenant maximum: 3.5x). A covenant clause was invoked to pause principal repayments during Q1 2026 to optimize liquidity. Interest rate sensitivity dictates that a 100-basis-point hike reduces profit by $0.62M (6.1M SEK). Foreign exchange sensitivity indicates a 10% SEK fluctuation impacts net profit by $0.22M / 2.2M SEK (reduced from $0.57M / 5.6M SEK in 2024) and consolidated equity by $9.58M (93.9M SEK). Management initiated a proposed dividend of $0.051/share (0.5 SEK), aligning with the mandate to distribute ≥40% of net profit.
HDIN Institutional Verdict
Dynavox Group AB asserts an undisputed apex position within the B2B2C medical device matrix, leveraging a proprietary ecosystem encompassing TD Snap software, Acapela Group synthetic voices, and Boardmaker software housing 85,000+ Picture Communication Symbols (PCS). With 90% of revenue tethered to third-party public and private payers, the firm insulates against standard consumer default risk but trades it for institutional policy exposure. To mitigate this, the company subsidizes prescriber lock-in, generating over 90,000 global course registrations for speech-language pathologists (capturing the 5-10% of the 200,000 potential U.S. prescribers actively working in AAC).
Governance structures are highly aligned with shareholder wealth creation. CEO Fredrik Ruben received total FY2025 remuneration of $1.13M / 11.1M SEK ($0.46M base, $0.18M STI strictly capped at 100% of base, and $0.50M LTI), while eight other executives received a combined $3.88M (38.1M SEK). The Board of Directors features six non-executive members, 50% female representation, and 83% independence (co-founder Henrik Eskilsson serving as the sole non-independent member under Chair Gitte Pugholm Aabo). Group Management is contractually compelled to hold one year's base salary in Dynavox stock for five years. The LTI 2025 program (encompassing 97 participants and 329,457 stock units) demands an EBIT CAGR of 10% to 40%, mirroring the stringency of the LTI 2022 program which mandated a 105% Total Shareholder Return (TSR). Furthermore, Parent Company operations remain pristine; intra-group transactions (77% of Parent net sales and 24% of Parent OPEX) are cleanly eliminated upon consolidation. The firm maintains zero related-party transactions and limits off-balance-sheet pledges to a single $5.10M (50M SEK) commercial mortgage.
Regulatory and ESG execution transitions from compliance to operational strategy. The 2025 "Core First High Contrast" software release expanded clinical market access, while the firm prepares for the January 2027 adoption of IFRS 18. Medical device classifications strictly adhere to ISO 13485, EU MDR 2017/745, and FDA 21 CFR Part 820. Zero data breaches were recorded in 2025, supported by a 95% employee privacy training target by 2026. The independent WhistleB platform logged 13 complaints, recording zero severe violations. Environmentally, the company targets Net Zero by 2050, anchoring interim 2030 targets to a 35% absolute GHG reduction (via a 20% Scope 1 fleet reduction and a 25% Scope 2 renewables transition). Simultaneously, the newly integrated 5-Year Eco-Design plan mandates battery circularity and 100% recyclable packaging by 2030, running parallel to the firm's core social objective of improving 400,000 lives by 2030 (currently at 145,137 cumulative lives improved).
Presentation Download & Video Access:
- Presentation Download: Click the PDF download link under 'Related Topics' to access the full institutional presentation of this report.
- Video Link: Click this link to watch the HDIN analyst briefing on YouTube.
About HDIN Research:
HDIN Research is a premier global market intelligence and strategic advisory firm specializing in institutional-grade financial analysis, supply chain audits, and macroeconomic forecasting. Our dedicated sector analysts deliver actionable, data-driven insights tailored for private equity, hedge funds, and corporate strategy teams. Visit us at http://www.hdinresearch.com.
2026 AI Transparency Footer:
"This intelligence report was authored by HDIN Research analysts following a rigorous audit of official corporate filings. AI was utilized for massive-scale data synthesis and structural drafting, ensuring 100% inclusion of reported data points. All strategic insights, financial modeling, and final verdicts were verified by our editorial board to ensure professional accuracy and compliance with 2026 Google Search E-E-A-T standards."