Credo Technology: 205.7% AEC Revenue Expansion Near Hyperscale Hubs as $1.44B Liquidity Signals End-to-End Optical Consolidation
Date : 2026-06-18
Reading : 390
HDIN Executive Takeaways
* Active Electrical Cable (AEC) deployments catalyzed 99% of an $898.3 million revenue expansion, compressing R&D intensity by 1,270 basis points and driving Non-GAAP operating margins to 47.0%.
* Asset deployment exhibits severe structural asymmetry; 57.5% of end-market demand routes to the United States, while $68.1 million of physical assets and 100% of wafer fabrication are isolated in Taiwan, China.
* Aggressive capacity provisioning drove a 178.6% inventory expansion to $250.8 million, triggering a 90.1% surge in obsolescence provisions amid volatile transition cycles toward 1.6T infrastructures.
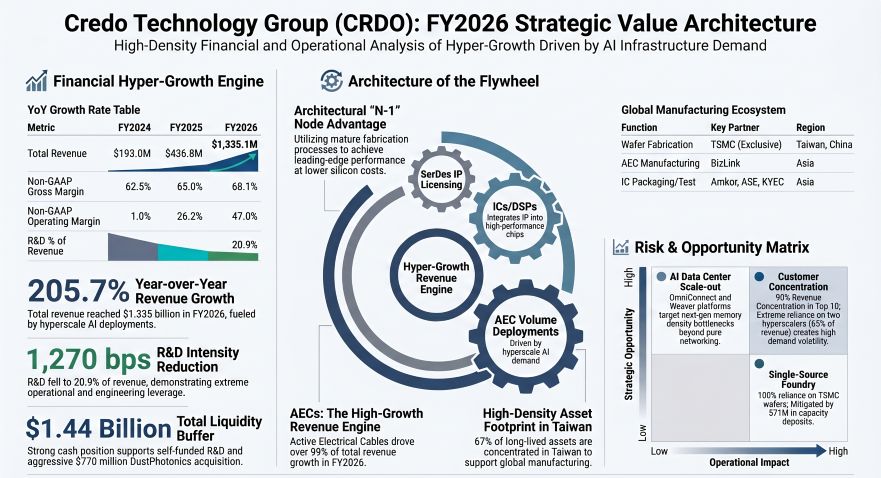
Figure Credo Technology Group (CRDO): FY2026 Strategic Value Architecture
 Segmental Realities and Margin Compression
Credo Technology Group Holding Ltd [NASDAQ: CRDO] executed a hyper-growth transition during Fiscal 2026, driven strictly by back-end scale-up networks (currently 10x denser than scale-out and 100x denser than front-end compute) within Artificial Intelligence clusters exceeding 1 Gigawatt in power capacity. Over 99% of the $898.3 million absolute revenue increase materialized via hyperscale deployments of ZeroFlap CLOS, SPAN, SHIFT, and SWITCH AECs operating up to 1.6T speeds. These cables consume 50% less power than Active Optical Cables (AOCs) and require 75% less volume than Direct Attach Cables (DACs), enabling densities of 1,000 cables per rack.
The resulting operational leverage is quantified below. Core margin premiums stem from the company's "N-1" node architectural strategy—deploying proprietary Serializer/Deserializer (SerDes) and Digital Signal Processor (DSP) architectures on mature fabrication processes to avoid leading-edge wafer costs, supplemented by the 3nm Bluebird 200G/lane DSP and OmniConnect Weaver memory gearboxes delivering 12x higher memory bandwidth and 40x higher density.
Table Income Statement & Margin Leverage Matrix (FY2024 - FY2026)
Earnings quality is fortified by $464.3 million in net cash provided by operating activities (a 34.8% cash conversion rate on revenue). However, GAAP versus Non-GAAP discrepancies are driven heavily by $182.6 million in Share-Based Compensation (SBC) in FY2026, representing 13.7% of total revenue. Of the $279.4 million R&D outlay, $60.9 million constituted SBC, while $35.4 million was allocated to pre-production mask sets and lab testing costs for architectures spanning Dove, Lark, Robin, and Seagull Integrated Circuits (ICs), Toucan PCIe Retimers, and PILOT Software Platforms.
Geographic Demand Shift (Destination of Shipment)
* United States: $768.1 million (57.5% of total, compared to $65.1 million in FY25; +1,080.0% YoY).
* Hong Kong, China: $378.2 million (28.3% of total, compared to $243.7 million in FY25; +55.2% YoY).
* Rest of World: $85.2 million (6.4% of total, compared to $44.3 million in FY25; +92.3% YoY).
* Mainland China: $80.9 million (6.1% of total, compared to $80.1 million in FY25; +1.0% YoY).
* Taiwan, China: $22.7 million (1.7% of total, compared to $3.6 million in FY25; +530.6% YoY).
Client concentration poses a structural headwind. The top 10 customers dictate approximately 90% of total revenue. Just three end customers account for 84% of revenue, with Customer D generating 33% ($440.6 million) and Customer B generating 32% ($427.2 million). Accounts Receivable (AR) counterparty risk diverges slightly from end-demand: Contracting Customer A holds 53% of AR (generating 49% of revenue), Contracting Customer B holds 20% of AR (32% of revenue), and Contracting Customer C holds 19% of AR (generating less than 10% of revenue). Collectively, these top three AR entities control 92% of the uncollected cash balance.
Infrastructure Layout and Regional Moats
Credo Technology Group operates a 100% outsourced fabless manufacturing framework, introducing stark geopolitical and single-point supply vulnerabilities. Wafer fabrication is exclusively consolidated at TSMC in Taiwan, China. Packaging, assembly, and testing are allocated across Asian facilities via Amkor Technology, ASE, KYEC, and Sigurd, while BizLink exclusively manufactures the hyper-growth AEC product line. Transitioning foundries would trigger a 9 to 12-month supply halt, devastating delivery pipelines amid strict 2 to 3-year design win qualification phases and 3 to 5-year product life cycles.
Balance Sheet, Liquidity & Asset Obligations
* Capital Reserves: Cash and cash equivalents of $1.16 billion plus $278.3 million in short-term investments form a $1.44 billion liquidity buffer, representing a $1.01 billion YoY increase fueled by $464.3 million in internal cash generation and a $736.3 million At-The-Market (ATM) equity offering of 4.8 million ordinary shares. Capital expenditures remained constrained at $57.3 million, yielding $407 million in Free Cash Flow.
* Fixed Assets & Geography: Gross Property and Equipment expanded from $107,834,000 to $180,194,000, concentrated in Production Equipment ($63.2 million) and Computer/Software ($48.9 million). Accumulated Depreciation reached $(78,589,000) from $(44,203,000) in FY25, driving D&A to $34.6 million. Of the specified $83.5 million in long-lived physical assets, $68.1 million (67%) are situated in Taiwan, China, with only $14.7 million in the US and $0.7 million in Hong Kong, China. Minor impairment charges scaled from $873,000 in FY25 to $1,500,000 in FY26.
* Lease Commitments: Undiscounted operating lease liabilities total $29.66 million across US, Canada, Singapore, Mainland China, Hong Kong, China, and Taiwan, China facilities. Payment schedules dictate $6.09 million in FY27, $6.38 million in FY28, $5.84 million in FY29, $4.97 million in FY30, $3.01 million in FY31, and $3.36 million thereafter. Discounted at a 6.27% rate, present value stands at $25.45 million.
* Unconditional Purchase Obligations: Rigid multi-year capital commitments equal $359.95 million ($337.75 million for foundry partners and $22.21 million for IP licensing). Execution is front-loaded, with $346.06 million due in FY2027, $11.05 million in FY2028, and $2.85 million in FY2029.
* Take-or-Pay Contingencies: To secure AI cluster capacity, management deployed $71.0 million in refundable deposits with assembly subcontractors, committing to $188.6 million in purchase volumes for FY2027 and FY2028. Post-FY26, an additional $13.1 million was deposited to guarantee $43.7 million in inventory capacity over a two-year horizon.
* Tax Architecture: Facilitated by its Cayman Islands parent structure (providing an 18% favorable foreign rate differential), the consolidated effective tax rate was 1%. Gross Deferred Tax Assets (DTAs) total $170.49 million, comprising Net Operating Losses ($78.36 million), R&D credits ($72.87 million), and SBC ($10.56 million). Gross Deferred Tax Liabilities (DTLs) represent $(13.23) million (Intangibles $(6.50) million, ROU $(4.78) million, PP&E $(1.95) million). Management increased the valuation allowance by $93.44 million to $162.89 million, indicating doubt in utilizing $353.0 million in federal NOLs and $61.3 million in federal R&D credits (expiring 2039).
Regulatory headwinds persist regarding U.S. Outbound Investment Rules (effective January 2, 2025) restricting semiconductor capital, alongside potential friction with the PRC’s Unreliable Entity List and Rules Counteracting Unjustified Extraterritorial Application of Foreign Legislation.
HDIN Institutional Verdict
Credo Technology Group is executing a high-risk structural pivot from organic IC engineering to inorganic optical consolidation. In FY2026, the company deployed $112.9 million in net cash toward two acquisitions: Hyperlume in September 2025 ($92.0 million total; $88.7 million cash, $3.3 million shares) and CoMira in February 2026 ($35.1 million cash). This injected $92,798,000 in Goodwill ($69.1 million from Hyperlume, $21.8 million from CoMira) and $29,262,000 in Intangible Assets ($17.7 million In-Process R&D, $11.6 million Developed Tech) onto the balance sheet, contrasting sharply against just $11.1 million and $5.2 million in respective acquired cash and assets.
This M&A trajectory accelerated post-FY2026 with the $770 million cash and 0.8 million ordinary share acquisition of DustPhotonics to capture silicon photonics capabilities, bearing additional earn-out liabilities of $31.6 million in cash and 2.8 million shares.
Simultaneously, hyperscaler purchase order flexibility has created a severe working capital drag. Gross inventory spiked 178.6% from $90,029,000 to $250,831,000. Raw materials grew 405.4% to $64,357,000 and WIP advanced 39.5% to $34,296,000. Crucially, $152,178,000 (60.6%) of inventory is locked in finished goods (a 188.7% YoY expansion), pulling $174.0 million in operating cash outflow. Operating against $426.8 million in COGS and $170.4 million in average inventory, the turnover ratio deteriorated to 2.50x (146 Days Sales of Inventory). This structural duration risk on 400G and 800G cables triggered a 90.1% spike in Excess and Obsolete (E&O) provisions from $7,952,000 to $15,116,000.
Executive compensation exhibits aggressive alignment with massive market capitalization expansion. After 0.2 million PSUs paid out at 200% in FY25, management issued 1.3 million PSUs in FY26. On May 28, 2026, CEO William Brennan received a 100% performance-based megagrant spanning six tranches through June 30, 2031, requiring dual achievement targets from $2.5 billion revenue at $244.70 per share (Tranche 1) up to $7.5 billion revenue at $489.40 per share (Tranche 6). Following the November 2023 adoption of SEC Rule 5608 recoupment policies, insider trading protocols shifted. Brennan and COO Yat Tung Lam terminated existing Rule 10b5-1 plans in March and April 2026, while Lam and Director Pantas Sutardja adopted new mid-2026 to early-2027 disposition frameworks.
Presentation Download & Video Access:
Presentation Download: Click the PDF download link under 'Related Topics' to access the full institutional presentation of this report.
Video Link: Click this link to watch the HDIN analyst briefing on YouTube.
About HDIN Research:
HDIN Research is a premier global market intelligence and strategic advisory firm specializing in institutional-grade financial analysis, supply chain audits, and macroeconomic forecasting. Our dedicated sector analysts deliver actionable, data-driven insights tailored for private equity, hedge funds, and corporate strategy teams. Visit us at http://www.hdinresearch.com.
2026 AI Transparency Footer:
"This intelligence report was authored by HDIN Research analysts following a rigorous audit of official corporate filings. AI was utilized for massive-scale data synthesis and structural drafting, ensuring 100% inclusion of reported data points. All strategic insights, financial modeling, and final verdicts were verified by our editorial board to ensure professional accuracy and compliance with 2026 Google Search E-E-A-T standards."
* Active Electrical Cable (AEC) deployments catalyzed 99% of an $898.3 million revenue expansion, compressing R&D intensity by 1,270 basis points and driving Non-GAAP operating margins to 47.0%.
* Asset deployment exhibits severe structural asymmetry; 57.5% of end-market demand routes to the United States, while $68.1 million of physical assets and 100% of wafer fabrication are isolated in Taiwan, China.
* Aggressive capacity provisioning drove a 178.6% inventory expansion to $250.8 million, triggering a 90.1% surge in obsolescence provisions amid volatile transition cycles toward 1.6T infrastructures.
Figure Credo Technology Group (CRDO): FY2026 Strategic Value Architecture
Segmental Realities and Margin CompressionCredo Technology Group Holding Ltd [NASDAQ: CRDO] executed a hyper-growth transition during Fiscal 2026, driven strictly by back-end scale-up networks (currently 10x denser than scale-out and 100x denser than front-end compute) within Artificial Intelligence clusters exceeding 1 Gigawatt in power capacity. Over 99% of the $898.3 million absolute revenue increase materialized via hyperscale deployments of ZeroFlap CLOS, SPAN, SHIFT, and SWITCH AECs operating up to 1.6T speeds. These cables consume 50% less power than Active Optical Cables (AOCs) and require 75% less volume than Direct Attach Cables (DACs), enabling densities of 1,000 cables per rack.
The resulting operational leverage is quantified below. Core margin premiums stem from the company's "N-1" node architectural strategy—deploying proprietary Serializer/Deserializer (SerDes) and Digital Signal Processor (DSP) architectures on mature fabrication processes to avoid leading-edge wafer costs, supplemented by the 3nm Bluebird 200G/lane DSP and OmniConnect Weaver memory gearboxes delivering 12x higher memory bandwidth and 40x higher density.
Table Income Statement & Margin Leverage Matrix (FY2024 - FY2026)
| Metric (in USD Thousands) | FY2024 | FY2025 | FY2026 | YoY Delta (FY25-FY26) |
| Total Revenue | $192,970 | $436,775 | $1,335,116 | +205.7% |
| GAAP Gross Profit | $119,431 | $282,909 | $908,349 | +221.1% |
| GAAP Gross Margin | 61.9% | 64.8% | 68.0% | +320 bps |
| Non-GAAP Gross Profit | $120,562 | $284,103 | $909,765 | +220.2% |
| Non-GAAP Gross Margin | 62.5% | 65.0% | 68.1% | +310 bps |
| R&D Expenses | $96,296 | $146,867 | $279,381 | +90.2% |
| R&D as % of Revenue | 49.9% | 33.6% | 20.9% | -1270 bps |
| SG&A Expenses | $60,193 | $98,918 | $183,963 | +86.0% |
| SG&A as % of Revenue | 31.2% | 22.6% | 13.8% | -880 bps |
| GAAP Operating Income (Loss) | $(37,058) | $37,124 | $445,005 | +1098.7% |
| GAAP Operating Margin | -19.2% | 8.5% | 33.3% | +2480 bps |
| Non-GAAP Operating Income | $1,964 | $114,479 | $628,043 | +448.6% |
| Non-GAAP Operating Margin | 1.0% | 26.2% | 47.0% | +2080 bps |
| GAAP Net Income (Loss) | $(28,369) | $52,183 | $472,279 | +805.0% |
| GAAP Net Margin | -14.7% | 11.9% | 35.4% | +2350 bps |
Earnings quality is fortified by $464.3 million in net cash provided by operating activities (a 34.8% cash conversion rate on revenue). However, GAAP versus Non-GAAP discrepancies are driven heavily by $182.6 million in Share-Based Compensation (SBC) in FY2026, representing 13.7% of total revenue. Of the $279.4 million R&D outlay, $60.9 million constituted SBC, while $35.4 million was allocated to pre-production mask sets and lab testing costs for architectures spanning Dove, Lark, Robin, and Seagull Integrated Circuits (ICs), Toucan PCIe Retimers, and PILOT Software Platforms.
Geographic Demand Shift (Destination of Shipment)
* United States: $768.1 million (57.5% of total, compared to $65.1 million in FY25; +1,080.0% YoY).
* Hong Kong, China: $378.2 million (28.3% of total, compared to $243.7 million in FY25; +55.2% YoY).
* Rest of World: $85.2 million (6.4% of total, compared to $44.3 million in FY25; +92.3% YoY).
* Mainland China: $80.9 million (6.1% of total, compared to $80.1 million in FY25; +1.0% YoY).
* Taiwan, China: $22.7 million (1.7% of total, compared to $3.6 million in FY25; +530.6% YoY).
Client concentration poses a structural headwind. The top 10 customers dictate approximately 90% of total revenue. Just three end customers account for 84% of revenue, with Customer D generating 33% ($440.6 million) and Customer B generating 32% ($427.2 million). Accounts Receivable (AR) counterparty risk diverges slightly from end-demand: Contracting Customer A holds 53% of AR (generating 49% of revenue), Contracting Customer B holds 20% of AR (32% of revenue), and Contracting Customer C holds 19% of AR (generating less than 10% of revenue). Collectively, these top three AR entities control 92% of the uncollected cash balance.
Infrastructure Layout and Regional Moats
Credo Technology Group operates a 100% outsourced fabless manufacturing framework, introducing stark geopolitical and single-point supply vulnerabilities. Wafer fabrication is exclusively consolidated at TSMC in Taiwan, China. Packaging, assembly, and testing are allocated across Asian facilities via Amkor Technology, ASE, KYEC, and Sigurd, while BizLink exclusively manufactures the hyper-growth AEC product line. Transitioning foundries would trigger a 9 to 12-month supply halt, devastating delivery pipelines amid strict 2 to 3-year design win qualification phases and 3 to 5-year product life cycles.
Balance Sheet, Liquidity & Asset Obligations
* Capital Reserves: Cash and cash equivalents of $1.16 billion plus $278.3 million in short-term investments form a $1.44 billion liquidity buffer, representing a $1.01 billion YoY increase fueled by $464.3 million in internal cash generation and a $736.3 million At-The-Market (ATM) equity offering of 4.8 million ordinary shares. Capital expenditures remained constrained at $57.3 million, yielding $407 million in Free Cash Flow.
* Fixed Assets & Geography: Gross Property and Equipment expanded from $107,834,000 to $180,194,000, concentrated in Production Equipment ($63.2 million) and Computer/Software ($48.9 million). Accumulated Depreciation reached $(78,589,000) from $(44,203,000) in FY25, driving D&A to $34.6 million. Of the specified $83.5 million in long-lived physical assets, $68.1 million (67%) are situated in Taiwan, China, with only $14.7 million in the US and $0.7 million in Hong Kong, China. Minor impairment charges scaled from $873,000 in FY25 to $1,500,000 in FY26.
* Lease Commitments: Undiscounted operating lease liabilities total $29.66 million across US, Canada, Singapore, Mainland China, Hong Kong, China, and Taiwan, China facilities. Payment schedules dictate $6.09 million in FY27, $6.38 million in FY28, $5.84 million in FY29, $4.97 million in FY30, $3.01 million in FY31, and $3.36 million thereafter. Discounted at a 6.27% rate, present value stands at $25.45 million.
* Unconditional Purchase Obligations: Rigid multi-year capital commitments equal $359.95 million ($337.75 million for foundry partners and $22.21 million for IP licensing). Execution is front-loaded, with $346.06 million due in FY2027, $11.05 million in FY2028, and $2.85 million in FY2029.
* Take-or-Pay Contingencies: To secure AI cluster capacity, management deployed $71.0 million in refundable deposits with assembly subcontractors, committing to $188.6 million in purchase volumes for FY2027 and FY2028. Post-FY26, an additional $13.1 million was deposited to guarantee $43.7 million in inventory capacity over a two-year horizon.
* Tax Architecture: Facilitated by its Cayman Islands parent structure (providing an 18% favorable foreign rate differential), the consolidated effective tax rate was 1%. Gross Deferred Tax Assets (DTAs) total $170.49 million, comprising Net Operating Losses ($78.36 million), R&D credits ($72.87 million), and SBC ($10.56 million). Gross Deferred Tax Liabilities (DTLs) represent $(13.23) million (Intangibles $(6.50) million, ROU $(4.78) million, PP&E $(1.95) million). Management increased the valuation allowance by $93.44 million to $162.89 million, indicating doubt in utilizing $353.0 million in federal NOLs and $61.3 million in federal R&D credits (expiring 2039).
Regulatory headwinds persist regarding U.S. Outbound Investment Rules (effective January 2, 2025) restricting semiconductor capital, alongside potential friction with the PRC’s Unreliable Entity List and Rules Counteracting Unjustified Extraterritorial Application of Foreign Legislation.
HDIN Institutional Verdict
Credo Technology Group is executing a high-risk structural pivot from organic IC engineering to inorganic optical consolidation. In FY2026, the company deployed $112.9 million in net cash toward two acquisitions: Hyperlume in September 2025 ($92.0 million total; $88.7 million cash, $3.3 million shares) and CoMira in February 2026 ($35.1 million cash). This injected $92,798,000 in Goodwill ($69.1 million from Hyperlume, $21.8 million from CoMira) and $29,262,000 in Intangible Assets ($17.7 million In-Process R&D, $11.6 million Developed Tech) onto the balance sheet, contrasting sharply against just $11.1 million and $5.2 million in respective acquired cash and assets.
This M&A trajectory accelerated post-FY2026 with the $770 million cash and 0.8 million ordinary share acquisition of DustPhotonics to capture silicon photonics capabilities, bearing additional earn-out liabilities of $31.6 million in cash and 2.8 million shares.
Simultaneously, hyperscaler purchase order flexibility has created a severe working capital drag. Gross inventory spiked 178.6% from $90,029,000 to $250,831,000. Raw materials grew 405.4% to $64,357,000 and WIP advanced 39.5% to $34,296,000. Crucially, $152,178,000 (60.6%) of inventory is locked in finished goods (a 188.7% YoY expansion), pulling $174.0 million in operating cash outflow. Operating against $426.8 million in COGS and $170.4 million in average inventory, the turnover ratio deteriorated to 2.50x (146 Days Sales of Inventory). This structural duration risk on 400G and 800G cables triggered a 90.1% spike in Excess and Obsolete (E&O) provisions from $7,952,000 to $15,116,000.
Executive compensation exhibits aggressive alignment with massive market capitalization expansion. After 0.2 million PSUs paid out at 200% in FY25, management issued 1.3 million PSUs in FY26. On May 28, 2026, CEO William Brennan received a 100% performance-based megagrant spanning six tranches through June 30, 2031, requiring dual achievement targets from $2.5 billion revenue at $244.70 per share (Tranche 1) up to $7.5 billion revenue at $489.40 per share (Tranche 6). Following the November 2023 adoption of SEC Rule 5608 recoupment policies, insider trading protocols shifted. Brennan and COO Yat Tung Lam terminated existing Rule 10b5-1 plans in March and April 2026, while Lam and Director Pantas Sutardja adopted new mid-2026 to early-2027 disposition frameworks.
Presentation Download & Video Access:
Presentation Download: Click the PDF download link under 'Related Topics' to access the full institutional presentation of this report.
Video Link: Click this link to watch the HDIN analyst briefing on YouTube.
About HDIN Research:
HDIN Research is a premier global market intelligence and strategic advisory firm specializing in institutional-grade financial analysis, supply chain audits, and macroeconomic forecasting. Our dedicated sector analysts deliver actionable, data-driven insights tailored for private equity, hedge funds, and corporate strategy teams. Visit us at http://www.hdinresearch.com.
2026 AI Transparency Footer:
"This intelligence report was authored by HDIN Research analysts following a rigorous audit of official corporate filings. AI was utilized for massive-scale data synthesis and structural drafting, ensuring 100% inclusion of reported data points. All strategic insights, financial modeling, and final verdicts were verified by our editorial board to ensure professional accuracy and compliance with 2026 Google Search E-E-A-T standards."