BICO Group AB: Portfolio Divestitures Near Gothenburg and Boston as -$106.35M Asset Impairment Signals Transition to Capital-Light Operating Model
Date : 2026-06-18
Reading : 68
HDIN Executive Takeaways
* BICO Group AB [STO: BICO] reported a -13.3% contraction in top-line revenue to $152.68 million, driven by National Institutes of Health funding cuts and compressing Adjusted EBITDA margins by 790 basis points year-over-year to 0.3%.
* Strategic deleveraging via the sale of MatTek and Visikol to Sartorius generated $75.43 million in net cash, effectively neutralizing the 2026 debt wall and securing a $28.28 million net cash position.
* The non-cash impairment of -$106.35 million across Biosero and Discover Echo assets formally resets historical M&A valuations, forcing management to address a highly constrained 157-day Cash Conversion Cycle to fund future operations.
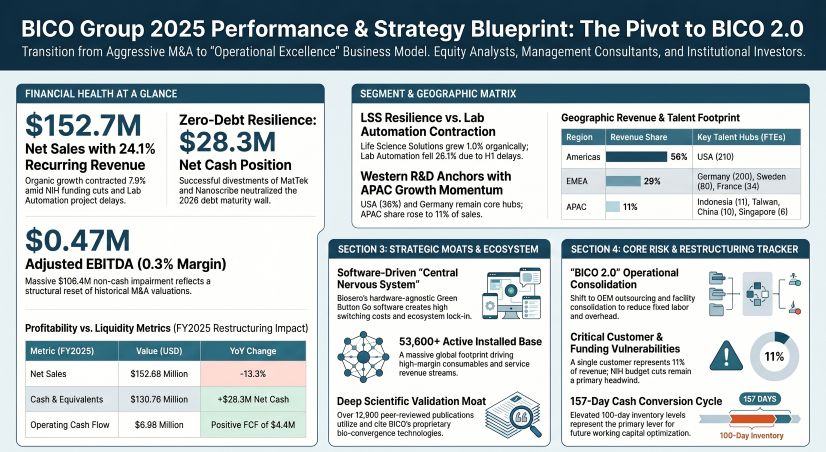
Figure BICO Group 2025 Performance & Strategy Blueprint: The Pivot to Blco 2.0
 Segmental Realities and Balance Sheet Reconstitution
BICO Group AB executed a structural financial reset in FY2025, prioritizing balance sheet liquidity over historical acquisition-led revenue generation. The consolidated top-line reached $152.68 million (SEK 1,497.2m), representing a -13.3% total decline. The core operational footprint recorded a -7.9% organic contraction, compounded by a -5.4% drag from foreign exchange translation and the divestment of key subsidiaries.
Gross margins eroded 130 basis points to 52.1% (down from 53.4% in 2024), impacted heavily by negative project cost revisions within the Lab Automation division. The resulting net loss from continuing operations stood at -$161.51 million (SEK -1,583.8m), with total net loss reaching -$111.47 million (SEK -1,093.1m).
The financial profile is anchored by a massive -$106.35 million (SEK -1,042.9m) non-cash impairment charge, acting as a direct adjustment to overvalued legacy acquisitions measured against a revised Weighted Average Cost of Capital (WACC) framework. Management elevated the post-tax WACC discount rate to between 12.4% and 14.4% and reduced the terminal perpetual growth rate from 2.5% to 1.5%.
Segmental & Revenue Quality Matrix
* Life Science Solutions: Generated $112.96 million (74% of total sales) with +1.0% organic growth.
* Lab Automation: Generated $39.83 million (26% of total sales) with a -26.1% organic decline.
* Capital Equipment & Projects (Point-in-Time/Non-Recurring): $115.95 million. Comprising foundational instruments ($83.06 million / 53.3% of sales) and custom Lab Automation projects ($32.89 million). Total point-in-time recognized revenue equaled $109.39 million, with over-time recognized revenue at $43.29 million.
* Consumables & Services (Recurring): Generated $36.73 million (24.1% of total sales, up from 20.4% in 2024). Consumables represented $17.76 million; Services generated $18.97 million.
Table P&L One-Off Adjustments & EBITDA Output
Capital Allocation and Deleveraging Liquidity
To address a highly leveraged balance sheet with a -46% Return on Equity (measured against average equity of $242 million / SEK 2,378m), BICO liquidated non-core assets to fund aggressive debt repurchases. Divestitures included the MatTek and Visikol units to Sartorius for a debt-free value of $80.0 million, yielding $75.43 million (SEK 739.7m) in net cash and a capital gain of $49.77 million (SEK 488m). Nanoscribe was sold for an Enterprise Value of $32.33 million (EUR 28.6m), generating an $8.50 million (SEK 83.4m) capital gain. The sale of BICO Real Estate Oy contributed an additional $3.96 million (EUR 3.5m), while the divestment of a Taiwan subsidiary resulted in a -$1.04 million (SEK -10.2m) P&L impact.
These proceeds facilitated the repurchase of $38.14 million (SEK 374m) nominal value convertible bonds at discounts to par (89% and 96%). The remaining short-term debt of $102.47 million (SEK 1,004.8m) was entirely neutralized post-reporting date (January 2026) via the issuance of a EUR 40 million ($45.22 million) senior secured bond. This strategic maneuver pushed the Net Debt to EBITDA ratio to -60.0, cementing a year-end net cash position of $28.28 million (SEK 277.3m) independent of $28.75 million (SEK 281.9m) in lease liabilities.
Cash generation operations yielded $6.98 million (SEK 68.4m) in Operating Cash Flow. Strict capital discipline restricted CapEx to -$2.55 million (SEK -25.0m), resulting in a positive Free Cash Flow of $4.43 million (SEK 43.4m). Total R&D spending equaled $13.35 million (SEK 130.9m), representing 8.7% of net sales. The R&D capitalization rate was rigidly maintained at 8.8% ($1.17 million / SEK 11.5m), ensuring 91.2% ($12.18 million / SEK 119.4m) was immediately expensed. Total R&D P&L expense reached $20.89 million (SEK 204.9m), factoring in $8.72 million (SEK 85.5m) in historical amortization.
Infrastructure Layout and Regional Moats
BICO operates within a $102 billion Total Addressable Market (TAM), aggressively targeting a Serviceable Addressable Market (SAM) of $2.7 billion ($1.2–$1.4 billion in Lab Automation; ~$1.4 billion in Life Science Solutions). Generating $152.68 million against this SAM yields an implied penetration rate of 5.6%. The overarching competitive moat is dictated by an active installed base of 53,600+ instruments across 65+ countries, validated by 12,900+ peer-reviewed academic publications.
The company is structurally pivoting toward an asset-light Original Equipment Manufacturer (OEM) model. Physical asset distribution favors Germany ($100.73 million / SEK 987.8m), the USA ($56.05 million / SEK 549.6m), and Sweden ($10.61 million / SEK 104.0m). This supply chain architecture relies heavily on virgin materials and critical tier-1 inputs from semiconductor and polymer sectors, necessitating suppliers capable of consuming up to 3,000 m³ of ultrapure water daily.
Geographic Revenue & Headcount Distribution
Total global headcount contracted from 812 to 650 Full-Time Equivalents (FTEs). Continuing operations averaged 589 FTEs (down 7.4% from 636 in 2024), incurring $0.66 million (SEK 6.5m) in restructuring costs (down from $1.49 million / SEK 14.6m in 2024).
* Americas: 58% of global sales. The United States generated $85.81 million. Headcount: USA (210 FTEs).
* EMEA: 29% of global sales. Key drivers include the UK ($10.52 million) and Germany ($9.22 million). Headcount: Germany (200 FTEs), Sweden (80 FTEs), France (34 FTEs), UK (33 FTEs).
* APAC: 11% of global sales. Distribution-led footprint including China ($4.92 million), Singapore ($3.02 million), Japan ($2.72 million), South Korea ($2.28 million), and Taiwan ($0.70 million). Headcount: Indonesia (11 FTEs), Taiwan (10 FTEs), Singapore (6 FTEs), China (3 FTEs), Japan (3 FTEs).
* Rest of World: 1% of total sales.
Working Capital Constraints and Supply Exposures
Operational execution is currently bottlenecked by a 157-day Cash Conversion Cycle (CCC).
* Days Sales Outstanding (DSO): 92 days, holding trade receivables of $38.41 million (SEK 376.7m).
* Days Inventory Outstanding (DIO): 100 days, maintaining inventory at $20.03 million (SEK 196.4m) against COGS of $73.11 million (SEK 716.9m).
* Days Payable Outstanding (DPO): 35 days, with trade payables of $7.10 million (SEK 69.6m).
The Lab Automation segment introduces a strict concentration risk: a single enterprise client constitutes 11% of total group revenue ($16.79 million / SEK 164.7m). To secure ecosystem lock-in, BICO's R&D output included adding 20 new drivers to the Green Button Go software, launching the GoSimple workcells in partnership with Sartorius and Becton Dickinson, and releasing the I.DOT LT (17.3 nL dispensing capability) alongside the QInstruments TurnStation.
Internally, executive compensation is tied to equity performance. Share-Based Compensation (SBC) expense was $0.34 million (SEK 3.3m), down from $0.61 million (SEK 6.0m) in 2024. The 2025 Long-Term Incentive Program (LTIP) distributed 700,000 options at a strike price of $5.43 (SEK 53.29), exercisable between June and August 2028. Total outstanding options sit at 3,133,593, representing a maximum shareholder dilution of 4.9%. Furthermore, management is mandated to reinvest 25% of gross variable cash bonuses into BICO shares, locked for three years.
HDIN Institutional Verdict
The 2025 financial disclosures confirm that BICO Group AB has successfully arrested its liquidity crisis, but it has yet to prove its operational viability under the "BICO 2.0" consolidation framework. The mathematical elimination of the March 2026 debt wall via the EUR 40 million refinancing and $75.43 million in immediate divestment cash guarantees near-term survival. However, the -$106.35 million impairment charge is an explicit admission that historical M&A capital deployment was fundamentally mispriced relative to current cost of capital constraints (14.4% WACC).
While the 53,600+ installed instrument base forms a theoretical commercial moat, human capital output metrics expose severe friction in extracting synergies. Revenue per FTE contracted 6.4% year-over-year from $276,950 to $259,219, while Adjusted EBITDA per FTE effectively collapsed from $22,626 to $798. Unadjusted EBITDA per employee stands deeply negative at -$5,603.
The immediate equity narrative relies entirely on compressing the 157-day Cash Conversion Cycle. BICO is currently bearing 100 days of inventory risk while financing customers over a sluggish 92-day collection period, severely misaligned with its 35-day supplier payout timeline. If the new executive matrix can successfully leverage the Green Button Go software architecture to push recurring aftermarket revenue past the current 24.1% threshold, the $130.76 million absolute cash buffer provides the necessary runway. Failure to accelerate inventory turnover and align working capital dynamics with industry standards will result in a permanent sub-WACC return profile, irrespective of balance sheet solvency.
Presentation Download & Video Access:
- Presentation Download: Click the PDF download link under 'Related Topics' to access the full institutional presentation of this report.
- Video Link: Click this link to watch the HDIN analyst briefing on YouTube.
About HDIN Research:
HDIN Research is a premier global market intelligence and strategic advisory firm specializing in institutional-grade financial analysis, supply chain audits, and macroeconomic forecasting. Our dedicated sector analysts deliver actionable, data-driven insights tailored for private equity, hedge funds, and corporate strategy teams. Visit us at http://www.hdinresearch.com.
*This intelligence report was authored by HDIN Research analysts following a rigorous audit of official corporate filings. AI was utilized for massive-scale data synthesis and structural drafting, ensuring 100% inclusion of reported data points. All strategic insights, financial modeling, and final verdicts were verified by our editorial board to ensure professional accuracy and compliance with 2026 Google Search E-E-A-T standards.*
* BICO Group AB [STO: BICO] reported a -13.3% contraction in top-line revenue to $152.68 million, driven by National Institutes of Health funding cuts and compressing Adjusted EBITDA margins by 790 basis points year-over-year to 0.3%.
* Strategic deleveraging via the sale of MatTek and Visikol to Sartorius generated $75.43 million in net cash, effectively neutralizing the 2026 debt wall and securing a $28.28 million net cash position.
* The non-cash impairment of -$106.35 million across Biosero and Discover Echo assets formally resets historical M&A valuations, forcing management to address a highly constrained 157-day Cash Conversion Cycle to fund future operations.
Figure BICO Group 2025 Performance & Strategy Blueprint: The Pivot to Blco 2.0
Segmental Realities and Balance Sheet ReconstitutionBICO Group AB executed a structural financial reset in FY2025, prioritizing balance sheet liquidity over historical acquisition-led revenue generation. The consolidated top-line reached $152.68 million (SEK 1,497.2m), representing a -13.3% total decline. The core operational footprint recorded a -7.9% organic contraction, compounded by a -5.4% drag from foreign exchange translation and the divestment of key subsidiaries.
Gross margins eroded 130 basis points to 52.1% (down from 53.4% in 2024), impacted heavily by negative project cost revisions within the Lab Automation division. The resulting net loss from continuing operations stood at -$161.51 million (SEK -1,583.8m), with total net loss reaching -$111.47 million (SEK -1,093.1m).
The financial profile is anchored by a massive -$106.35 million (SEK -1,042.9m) non-cash impairment charge, acting as a direct adjustment to overvalued legacy acquisitions measured against a revised Weighted Average Cost of Capital (WACC) framework. Management elevated the post-tax WACC discount rate to between 12.4% and 14.4% and reduced the terminal perpetual growth rate from 2.5% to 1.5%.
Segmental & Revenue Quality Matrix
* Life Science Solutions: Generated $112.96 million (74% of total sales) with +1.0% organic growth.
* Lab Automation: Generated $39.83 million (26% of total sales) with a -26.1% organic decline.
* Capital Equipment & Projects (Point-in-Time/Non-Recurring): $115.95 million. Comprising foundational instruments ($83.06 million / 53.3% of sales) and custom Lab Automation projects ($32.89 million). Total point-in-time recognized revenue equaled $109.39 million, with over-time recognized revenue at $43.29 million.
* Consumables & Services (Recurring): Generated $36.73 million (24.1% of total sales, up from 20.4% in 2024). Consumables represented $17.76 million; Services generated $18.97 million.
Table P&L One-Off Adjustments & EBITDA Output
| Metric | USD (Millions) | SEK (Millions) |
| Total Asset Impairment | ($106.35) | (1,042.9) |
| Goodwill Write-down: Biosero CGU | ($55.05) | (539.8) |
| Goodwill Write-down: Discover Echo CGU | ($47.99) | (470.6) |
| Trademarks & Tech: Discover Echo | ($2.67) | (26.1) |
| Other Trademarks | ($1.34) | (13.1) |
| Acquired Technology | ($1.33) | (13.0) |
| Capitalized R&D Cancellation | ($0.66) | (6.5) |
| Historic US Sales Tax Expense | ($1.04) | (10.2) |
| Extraordinary Inventory Write-offs | ($0.67) | (6.6) |
| Reported EBIT (-86.3% margin) | ($131.82) | (1,292.6) |
| Reported EBITDA | ($3.30) | (32.4) |
| Adjusted EBITDA (0.3% margin) | $0.47 | 4.6 |
Capital Allocation and Deleveraging Liquidity
To address a highly leveraged balance sheet with a -46% Return on Equity (measured against average equity of $242 million / SEK 2,378m), BICO liquidated non-core assets to fund aggressive debt repurchases. Divestitures included the MatTek and Visikol units to Sartorius for a debt-free value of $80.0 million, yielding $75.43 million (SEK 739.7m) in net cash and a capital gain of $49.77 million (SEK 488m). Nanoscribe was sold for an Enterprise Value of $32.33 million (EUR 28.6m), generating an $8.50 million (SEK 83.4m) capital gain. The sale of BICO Real Estate Oy contributed an additional $3.96 million (EUR 3.5m), while the divestment of a Taiwan subsidiary resulted in a -$1.04 million (SEK -10.2m) P&L impact.
These proceeds facilitated the repurchase of $38.14 million (SEK 374m) nominal value convertible bonds at discounts to par (89% and 96%). The remaining short-term debt of $102.47 million (SEK 1,004.8m) was entirely neutralized post-reporting date (January 2026) via the issuance of a EUR 40 million ($45.22 million) senior secured bond. This strategic maneuver pushed the Net Debt to EBITDA ratio to -60.0, cementing a year-end net cash position of $28.28 million (SEK 277.3m) independent of $28.75 million (SEK 281.9m) in lease liabilities.
Cash generation operations yielded $6.98 million (SEK 68.4m) in Operating Cash Flow. Strict capital discipline restricted CapEx to -$2.55 million (SEK -25.0m), resulting in a positive Free Cash Flow of $4.43 million (SEK 43.4m). Total R&D spending equaled $13.35 million (SEK 130.9m), representing 8.7% of net sales. The R&D capitalization rate was rigidly maintained at 8.8% ($1.17 million / SEK 11.5m), ensuring 91.2% ($12.18 million / SEK 119.4m) was immediately expensed. Total R&D P&L expense reached $20.89 million (SEK 204.9m), factoring in $8.72 million (SEK 85.5m) in historical amortization.
Infrastructure Layout and Regional Moats
BICO operates within a $102 billion Total Addressable Market (TAM), aggressively targeting a Serviceable Addressable Market (SAM) of $2.7 billion ($1.2–$1.4 billion in Lab Automation; ~$1.4 billion in Life Science Solutions). Generating $152.68 million against this SAM yields an implied penetration rate of 5.6%. The overarching competitive moat is dictated by an active installed base of 53,600+ instruments across 65+ countries, validated by 12,900+ peer-reviewed academic publications.
The company is structurally pivoting toward an asset-light Original Equipment Manufacturer (OEM) model. Physical asset distribution favors Germany ($100.73 million / SEK 987.8m), the USA ($56.05 million / SEK 549.6m), and Sweden ($10.61 million / SEK 104.0m). This supply chain architecture relies heavily on virgin materials and critical tier-1 inputs from semiconductor and polymer sectors, necessitating suppliers capable of consuming up to 3,000 m³ of ultrapure water daily.
Geographic Revenue & Headcount Distribution
Total global headcount contracted from 812 to 650 Full-Time Equivalents (FTEs). Continuing operations averaged 589 FTEs (down 7.4% from 636 in 2024), incurring $0.66 million (SEK 6.5m) in restructuring costs (down from $1.49 million / SEK 14.6m in 2024).
* Americas: 58% of global sales. The United States generated $85.81 million. Headcount: USA (210 FTEs).
* EMEA: 29% of global sales. Key drivers include the UK ($10.52 million) and Germany ($9.22 million). Headcount: Germany (200 FTEs), Sweden (80 FTEs), France (34 FTEs), UK (33 FTEs).
* APAC: 11% of global sales. Distribution-led footprint including China ($4.92 million), Singapore ($3.02 million), Japan ($2.72 million), South Korea ($2.28 million), and Taiwan ($0.70 million). Headcount: Indonesia (11 FTEs), Taiwan (10 FTEs), Singapore (6 FTEs), China (3 FTEs), Japan (3 FTEs).
* Rest of World: 1% of total sales.
Working Capital Constraints and Supply Exposures
Operational execution is currently bottlenecked by a 157-day Cash Conversion Cycle (CCC).
* Days Sales Outstanding (DSO): 92 days, holding trade receivables of $38.41 million (SEK 376.7m).
* Days Inventory Outstanding (DIO): 100 days, maintaining inventory at $20.03 million (SEK 196.4m) against COGS of $73.11 million (SEK 716.9m).
* Days Payable Outstanding (DPO): 35 days, with trade payables of $7.10 million (SEK 69.6m).
The Lab Automation segment introduces a strict concentration risk: a single enterprise client constitutes 11% of total group revenue ($16.79 million / SEK 164.7m). To secure ecosystem lock-in, BICO's R&D output included adding 20 new drivers to the Green Button Go software, launching the GoSimple workcells in partnership with Sartorius and Becton Dickinson, and releasing the I.DOT LT (17.3 nL dispensing capability) alongside the QInstruments TurnStation.
Internally, executive compensation is tied to equity performance. Share-Based Compensation (SBC) expense was $0.34 million (SEK 3.3m), down from $0.61 million (SEK 6.0m) in 2024. The 2025 Long-Term Incentive Program (LTIP) distributed 700,000 options at a strike price of $5.43 (SEK 53.29), exercisable between June and August 2028. Total outstanding options sit at 3,133,593, representing a maximum shareholder dilution of 4.9%. Furthermore, management is mandated to reinvest 25% of gross variable cash bonuses into BICO shares, locked for three years.
HDIN Institutional Verdict
The 2025 financial disclosures confirm that BICO Group AB has successfully arrested its liquidity crisis, but it has yet to prove its operational viability under the "BICO 2.0" consolidation framework. The mathematical elimination of the March 2026 debt wall via the EUR 40 million refinancing and $75.43 million in immediate divestment cash guarantees near-term survival. However, the -$106.35 million impairment charge is an explicit admission that historical M&A capital deployment was fundamentally mispriced relative to current cost of capital constraints (14.4% WACC).
While the 53,600+ installed instrument base forms a theoretical commercial moat, human capital output metrics expose severe friction in extracting synergies. Revenue per FTE contracted 6.4% year-over-year from $276,950 to $259,219, while Adjusted EBITDA per FTE effectively collapsed from $22,626 to $798. Unadjusted EBITDA per employee stands deeply negative at -$5,603.
The immediate equity narrative relies entirely on compressing the 157-day Cash Conversion Cycle. BICO is currently bearing 100 days of inventory risk while financing customers over a sluggish 92-day collection period, severely misaligned with its 35-day supplier payout timeline. If the new executive matrix can successfully leverage the Green Button Go software architecture to push recurring aftermarket revenue past the current 24.1% threshold, the $130.76 million absolute cash buffer provides the necessary runway. Failure to accelerate inventory turnover and align working capital dynamics with industry standards will result in a permanent sub-WACC return profile, irrespective of balance sheet solvency.
Presentation Download & Video Access:
- Presentation Download: Click the PDF download link under 'Related Topics' to access the full institutional presentation of this report.
- Video Link: Click this link to watch the HDIN analyst briefing on YouTube.
About HDIN Research:
HDIN Research is a premier global market intelligence and strategic advisory firm specializing in institutional-grade financial analysis, supply chain audits, and macroeconomic forecasting. Our dedicated sector analysts deliver actionable, data-driven insights tailored for private equity, hedge funds, and corporate strategy teams. Visit us at http://www.hdinresearch.com.
*This intelligence report was authored by HDIN Research analysts following a rigorous audit of official corporate filings. AI was utilized for massive-scale data synthesis and structural drafting, ensuring 100% inclusion of reported data points. All strategic insights, financial modeling, and final verdicts were verified by our editorial board to ensure professional accuracy and compliance with 2026 Google Search E-E-A-T standards.*