Nitto Denko Corporation: Strategic CapEx Reallocation Near Toyohashi and Vietnam as 12.2% ROE Exposes Balance Sheet Over-Equitization
Date : 2026-06-19
Reading : 129
HDIN Executive Takeaways
* Margin Execution vs. Equity Drag: Consolidated Operating Profit (OP) margin reached an elite 17.9%, exceeding the 17.0% target. However, Return on Equity (ROE) underperformed at 12.2% against a 15.0% mandate, driven by a 79.6% equity ratio, forcing $403.1 million in share buybacks.
* Geopolitical CapEx Hedging: To mitigate Red Sea maritime chokepoints and US tariff exposures, $500.05 million in off-balance-sheet commitments were deployed, including a $306.0 million facility scaling in Vietnam and $333.4 million localized at the Toyohashi plant.
* Supply Chain De-risking: Inventory obsolescence write-downs plummeted 77.5% YoY to just $8.47 million, while former single-client revenue concentration risk ($714.7 million in FY2024) was eradicated, with zero downstream customers exceeding a 10% revenue share.
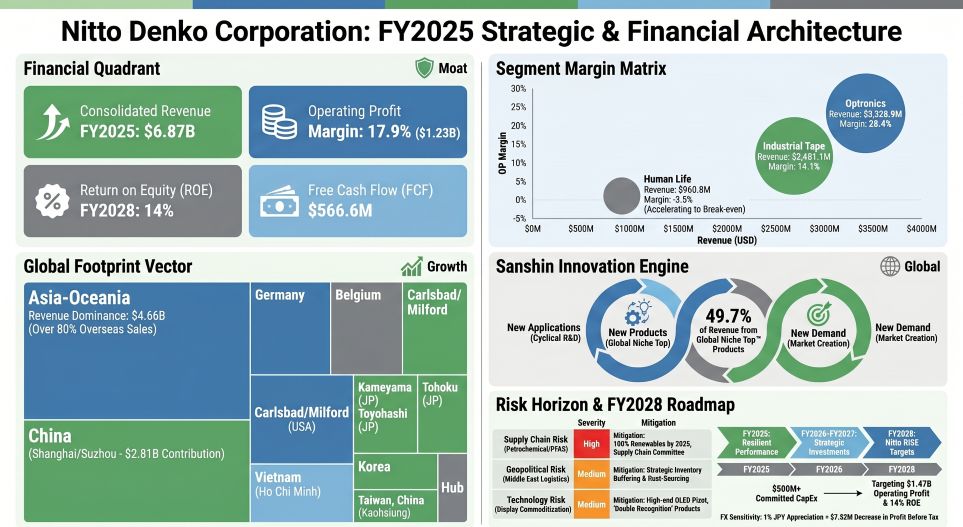
Figure Nitto Denko Corporation: FY2025 Strategic & Financial Architecture
 Segmental Realities, Margin Dynamics, and Capital Structure
For the fiscal year ending March 31, 2026, Nitto Denko Corporation [TSE: 6988] recorded consolidated revenue of $6,874.2 million (1,028,171 million JPY), representing +1.4% YoY top-line growth at a fixed conversion rate of 1 USD = 149.5686 JPY. Consolidated OP contracted by 1.1% YoY to $1,227.6 million (183.6 billion JPY). The net income settled at $892.6 million. Overall, products designated under the "Global Niche Top" (GNT) and "Area Niche Top" (ANT) framework accounted for 49.7% of total sales, directly aligning with management’s 50% target.
Segment-Level Financial Decomposition
* Optronics: Revenue contracted 2.6% YoY to $3,528.9 million (527,812 million JPY). OP dropped 13.4% YoY to $1,002.0 million (149,871 million JPY), retaining a 28.4% OP margin. R&D allocation: $111.0 million (16,602 million JPY).
* Industrial Tape: Revenue expanded 4.2% YoY to $2,451.1 million (366,607 million JPY). OP outpaced the top line, advancing 12.6% YoY to $345.4 million (51,662 million JPY), producing a 14.1% OP margin. R&D allocation: $55.7 million (8,331 million JPY).
* Human Life: Revenue advanced 8.5% YoY to $960.8 million (143,702 million JPY). Operating losses narrowed to -$33.7 million (-5,041 million JPY) from a prior loss of -$78.3 million. R&D allocation: $43.5 million (6,503 million JPY).
* Others: Revenue posted at $0.07 million (11 million JPY) with OP at -$46.6 million (-6,971 million JPY). R&D allocation: $36.1 million (5,403 million JPY). Unallocated corporate R&D expenditures consumed $74.8 million (11,184 million JPY).
Capital Allocation and Liquidity
Operating Cash Flow (OCF) generated $1,284.9 million, offset by Net Cash used in Investing Activities (ICF) of -$718.3 million, yielding a Free Cash Flow (FCF) of $566.6 million. CapEx outflows for PPE and intangibles strictly consumed $645.9 million.
* Leverage: Total Assets equaled $9,639.4 million against Total Equity of $7,675.6 million. Cash and cash equivalents hovered at $2,405.6 million. The balance sheet functions with zero short-term borrowings, limiting interest-bearing debt exclusively to lease liabilities of $211.6 million. Interest coverage ratios sit at 185.5x.
* Shareholder Returns: Dividend distributions commanded $265.2 million (42.5% non-consolidated payout ratio), adhering to a Dividend on Equity (DOE) target $\ge$ 4%. Management executed $403.1 million in buybacks, completing a $949.4 million (142 billion JPY) three-year program, before authorizing an additional $334.3 million (50 billion JPY) repurchase tranche in March 2026. The combined payout equals a 75% return on net income, surpassing the 60% total return ratio policy.
Working Capital and Inventory Integrity
The Cash Conversion Cycle (CCC) settled at 113 days. Trade and Other Receivables absorbed $1,550.3 million (DSO: 82 days), while Trade and Other Payables utilized $692.7 million (DPO: 59 days).
Inventory expanded +$100 million YoY to $1,055.5 million (157,870 million JPY), measured against COGS of $4,261.6 million (637,408 million JPY), generating a DIO of 90 days. Composition explicitly reflects: Merchandise and Finished Goods at $320.57 million (30.4%), Work-in-Progress at $407.39 million (38.6%), and Raw Materials and Supplies at $327.53 million (31.0%). FY2026 inventory valuation write-downs contracted to $8.47 million (1,267 million JPY) from $37.69 million (5,637 million JPY) in the prior cycle.
The firm’s sensitivity modeling indicates that a 1% appreciation of the JPY vs. the USD removes $7.52 million (1,124 million JPY) from Profit Before Tax.
Table 2: Extraordinary & Non-Operating Items
Table 3: Taxation & Pension Metrics
Infrastructure Layout, Intangibles, and Regional Dependencies
Overseas revenue exceeds 80% of total operations. By geography, Asia-Oceania captured $4,659.9 million (696,991 million JPY)—with direct sales in China specifically accounting for $2,808.4 million (420,049 million JPY). Japan contributed $953.8 million (142,657 million JPY), EMEA delivered $656.5 million (98,196 million JPY), the Americas posted $569.0 million (85,108 million JPY), and Others accounted for $34.9 million (5,218 million JPY).
Manufacturing Facilities and Off-Balance CapEx Approvals
Nitto Denko Corporation enforces a $500.05 million (74,792 million JPY) off-balance-sheet commitment targeting immediate expansion of regional footprints. Domestic scaling includes $333.4 million (49.86 billion JPY) at the Toyohashi Plant (Aichi) for completion by December 2028 (with $260.8 million / 39 billion JPY specifically allocated to electrical release tapes), $272.8 million (40.81 billion JPY) at the Kameyama Plant (Mie) slated for March 2029, and $225.4 million (33.71 billion JPY) at the Onomichi Plant (Hiroshima) by April 2029. In Asia-Oceania, a combined $306.0 million (45.75 billion JPY) targets the Ho Chi Minh and Bac Ninh facilities via Nitto Denko Vietnam Co., Ltd. and Nitto Vietnam Co., Ltd.
The physical production perimeter includes the Tohoku Plant (Miyagi), Kanto Plant (Saitama), Shiga Plant, Nitto Shinko Corp. (Fukui), and the "inovas" R&D facility at the Ibaraki Plant (Osaka). US operations operate through Kinovate Life Sciences, Inc. (Carlsbad), Nitto Denko Avecia Inc. (Milford), Nitto, Inc. (Teaneck), Nitto Denko Technical Corporation (Oceanside), Nitto BioPharma, Inc. (San Diego), and Nitto Bend Technologies, Inc. (Farmington). European operations route via Nitto Belgium NV (Genk), Nitto Advanced Film Gronau GmbH (AFG), and Nitto Advanced Nonwoven Ascania GmbH (Aschersleben). Additional Asian facilities involve Kaohsiung and Taichung sites in Taiwan, Shanghai Songjiang, Shenzhen Nitto Optical, Nitto Denko Fine Circuit Technology (Shenzhen), Nitto Material Technology (Chengdu), Korea Nitto Optical Co., Ltd. (Pyeongtaek), and the Nitto Denko Asia Technical Centre Pte. Ltd. (Singapore).
Goodwill Concentration and Audit Metrics
Consolidated Goodwill registered at $428.73 million (64,125 million JPY). Of this total, $354.60 million (53,037 million JPY)—or 82.7%—is singularly concentrated in Nitto Advanced Film Gronau GmbH (AFG). Following a FY2025 cycle that saw impairments of $34.76 million (5,199 million JPY) at Nitto Bend Technologies, $22.05 million (3,298 million JPY) at AFG, and $12.34 million (1,846 million JPY) targeting aborted plastic optical fiber projects, AFG’s fair value was defended this cycle using tightened Discounted Cash Flow assumptions: the pre-tax discount rate was adjusted to 7.8% (from 7.5%), and the terminal growth rate was modeled at 1.1% (from 1.4%).
ESG Supply Chain Variables
Environmental adherence benchmarks report total GHG output of 361 kton (Scope 1: 272 kton, Scope 2: 89 kton), easily beating the 470 kton target. Scope 3 emissions measured 1,391 kton. Waste plastic recycling cleared 54% against a 50% target, while sustainable material sourcing hit 24% (against a 20% benchmark, tracking toward 30% by 2030). The entity mandates 100% renewable power adoption by 2035 via Corporate PPAs.
HDIN Institutional Verdict and Forward Projections
Nitto Denko Corporation operates as a specialized materials monopoly disguised as a traditional chemical manufacturer, utilizing its "Sanshin" (Three New) Activity matrix to commercialize eight core technologies. The R&D division deploys 1,756 personnel (1,122 localized at the parent company), consuming $321.1 million (48,025 million JPY) to output a 40% "New Product Ratio", decisively beating the 35% target. Strategic execution earned the firm its 13th selection as a Clarivate Top 100 Global Innovator. Commercial joint developments involve IBM (semiconductor packaging), Numat Technologies (MOF), and Aqualung Carbon Capture. Licensing assets remain robust, following a historical out-licensing pact with Bristol-Myers Squibb, while Phase 1 trials for an intractable cancer drug are completed and prepped for monetization alongside the NittoPhase™ synthesis materials scale-up.
However, operational agility faces direct systemic tests. Governance structures—transitioning from a 10-member board (40% independent) to a 9-member board (44.4% independent)—are tasked with closing human capital gaps. Female officer representation stands at 20.0% (3 of 15) with proposals advancing it to 21.43%. Female leader ratios plateaued at 22% (missing the 24% target), and the internal "Challenge Ratio" logged 58% (against a 70% target, charting toward 85% by 2030), though corporate engagement scored an 81 (target 78). Executive remuneration enforces a 30% fixed, 60% short-term, 10% restricted equity split scaling between 0-150% payout tied to OP, ROE, and ESG goals.
Looking ahead to the "Nitto RISE 2028" strategic frame, management insists on an Operating Profit target of $1,470.9 million (220.0 billion JPY) by FY2028, expanding to $\ge$ $1,604.6 million (240.0 billion JPY) by FY2030, anchored by an enduring $\ge$ 20% OP margin. The paramount hurdle remains capital efficiency. A commitment to hit a 14% ROE by 2028 and $\ge$ 15% by 2030 requires aggressive, continuous deflation of the equity base. HDIN rates the execution of the zero-liquid discharge membranes and US/Japan nucleic acid scaling as fundamentally sound, provided that EcoVadis-audited supply chains can buffer external shocks originating from Red Sea transit points and US market tariffs.
Presentation Download & Video Access:
Presentation Download: Click the PDF download link under 'Related Topics' to access the full institutional presentation of this report.
Video Link: Click this link to watch the HDIN analyst briefing on YouTube.
About HDIN Research:
HDIN Research is a premier global market intelligence and strategic advisory firm specializing in institutional-grade financial analysis, supply chain audits, and macroeconomic forecasting. Our dedicated sector analysts deliver actionable, data-driven insights tailored for private equity, hedge funds, and corporate strategy teams. Visit us at http://www.hdinresearch.com.
2026 AI Transparency Footer:
"This intelligence report was authored by HDIN Research analysts following a rigorous audit of official corporate filings. AI was utilized for massive-scale data synthesis and structural drafting, ensuring 100% inclusion of reported data points. All strategic insights, financial modeling, and final verdicts were verified by our editorial board to ensure professional accuracy and compliance with 2026 Google Search E-E-A-T standards."
* Margin Execution vs. Equity Drag: Consolidated Operating Profit (OP) margin reached an elite 17.9%, exceeding the 17.0% target. However, Return on Equity (ROE) underperformed at 12.2% against a 15.0% mandate, driven by a 79.6% equity ratio, forcing $403.1 million in share buybacks.
* Geopolitical CapEx Hedging: To mitigate Red Sea maritime chokepoints and US tariff exposures, $500.05 million in off-balance-sheet commitments were deployed, including a $306.0 million facility scaling in Vietnam and $333.4 million localized at the Toyohashi plant.
* Supply Chain De-risking: Inventory obsolescence write-downs plummeted 77.5% YoY to just $8.47 million, while former single-client revenue concentration risk ($714.7 million in FY2024) was eradicated, with zero downstream customers exceeding a 10% revenue share.
Figure Nitto Denko Corporation: FY2025 Strategic & Financial Architecture
Segmental Realities, Margin Dynamics, and Capital StructureFor the fiscal year ending March 31, 2026, Nitto Denko Corporation [TSE: 6988] recorded consolidated revenue of $6,874.2 million (1,028,171 million JPY), representing +1.4% YoY top-line growth at a fixed conversion rate of 1 USD = 149.5686 JPY. Consolidated OP contracted by 1.1% YoY to $1,227.6 million (183.6 billion JPY). The net income settled at $892.6 million. Overall, products designated under the "Global Niche Top" (GNT) and "Area Niche Top" (ANT) framework accounted for 49.7% of total sales, directly aligning with management’s 50% target.
Segment-Level Financial Decomposition
* Optronics: Revenue contracted 2.6% YoY to $3,528.9 million (527,812 million JPY). OP dropped 13.4% YoY to $1,002.0 million (149,871 million JPY), retaining a 28.4% OP margin. R&D allocation: $111.0 million (16,602 million JPY).
* Industrial Tape: Revenue expanded 4.2% YoY to $2,451.1 million (366,607 million JPY). OP outpaced the top line, advancing 12.6% YoY to $345.4 million (51,662 million JPY), producing a 14.1% OP margin. R&D allocation: $55.7 million (8,331 million JPY).
* Human Life: Revenue advanced 8.5% YoY to $960.8 million (143,702 million JPY). Operating losses narrowed to -$33.7 million (-5,041 million JPY) from a prior loss of -$78.3 million. R&D allocation: $43.5 million (6,503 million JPY).
* Others: Revenue posted at $0.07 million (11 million JPY) with OP at -$46.6 million (-6,971 million JPY). R&D allocation: $36.1 million (5,403 million JPY). Unallocated corporate R&D expenditures consumed $74.8 million (11,184 million JPY).
Capital Allocation and Liquidity
Operating Cash Flow (OCF) generated $1,284.9 million, offset by Net Cash used in Investing Activities (ICF) of -$718.3 million, yielding a Free Cash Flow (FCF) of $566.6 million. CapEx outflows for PPE and intangibles strictly consumed $645.9 million.
* Leverage: Total Assets equaled $9,639.4 million against Total Equity of $7,675.6 million. Cash and cash equivalents hovered at $2,405.6 million. The balance sheet functions with zero short-term borrowings, limiting interest-bearing debt exclusively to lease liabilities of $211.6 million. Interest coverage ratios sit at 185.5x.
* Shareholder Returns: Dividend distributions commanded $265.2 million (42.5% non-consolidated payout ratio), adhering to a Dividend on Equity (DOE) target $\ge$ 4%. Management executed $403.1 million in buybacks, completing a $949.4 million (142 billion JPY) three-year program, before authorizing an additional $334.3 million (50 billion JPY) repurchase tranche in March 2026. The combined payout equals a 75% return on net income, surpassing the 60% total return ratio policy.
Working Capital and Inventory Integrity
The Cash Conversion Cycle (CCC) settled at 113 days. Trade and Other Receivables absorbed $1,550.3 million (DSO: 82 days), while Trade and Other Payables utilized $692.7 million (DPO: 59 days).
Inventory expanded +$100 million YoY to $1,055.5 million (157,870 million JPY), measured against COGS of $4,261.6 million (637,408 million JPY), generating a DIO of 90 days. Composition explicitly reflects: Merchandise and Finished Goods at $320.57 million (30.4%), Work-in-Progress at $407.39 million (38.6%), and Raw Materials and Supplies at $327.53 million (31.0%). FY2026 inventory valuation write-downs contracted to $8.47 million (1,267 million JPY) from $37.69 million (5,637 million JPY) in the prior cycle.
Table 1: Foreign Exchange & Derivatives
| Metric | USD (Millions) | JPY (Millions) |
| Consolidated OP Impact (150.2 JPY/USD avg) | ($54.16) | (8,100) |
| Sensitivity (1% JPY Appreciation Impact on PBT) | ($7.52) | (1,124) |
| Non-Hedge Forward Notional Value (Total) | $774.99 | 115,915 |
| — "Sell USD" Positions | $644.35 | 96,374 |
| — "Sell USD" Positions Fair Value | ($1.80) | (269) |
Table 2: Extraordinary & Non-Operating Items
| Category | Item | USD (Millions) | JPY (Millions) |
| Income | Asset Disposal Gains | $20.94 | 3,132 |
| Scrap Income | $17.10 | 2,558 | |
| Total Other Income | $84.05 | 12,571 | |
| Expenses | Disposal Losses | ($15.86) | (2,372) |
| Standard Impairment Losses | ($31.54) | (4,717) | |
| Non-Operating FX Loss | ($25.81) | (3,861) | |
| Total Other Expenses | ($102.77) | (15,371) | |
| Finance | Finance Income | $21.78 | 3,258 |
| Finance Costs | ($13.67) | (2,045) |
Table 3: Taxation & Pension Metrics
| Metric | USD (Millions) | JPY (Millions) |
| Effective Tax Rate | 27.8% | N/A |
| Statutory Tax Rate | 30.3% | N/A |
| Net Deferred Tax Asset (DTA) | $48.90 | 7,314 |
| Defined Benefit Obligation (PBO) | $757.44 | 113,289 |
| Plan Assets | $752.32 | 112,523 |
| Pension Actuarial Gain (Rate Hike) | $75.68 | 11,320 |
Infrastructure Layout, Intangibles, and Regional Dependencies
Overseas revenue exceeds 80% of total operations. By geography, Asia-Oceania captured $4,659.9 million (696,991 million JPY)—with direct sales in China specifically accounting for $2,808.4 million (420,049 million JPY). Japan contributed $953.8 million (142,657 million JPY), EMEA delivered $656.5 million (98,196 million JPY), the Americas posted $569.0 million (85,108 million JPY), and Others accounted for $34.9 million (5,218 million JPY).
Manufacturing Facilities and Off-Balance CapEx Approvals
Nitto Denko Corporation enforces a $500.05 million (74,792 million JPY) off-balance-sheet commitment targeting immediate expansion of regional footprints. Domestic scaling includes $333.4 million (49.86 billion JPY) at the Toyohashi Plant (Aichi) for completion by December 2028 (with $260.8 million / 39 billion JPY specifically allocated to electrical release tapes), $272.8 million (40.81 billion JPY) at the Kameyama Plant (Mie) slated for March 2029, and $225.4 million (33.71 billion JPY) at the Onomichi Plant (Hiroshima) by April 2029. In Asia-Oceania, a combined $306.0 million (45.75 billion JPY) targets the Ho Chi Minh and Bac Ninh facilities via Nitto Denko Vietnam Co., Ltd. and Nitto Vietnam Co., Ltd.
The physical production perimeter includes the Tohoku Plant (Miyagi), Kanto Plant (Saitama), Shiga Plant, Nitto Shinko Corp. (Fukui), and the "inovas" R&D facility at the Ibaraki Plant (Osaka). US operations operate through Kinovate Life Sciences, Inc. (Carlsbad), Nitto Denko Avecia Inc. (Milford), Nitto, Inc. (Teaneck), Nitto Denko Technical Corporation (Oceanside), Nitto BioPharma, Inc. (San Diego), and Nitto Bend Technologies, Inc. (Farmington). European operations route via Nitto Belgium NV (Genk), Nitto Advanced Film Gronau GmbH (AFG), and Nitto Advanced Nonwoven Ascania GmbH (Aschersleben). Additional Asian facilities involve Kaohsiung and Taichung sites in Taiwan, Shanghai Songjiang, Shenzhen Nitto Optical, Nitto Denko Fine Circuit Technology (Shenzhen), Nitto Material Technology (Chengdu), Korea Nitto Optical Co., Ltd. (Pyeongtaek), and the Nitto Denko Asia Technical Centre Pte. Ltd. (Singapore).
Goodwill Concentration and Audit Metrics
Consolidated Goodwill registered at $428.73 million (64,125 million JPY). Of this total, $354.60 million (53,037 million JPY)—or 82.7%—is singularly concentrated in Nitto Advanced Film Gronau GmbH (AFG). Following a FY2025 cycle that saw impairments of $34.76 million (5,199 million JPY) at Nitto Bend Technologies, $22.05 million (3,298 million JPY) at AFG, and $12.34 million (1,846 million JPY) targeting aborted plastic optical fiber projects, AFG’s fair value was defended this cycle using tightened Discounted Cash Flow assumptions: the pre-tax discount rate was adjusted to 7.8% (from 7.5%), and the terminal growth rate was modeled at 1.1% (from 1.4%).
ESG Supply Chain Variables
Environmental adherence benchmarks report total GHG output of 361 kton (Scope 1: 272 kton, Scope 2: 89 kton), easily beating the 470 kton target. Scope 3 emissions measured 1,391 kton. Waste plastic recycling cleared 54% against a 50% target, while sustainable material sourcing hit 24% (against a 20% benchmark, tracking toward 30% by 2030). The entity mandates 100% renewable power adoption by 2035 via Corporate PPAs.
HDIN Institutional Verdict and Forward Projections
Nitto Denko Corporation operates as a specialized materials monopoly disguised as a traditional chemical manufacturer, utilizing its "Sanshin" (Three New) Activity matrix to commercialize eight core technologies. The R&D division deploys 1,756 personnel (1,122 localized at the parent company), consuming $321.1 million (48,025 million JPY) to output a 40% "New Product Ratio", decisively beating the 35% target. Strategic execution earned the firm its 13th selection as a Clarivate Top 100 Global Innovator. Commercial joint developments involve IBM (semiconductor packaging), Numat Technologies (MOF), and Aqualung Carbon Capture. Licensing assets remain robust, following a historical out-licensing pact with Bristol-Myers Squibb, while Phase 1 trials for an intractable cancer drug are completed and prepped for monetization alongside the NittoPhase™ synthesis materials scale-up.
However, operational agility faces direct systemic tests. Governance structures—transitioning from a 10-member board (40% independent) to a 9-member board (44.4% independent)—are tasked with closing human capital gaps. Female officer representation stands at 20.0% (3 of 15) with proposals advancing it to 21.43%. Female leader ratios plateaued at 22% (missing the 24% target), and the internal "Challenge Ratio" logged 58% (against a 70% target, charting toward 85% by 2030), though corporate engagement scored an 81 (target 78). Executive remuneration enforces a 30% fixed, 60% short-term, 10% restricted equity split scaling between 0-150% payout tied to OP, ROE, and ESG goals.
Looking ahead to the "Nitto RISE 2028" strategic frame, management insists on an Operating Profit target of $1,470.9 million (220.0 billion JPY) by FY2028, expanding to $\ge$ $1,604.6 million (240.0 billion JPY) by FY2030, anchored by an enduring $\ge$ 20% OP margin. The paramount hurdle remains capital efficiency. A commitment to hit a 14% ROE by 2028 and $\ge$ 15% by 2030 requires aggressive, continuous deflation of the equity base. HDIN rates the execution of the zero-liquid discharge membranes and US/Japan nucleic acid scaling as fundamentally sound, provided that EcoVadis-audited supply chains can buffer external shocks originating from Red Sea transit points and US market tariffs.
Presentation Download & Video Access:
Presentation Download: Click the PDF download link under 'Related Topics' to access the full institutional presentation of this report.
Video Link: Click this link to watch the HDIN analyst briefing on YouTube.
About HDIN Research:
HDIN Research is a premier global market intelligence and strategic advisory firm specializing in institutional-grade financial analysis, supply chain audits, and macroeconomic forecasting. Our dedicated sector analysts deliver actionable, data-driven insights tailored for private equity, hedge funds, and corporate strategy teams. Visit us at http://www.hdinresearch.com.
2026 AI Transparency Footer:
"This intelligence report was authored by HDIN Research analysts following a rigorous audit of official corporate filings. AI was utilized for massive-scale data synthesis and structural drafting, ensuring 100% inclusion of reported data points. All strategic insights, financial modeling, and final verdicts were verified by our editorial board to ensure professional accuracy and compliance with 2026 Google Search E-E-A-T standards."