Daicel Corporation: 72.8B JPY Capex Realignment Near European and Asian Facilities as 147-Day Inventory Cycle Signals Negative 4.9B JPY Free Cash Flow
Date : 2026-06-19
Reading : 124
HDIN Executive Takeaways
* FY2026 ROIC collapsed to 4.2% against a 9.3% target, triggered by a 32.4B JPY impairment at the German TAPG plant amid delayed EU packaging regulations.
* Capital efficiency deteriorated as 174.5B JPY in stranded inventory produced a 147-day cycle, pushing free cash flow to a negative 4.9B JPY deficit.
* Despite operating income contracting 31.0%, management mandated a 60% total return ratio, liquidating 20.4B JPY in cross-shareholdings to execute a 160B JPY return program.
Figure HDIN RESEARCH COMPREHENSIVE CORPORATE AUDIT: DAICEL CORPORATION (2026)
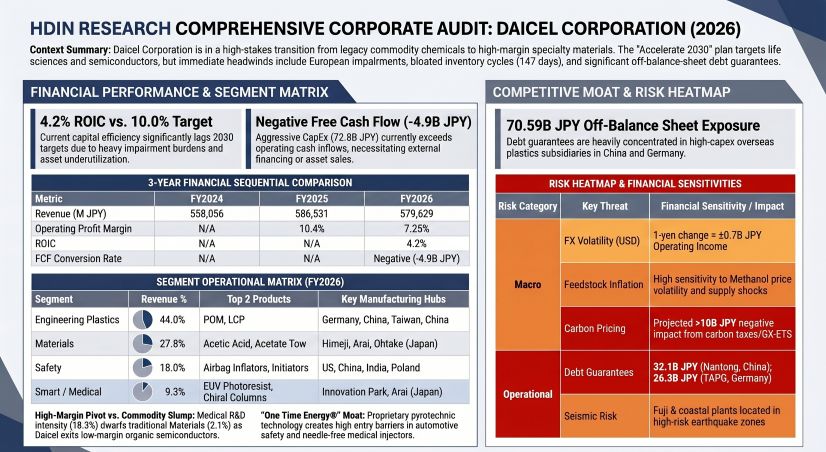 Segmental Realities and Margin Compression
Daicel Corporation [TYO: 4202] reported consolidated external sales of 574.1B JPY on total production output valued at 508.5B JPY for FY2026. Because the enterprise operates strictly on a make-to-stock production model, no forward order backlog is recorded. Instead, short-term demand visibility is evidenced by a 66.8% contraction in contract liabilities, which fell from 5,104M JPY in FY2025 to 1,694M JPY in FY2026, indicating advance customer funding has been recognized without replenishment. Exchange rate sensitivities dictate that a 1-JPY fluctuation against the USD alters consolidated annual revenue by 2.3B JPY and operating income by 0.7B JPY.
Consolidated profitability metrics demonstrate severe contraction. Total FY2026 EBITDA reached 85,400M JPY, missing the management target of 136,000M JPY.
Table 1: Consolidated Income Trajectory (Millions JPY)
Performance across the portfolio reveals margin compression in core volume-driven chemical segments, offset by pricing power in specialized medical and engineering applications.
Table 2: FY2026 Segmental Operations & Margin Dynamics
Geographically, overseas sales represent 65.6% of total revenue. Regional distribution totals 199,227M JPY in Japan (34.3%), 132,852M JPY in Rest of Asia (22.9%), 126,130M JPY in Greater China (21.8%), and 121,418M JPY in the Americas and Europe (21.0%).
Infrastructure Layout and Regional Moats
Daicel deployed 72.8B JPY in total capital expenditures during FY2026. The capital injection was heavily allocated to Engineering Plastics (36.3B JPY), Materials (20.5B JPY), Safety (9.1B JPY), and Smart materials (1.9B JPY). The physical manufacturing architecture utilizes upstream commodity assets to subsidize downstream high-margin applications. The subsidiary Kyodo Sakusan Co., Ltd. processes carbon monoxide and methanol into acetic acid, which feeds the Himeji Production Sector (Aboshi, Hirohata, Harima), Arai Plant, and Ohtake Plant. Polyplastics (now absorbing into HPP Holdings) operates the Fuji Plant in Japan, Polyplastics Asia Pacific in Malaysia, and Polyplastics Taiwan Co., Ltd. Safety production relies on Daicel Safety Systems Americas (DSSA) in the US, alongside facilities in Jiangsu, Thailand, India, and Poland.
Enterprise R&D expenditure totaled 25,559M JPY, executed via centralized hubs including the Innovation Park (Hyogo), Biomass Innovation Center, Inorganic Composite Packaging Research Institute, the newly established Business Accelerator Center, and the Digital Strategy Promotion Center operating the DAICEL CHAT V2 platform.
FY2026 R&D Capital Intensity by Segment
* Medical/Healthcare: 2,971M JPY (18.31% of segment sales) driving the Daicel Injector P1 SC and BELLOCEA BS7.
* Smart Materials: 4,018M JPY (10.64% of segment sales).
* Safety: 7,601M JPY (7.30% of segment sales) advancing One Time Energy and DAISI technologies.
* Engineering Plastics: 7,310M JPY (2.87% of segment sales).
* Materials: 3,438M JPY (2.13% of segment sales).
* Corporate R&D focuses on the Solar Super-Reduction carbon-negative technology.
Daicel carries 70.59B JPY in off-balance-sheet debt guarantees, concentrated in overseas engineering plastics subsidiaries: 32.11B JPY for DP Engineering Plastics (Nantong) Co., Ltd., 26.32B JPY for TOPAS Advanced Polymers GmbH (TAPG), and 9.91B JPY for Polyplastics Taiwan Co., Ltd. A guarantee reservation of 85M JPY exists for Hirohata Terminal Co., Ltd. Unexpired operating lease commitments total 5.12B JPY (365M JPY due within one year; 4.75B JPY due after one year). The company also holds 70B JPY in unsecured corporate bonds.
Transition risk analysis identifies over 10B JPY in potential internal cost impacts from carbon taxation, alongside over 10B JPY in upstream supplier pass-through costs. Scope 1 and 2 emissions expanded 1.9% YoY to 2.31M t-CO2e, regressing from the 2018 baseline of 2.32M t-CO2e despite a 50% reduction target for 2030. Carbon-related CapEx included 2,924M JPY for the CO Plant Coal Gasification Project at the Aboshi Plant and 1,084M JPY for Ohtake Plant boiler enhancements. Asset Retirement Obligations (ARO) strictly for asbestos removal slightly expanded from 1,205M JPY to 1,222M JPY.
HDIN Institutional Verdict
Daicel's FY2026 balance sheet highlights severe capital inefficiencies that threaten to undermine its "Accelerate 2030" execution. Asset turnover deteriorated from 0.72x to 0.69x, forcing Return on Equity (ROE) down from 17.06% in FY2024 to 13.76% in FY2025, and ultimately to 2.85% in FY2026 against a 2030 target of 15.0% (and a 2028 target of 12.0%). Return on Invested Capital (ROIC) stands at 4.2%, missing the 9.3% mid-term target and remaining below the 2028 threshold of 7.0% and the 2030 goal of 10.0%.
Working capital is currently bottlenecked by 174.5B JPY in ending inventory against 433.3B JPY in COGS, creating a 147-day cycle that misses management's 90-day target. Raw materials account for 68.3B JPY (57 days), and finished goods account for 83.8B JPY (70 days). Accounts receivable represent 117.3B JPY (73 days).
Cash generation metrics confirm operational strain. Operating Cash Flow (OCF) dropped by 25.5B JPY YoY to 67.8B JPY. The 6.6x OCF-to-Net Income ratio is artificially elevated by 43.3B JPY in depreciation and 32.8B JPY in impairment add-backs. Daicel recognized a 32.4B JPY write-down on TAPG in Germany applying a 9.8% discount rate due to EU Packaging and Packaging Waste Regulations (PPWR) delays, alongside a 419M JPY impairment on DSSA tied to US-China tariffs. Consequently, enterprise goodwill fell from 66M JPY to 52M JPY. Capital expenditures of 72.8B JPY drove Free Cash Flow (FCF) negative to -4.9B JPY, failing to organically cover 15.9B JPY in dividend obligations.
Solvency is maintained via a cash position of 66.8B JPY against 312.2B JPY in interest-bearing debt and 355.5B JPY in equity, yielding a Net D/E ratio of 0.69x. The current ratio stands at 2.04x (403.1B JPY current assets / 197.5B JPY current liabilities). Operating income easily covers the 3.1B JPY interest expense at 13.1x.
Management's capital allocation plan projects a 560B JPY pool (540B JPY from OCF, 20B JPY from share sales) for the 2026-2030 window, distributing 300B JPY to growth, 100B JPY to maintenance, and 160B JPY to shareholder returns. Immediate execution included raising the target return ratio to 60%, targeting a DOE of 5%, executing a 13.7B JPY buyback, and liquidating 20.4B JPY by exiting 5 out of 6 listed cross-shareholdings. Executive compensation aligns with these operational targets, combining a 55% base salary, a 30% bonus (weighted 40% revenue, 40% EBITDA, 20% ROIC, with a +/- 20% ESG adjustment), and 15% restricted stock under a 30-year lock-up, overseen by an 11-member board featuring 6 independent directors and a 20% female representation ratio (3 of 15 total executives).
Presentation Download & Video Access:
Presentation Download: Click the PDF download link under 'Related Topics' to access the full institutional presentation of this report.
Video Link: Click this link to watch the HDIN analyst briefing on YouTube.
About HDIN Research:
HDIN Research is a premier global market intelligence and strategic advisory firm specializing in institutional-grade financial analysis, supply chain audits, and macroeconomic forecasting. Our dedicated sector analysts deliver actionable, data-driven insights tailored for private equity, hedge funds, and corporate strategy teams. Visit us at http://www.hdinresearch.com.
2026 AI Transparency Footer:
"This intelligence report was authored by HDIN Research analysts following a rigorous audit of official corporate filings. AI was utilized for massive-scale data synthesis and structural drafting, ensuring 100% inclusion of reported data points. All strategic insights, financial modeling, and final verdicts were verified by our editorial board to ensure professional accuracy and compliance with 2026 Google Search E-E-A-T standards."
* FY2026 ROIC collapsed to 4.2% against a 9.3% target, triggered by a 32.4B JPY impairment at the German TAPG plant amid delayed EU packaging regulations.
* Capital efficiency deteriorated as 174.5B JPY in stranded inventory produced a 147-day cycle, pushing free cash flow to a negative 4.9B JPY deficit.
* Despite operating income contracting 31.0%, management mandated a 60% total return ratio, liquidating 20.4B JPY in cross-shareholdings to execute a 160B JPY return program.
Figure HDIN RESEARCH COMPREHENSIVE CORPORATE AUDIT: DAICEL CORPORATION (2026)
Segmental Realities and Margin CompressionDaicel Corporation [TYO: 4202] reported consolidated external sales of 574.1B JPY on total production output valued at 508.5B JPY for FY2026. Because the enterprise operates strictly on a make-to-stock production model, no forward order backlog is recorded. Instead, short-term demand visibility is evidenced by a 66.8% contraction in contract liabilities, which fell from 5,104M JPY in FY2025 to 1,694M JPY in FY2026, indicating advance customer funding has been recognized without replenishment. Exchange rate sensitivities dictate that a 1-JPY fluctuation against the USD alters consolidated annual revenue by 2.3B JPY and operating income by 0.7B JPY.
Consolidated profitability metrics demonstrate severe contraction. Total FY2026 EBITDA reached 85,400M JPY, missing the management target of 136,000M JPY.
Table 1: Consolidated Income Trajectory (Millions JPY)
| Metric | FY2024 | FY2025 | FY2026 | YoY (FY25–FY26) |
|---|---|---|---|---|
| Revenue | 558,056 | 586,531 | 579,629 | -1.2% |
| Operating Income (OP) | N/A | 61,011 | 42,069 | -31.0% |
| Net Income (NI) | 55,834 | 49,480 | 10,180 | -79.4% |
Performance across the portfolio reveals margin compression in core volume-driven chemical segments, offset by pricing power in specialized medical and engineering applications.
Table 2: FY2026 Segmental Operations & Margin Dynamics
| Metric | Medical/Healthcare | Smart Materials | Safety | Materials | Engineering Plastics |
|---|---|---|---|---|---|
| Revenue (M JPY) | 16,227 | 37,746 | 104,164 | 161,324 | 254,718 |
| YoY Revenue Growth | +12.4% | +1.2% | +6.7% | -12.0% | +2.7% |
| Operating Profit (M JPY) | 427 | 536 | 6,095 | 14,953 | 19,151 |
| YoY OP Growth | +63.6% | Turnaround | +55.0% | -49.5% | -29.1% |
| FY25 Margin | 1.81% | -2.09% | 4.03% | 16.15% | 10.89% |
| FY26 Margin | 2.63% | 1.42% | 5.85% | 9.27% | 7.52% |
Geographically, overseas sales represent 65.6% of total revenue. Regional distribution totals 199,227M JPY in Japan (34.3%), 132,852M JPY in Rest of Asia (22.9%), 126,130M JPY in Greater China (21.8%), and 121,418M JPY in the Americas and Europe (21.0%).
Infrastructure Layout and Regional Moats
Daicel deployed 72.8B JPY in total capital expenditures during FY2026. The capital injection was heavily allocated to Engineering Plastics (36.3B JPY), Materials (20.5B JPY), Safety (9.1B JPY), and Smart materials (1.9B JPY). The physical manufacturing architecture utilizes upstream commodity assets to subsidize downstream high-margin applications. The subsidiary Kyodo Sakusan Co., Ltd. processes carbon monoxide and methanol into acetic acid, which feeds the Himeji Production Sector (Aboshi, Hirohata, Harima), Arai Plant, and Ohtake Plant. Polyplastics (now absorbing into HPP Holdings) operates the Fuji Plant in Japan, Polyplastics Asia Pacific in Malaysia, and Polyplastics Taiwan Co., Ltd. Safety production relies on Daicel Safety Systems Americas (DSSA) in the US, alongside facilities in Jiangsu, Thailand, India, and Poland.
Enterprise R&D expenditure totaled 25,559M JPY, executed via centralized hubs including the Innovation Park (Hyogo), Biomass Innovation Center, Inorganic Composite Packaging Research Institute, the newly established Business Accelerator Center, and the Digital Strategy Promotion Center operating the DAICEL CHAT V2 platform.
FY2026 R&D Capital Intensity by Segment
* Medical/Healthcare: 2,971M JPY (18.31% of segment sales) driving the Daicel Injector P1 SC and BELLOCEA BS7.
* Smart Materials: 4,018M JPY (10.64% of segment sales).
* Safety: 7,601M JPY (7.30% of segment sales) advancing One Time Energy and DAISI technologies.
* Engineering Plastics: 7,310M JPY (2.87% of segment sales).
* Materials: 3,438M JPY (2.13% of segment sales).
* Corporate R&D focuses on the Solar Super-Reduction carbon-negative technology.
Daicel carries 70.59B JPY in off-balance-sheet debt guarantees, concentrated in overseas engineering plastics subsidiaries: 32.11B JPY for DP Engineering Plastics (Nantong) Co., Ltd., 26.32B JPY for TOPAS Advanced Polymers GmbH (TAPG), and 9.91B JPY for Polyplastics Taiwan Co., Ltd. A guarantee reservation of 85M JPY exists for Hirohata Terminal Co., Ltd. Unexpired operating lease commitments total 5.12B JPY (365M JPY due within one year; 4.75B JPY due after one year). The company also holds 70B JPY in unsecured corporate bonds.
Transition risk analysis identifies over 10B JPY in potential internal cost impacts from carbon taxation, alongside over 10B JPY in upstream supplier pass-through costs. Scope 1 and 2 emissions expanded 1.9% YoY to 2.31M t-CO2e, regressing from the 2018 baseline of 2.32M t-CO2e despite a 50% reduction target for 2030. Carbon-related CapEx included 2,924M JPY for the CO Plant Coal Gasification Project at the Aboshi Plant and 1,084M JPY for Ohtake Plant boiler enhancements. Asset Retirement Obligations (ARO) strictly for asbestos removal slightly expanded from 1,205M JPY to 1,222M JPY.
HDIN Institutional Verdict
Daicel's FY2026 balance sheet highlights severe capital inefficiencies that threaten to undermine its "Accelerate 2030" execution. Asset turnover deteriorated from 0.72x to 0.69x, forcing Return on Equity (ROE) down from 17.06% in FY2024 to 13.76% in FY2025, and ultimately to 2.85% in FY2026 against a 2030 target of 15.0% (and a 2028 target of 12.0%). Return on Invested Capital (ROIC) stands at 4.2%, missing the 9.3% mid-term target and remaining below the 2028 threshold of 7.0% and the 2030 goal of 10.0%.
Working capital is currently bottlenecked by 174.5B JPY in ending inventory against 433.3B JPY in COGS, creating a 147-day cycle that misses management's 90-day target. Raw materials account for 68.3B JPY (57 days), and finished goods account for 83.8B JPY (70 days). Accounts receivable represent 117.3B JPY (73 days).
Cash generation metrics confirm operational strain. Operating Cash Flow (OCF) dropped by 25.5B JPY YoY to 67.8B JPY. The 6.6x OCF-to-Net Income ratio is artificially elevated by 43.3B JPY in depreciation and 32.8B JPY in impairment add-backs. Daicel recognized a 32.4B JPY write-down on TAPG in Germany applying a 9.8% discount rate due to EU Packaging and Packaging Waste Regulations (PPWR) delays, alongside a 419M JPY impairment on DSSA tied to US-China tariffs. Consequently, enterprise goodwill fell from 66M JPY to 52M JPY. Capital expenditures of 72.8B JPY drove Free Cash Flow (FCF) negative to -4.9B JPY, failing to organically cover 15.9B JPY in dividend obligations.
Solvency is maintained via a cash position of 66.8B JPY against 312.2B JPY in interest-bearing debt and 355.5B JPY in equity, yielding a Net D/E ratio of 0.69x. The current ratio stands at 2.04x (403.1B JPY current assets / 197.5B JPY current liabilities). Operating income easily covers the 3.1B JPY interest expense at 13.1x.
Management's capital allocation plan projects a 560B JPY pool (540B JPY from OCF, 20B JPY from share sales) for the 2026-2030 window, distributing 300B JPY to growth, 100B JPY to maintenance, and 160B JPY to shareholder returns. Immediate execution included raising the target return ratio to 60%, targeting a DOE of 5%, executing a 13.7B JPY buyback, and liquidating 20.4B JPY by exiting 5 out of 6 listed cross-shareholdings. Executive compensation aligns with these operational targets, combining a 55% base salary, a 30% bonus (weighted 40% revenue, 40% EBITDA, 20% ROIC, with a +/- 20% ESG adjustment), and 15% restricted stock under a 30-year lock-up, overseen by an 11-member board featuring 6 independent directors and a 20% female representation ratio (3 of 15 total executives).
Presentation Download & Video Access:
Presentation Download: Click the PDF download link under 'Related Topics' to access the full institutional presentation of this report.
Video Link: Click this link to watch the HDIN analyst briefing on YouTube.
About HDIN Research:
HDIN Research is a premier global market intelligence and strategic advisory firm specializing in institutional-grade financial analysis, supply chain audits, and macroeconomic forecasting. Our dedicated sector analysts deliver actionable, data-driven insights tailored for private equity, hedge funds, and corporate strategy teams. Visit us at http://www.hdinresearch.com.
2026 AI Transparency Footer:
"This intelligence report was authored by HDIN Research analysts following a rigorous audit of official corporate filings. AI was utilized for massive-scale data synthesis and structural drafting, ensuring 100% inclusion of reported data points. All strategic insights, financial modeling, and final verdicts were verified by our editorial board to ensure professional accuracy and compliance with 2026 Google Search E-E-A-T standards."