TDK Corporation: $2.5B CapEx AI Infrastructure Pivot Near Pan-Asian Hubs as 70 BPS Margin Expansion Signals Superior Profitability Quality
Date : 2026-06-20
Reading : 115
HDIN Executive Takeaways
* TDK Corporation captured a 70 bps operating margin expansion to 10.9%, absorbing $355.69 million in price erosion by scaling high-margin AI data center and renewable energy components.
* Despite 92.7% overseas exposure and a 55.0% revenue concentration in China, TDK secured upstream resilience via a $733.44 million supply chain advance payment and targeted asset localization across India and Thailand.
* Free cash flow contraction of 35.4% masks a deliberate $2,525.60 million CapEx deployment yielding a 7.5% ROIC, physically verifying TDK's transition from commoditized hardware to premium AI ecosystem solutions.
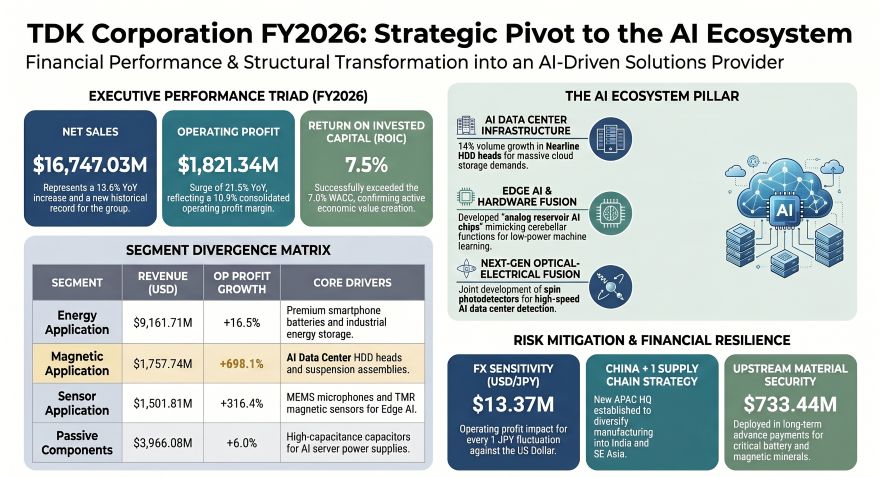
Figure TDK Corporation FY2026: Strategic Pivot to the Al Ecosystem
 Segmental Realities and Margin Compression
TDK Corporation executed a structural product mix optimization in FY2026, offsetting intense macroeconomic headwinds and a prolonged demand slump in the Battery Electric Vehicle (BEV) sector. Consolidated net sales expanded by 13.6% year-over-year to $16,747.03 million, while operating profit advanced by 21.5% to $1,821.34 million. This profitability engine was primarily driven by a 14% volume expansion in nearline HDD heads and a 35% volume expansion in suspension assemblies, funneling directly into global AI data center build-outs.
Table 1: FY2025 vs. FY2026 Core Financial Metrics
Operating Profit Waterfall Dynamics
* Net Operating Profit Increase: $322.42 million (JPY 48.2 billion)
* Volume & Mix Gain: $859.81 million (JPY 128.6 billion)
* Cost Reduction Benefit: $125.70 million (JPY 18.8 billion)
* Prior Structural Reform Benefit: $39.45 million (JPY 5.9 billion)
* Selling Price Reduction Headwind: -$355.69 million (JPY 53.2 billion)
* SG&A & R&D Expansion: -$298.19 million (JPY 44.6 billion)
Table 2: FY2026 Segmental Performance Matrix
To protect its operating cash flow against macroeconomic shocks, TDK Corporation deployed superior supply chain leverage. The firm deliberately expanded its raw material inventory from $1,011.83 million to $1,760.21 million, driving total inventory up 42.8%. To offset the combined $1,794.77 million liquidity outflow tied up in expanded receivables and inventory accumulation, TDK Corporation forced an aggressive supplier financing cycle, stretching trade payables to generate a $1,735.31 million cash inflow.
Table 3: Inventory & Trade Working Capital
Table 4: Operating Cash Flow (OCF) Impact & Provisions
Infrastructure Layout and Regional Moats
TDK Corporation operates a highly decentralized commercial matrix, anchored by a 92.7% overseas revenue ratio. However, production capacity remains deeply concentrated: 62% of global production output and 44% of tangible fixed assets are physically located in China. To hedge this geopolitical friction and execute a "China+1" diversification mandate, TDK Corporation established a new Asia-Pacific regional headquarters and expanded its physical asset base in India.
Table 5: Geographic Revenue Concentration
Table 6: Tangible Fixed Assets (TFA) Allocation
Operational Asset and Hub Layout
* China Hubs: Ningde, Dongguan, Xiamen (ATL Energy hubs); Hong Kong, China (SAE Magnetics); Zhuhai, Xiamen (Passives); Taiwan, China (Mechatronics)
* Rest of Asia Hubs: Thailand (Magnecomp Precision Technology); Philippines; India (Navitasys / ATL Battery Tech); APAC Regional Headquarters
* Japan Hubs: Akita (High-end Passive Components); Narita (Magnetic Applications); Asama Techno (Sensors); TDK-Lambda (Energy)
* Europe Hubs: Germany, Austria, Hungary (TDK Electronics); Germany (TDK-Micronas)
* Americas Hubs: USA (Headway Technologies; InvenSense)
Capital allocation across these regional hubs reflects a strict migration toward software-hardware fusion and decarbonization compliance. TDK Corporation directed $1,936.69 million toward R&D, commercializing integrated solutions including gaze-intention detection algorithms paired with ultra-compact full-color laser modules, spin photodetectors, and analog reservoir AI chips mimicking human cerebellar functions. To preempt the European Battery Passport and stringent ESG mandates, TDK Corporation strictly enforces Responsible Business Alliance (RBA) audits, securing SBTi certification while maintaining 61.2% global renewable energy adoption (100% in Japan) against a 21.95 million t-CO2 footprint heavily concentrated in Scope 1, 2, and 3 emissions (with Scope 3 acting as the primary contributor).
R&D, ESG, and Forex Metrics
* R&D Expenditure: $1,936.69 million (JPY 289.7 billion) [+14.2% YoY]; 11.6% of total sales
* Software Intangibles: $169.23 million (JPY 25.31 billion) [2-10 year amortization]
* Patents: $0.84 million (JPY 126 million)
* Other Technology Value: $32.81 million (JPY 4.90 billion)
* Human Capital as a Change Driver: 92% survey participation; Communication Score 71 points (Target 75 points)
* FX Dynamics: JPY +1.2% vs USD; JPY -6.7% vs EUR
* FX Net Impact: -$16.71 million (JPY 2.5 billion) on revenue; -$70.87 million (JPY 10.6 billion) on operating profit
* FX Sensitivity Baseline: $13.37 million (JPY 2 billion) OP variance per 1 JPY/USD fluctuation; $2.01 million (JPY 0.3 billion) OP variance per 1 JPY/EUR fluctuation
HDIN Institutional Verdict
Management is executing a disciplined architecture governed by the TDK Value Added (TVA) framework. By front-loading $18.72 million in passive component structural reforms in H1, the executive suite extracted a $39.45 million operational gain. The transition from commoditized electronic components to AI ecosystem solutions is physically verified by TDK Corporation's balance sheet structure: capitalized software intangibles reached $169.23 million, vastly outstripping traditional patent valuations of $0.84 million.
While the firm remains structurally exposed to the Democratic Republic of Congo for cobalt and China for heavy rare earths (dysprosium), its $733.44 million capital deployment for upstream advance payments establishes a formidable physical supply moat. The targeted ~35% dividend payout ratio ensures that free cash flows generated by this hardware scaling are systematically transferred to equity holders.
Table 7: Capital Expenditure & Restructuring
Table 9: Asset Valuation: High-Frequency Components
Table 10: Shareholder Returns Policy
Table 11: FY2027 Forward Guidance & Efficiency Targets
Presentation Download & Video Access:
- Presentation Download: Click the PDF download link under 'Related Topics' to access the full institutional presentation of this report.
- Video Link: Click this link to watch the HDIN analyst briefing on YouTube.
About HDIN Research:
HDIN Research is a premier global market intelligence and strategic advisory firm specializing in institutional-grade financial analysis, supply chain audits, and macroeconomic forecasting. Our dedicated sector analysts deliver actionable, data-driven insights tailored for private equity, hedge funds, and corporate strategy teams. Visit us at http://www.hdinresearch.com.
2026 AI Transparency Footer:
"This intelligence report was authored by HDIN Research analysts following a rigorous audit of official corporate filings. AI was utilized for massive-scale data synthesis and structural drafting, ensuring 100% inclusion of reported data points. All strategic insights, financial modeling, and final verdicts were verified by our editorial board to ensure professional accuracy and compliance with 2026 Google Search E-E-A-T standards."
* TDK Corporation captured a 70 bps operating margin expansion to 10.9%, absorbing $355.69 million in price erosion by scaling high-margin AI data center and renewable energy components.
* Despite 92.7% overseas exposure and a 55.0% revenue concentration in China, TDK secured upstream resilience via a $733.44 million supply chain advance payment and targeted asset localization across India and Thailand.
* Free cash flow contraction of 35.4% masks a deliberate $2,525.60 million CapEx deployment yielding a 7.5% ROIC, physically verifying TDK's transition from commoditized hardware to premium AI ecosystem solutions.
Figure TDK Corporation FY2026: Strategic Pivot to the Al Ecosystem
Segmental Realities and Margin CompressionTDK Corporation executed a structural product mix optimization in FY2026, offsetting intense macroeconomic headwinds and a prolonged demand slump in the Battery Electric Vehicle (BEV) sector. Consolidated net sales expanded by 13.6% year-over-year to $16,747.03 million, while operating profit advanced by 21.5% to $1,821.34 million. This profitability engine was primarily driven by a 14% volume expansion in nearline HDD heads and a 35% volume expansion in suspension assemblies, funneling directly into global AI data center build-outs.
Table 1: FY2025 vs. FY2026 Core Financial Metrics
| Metric | FY2025 (USD) | FY2026 (USD) | FY2026 (JPY) | Change (%) |
| Net Sales | $14,741.10M | $16,747.03M | 2,504.8B | +13.6% |
| Operating Profit | $1,498.92M | $1,821.34M | 272.4B | +21.5% |
| Operating Profit Margin | 10.2% | 10.9% | — | +70 bps |
| Operating Cash Flow | $2,980.83M | $3,394.24M | 507.7B | +13.9% |
| Investing Cash Flow | -$1,636.99M | -$2,525.60M | 377.8B | +54.3%* |
| Free Cash Flow | $1,343.84M | $868.64M | 129.9B | -35.4% |
Operating Profit Waterfall Dynamics
* Net Operating Profit Increase: $322.42 million (JPY 48.2 billion)
* Volume & Mix Gain: $859.81 million (JPY 128.6 billion)
* Cost Reduction Benefit: $125.70 million (JPY 18.8 billion)
* Prior Structural Reform Benefit: $39.45 million (JPY 5.9 billion)
* Selling Price Reduction Headwind: -$355.69 million (JPY 53.2 billion)
* SG&A & R&D Expansion: -$298.19 million (JPY 44.6 billion)
Table 2: FY2026 Segmental Performance Matrix
| Segment | Net Sales ($M) | Revenue YoY | Operating Profit ($M) | OPM | Key Drivers / Notes |
| Energy Application | $9,161.71 | +16.5% | $1,649.29 | 18.0% | Small/medium Li-ion batteries; 54.7% Revenue Share |
| Passive Components | $3,966.08 | +6.0% | $279.68 | 7.1% | Aluminum electrolytic & film capacitors |
| Magnetic Application | $1,757.74 | +17.6% | $180.19 | 10.3% | JPY 27.0B; +698.1% OP growth |
| Sensor Application | $1,501.81 | +18.6% | $138.72 | 9.2% | TMR sensors, MEMS, Motion sensors; JPY 20.7B |
| Other / Adjustments | $359.63 | -3.2% | -$426.54 | N/A | See breakdown below |
To protect its operating cash flow against macroeconomic shocks, TDK Corporation deployed superior supply chain leverage. The firm deliberately expanded its raw material inventory from $1,011.83 million to $1,760.21 million, driving total inventory up 42.8%. To offset the combined $1,794.77 million liquidity outflow tied up in expanded receivables and inventory accumulation, TDK Corporation forced an aggressive supplier financing cycle, stretching trade payables to generate a $1,735.31 million cash inflow.
Table 3: Inventory & Trade Working Capital
| Item | Current Value (USD Millions) | Prior Value (USD Millions) | Change / Note |
| Total Inventory | $3,914.24 | $2,741.47 | +42.8% |
| Raw Materials | $1,760.21 | $1,011.83 | JPY 263.2B |
| Finished Goods | $1,197.68 | — | JPY 179.1B |
| Inventory Valuation Loss | $34.81 | $17.18 | JPY 5.2B |
| Trade Receivables (Gross) | $5,236.43 | — | JPY 783.4B |
| Trade Receivables (Net) | $5,218.88 | $3,898.77 | +33.9% |
| Trade Payables | $4,725.12 | $2,624.23 | +80.1% |
| Allowance for Doubtful Accounts | $19.23 | $17.89 | +7.5% (0.36% Coverage) |
Table 4: Operating Cash Flow (OCF) Impact & Provisions
| Category | USD Impact (Millions) | JPY Impact (Billions) | Note |
| OCF Drag: Receivables | -$915.43 | -136.9 | Working Capital consumption |
| OCF Drag: Inventory | -$879.34 | -131.5 | Working Capital consumption |
| OCF Offset: Payables | +$1,735.31 | +259.5 | Inflow contribution |
| Warranty Provisions | $67.61 | 10.1 | -6.4% YoY shift |
Infrastructure Layout and Regional Moats
TDK Corporation operates a highly decentralized commercial matrix, anchored by a 92.7% overseas revenue ratio. However, production capacity remains deeply concentrated: 62% of global production output and 44% of tangible fixed assets are physically located in China. To hedge this geopolitical friction and execute a "China+1" diversification mandate, TDK Corporation established a new Asia-Pacific regional headquarters and expanded its physical asset base in India.
Table 5: Geographic Revenue Concentration
| Region | Revenue (USD Millions) | Revenue Share (%) | YoY Growth (%) |
| China (Mainland, HK, & Taiwan, China) | $9,213.34 | 55.0% | +15.6% |
| Rest of Asia | $4,123.30 | 24.6% | +18.0% |
| Japan | $1,226.59 | 7.3% | +5.2% |
| Europe | $1,211.49 | 7.2% | +3.4% |
| Americas | $972.25 | 5.8% | +3.8% |
Table 6: Tangible Fixed Assets (TFA) Allocation
| Region | Asset Value (USD Millions) | Asset Value (JPY Billions) | Global TFA Share |
| China | $3,598.92 | 538.3 | 44% (up from 38%) |
| India | $515.84 | 77.1 | — |
Operational Asset and Hub Layout
* China Hubs: Ningde, Dongguan, Xiamen (ATL Energy hubs); Hong Kong, China (SAE Magnetics); Zhuhai, Xiamen (Passives); Taiwan, China (Mechatronics)
* Rest of Asia Hubs: Thailand (Magnecomp Precision Technology); Philippines; India (Navitasys / ATL Battery Tech); APAC Regional Headquarters
* Japan Hubs: Akita (High-end Passive Components); Narita (Magnetic Applications); Asama Techno (Sensors); TDK-Lambda (Energy)
* Europe Hubs: Germany, Austria, Hungary (TDK Electronics); Germany (TDK-Micronas)
* Americas Hubs: USA (Headway Technologies; InvenSense)
Capital allocation across these regional hubs reflects a strict migration toward software-hardware fusion and decarbonization compliance. TDK Corporation directed $1,936.69 million toward R&D, commercializing integrated solutions including gaze-intention detection algorithms paired with ultra-compact full-color laser modules, spin photodetectors, and analog reservoir AI chips mimicking human cerebellar functions. To preempt the European Battery Passport and stringent ESG mandates, TDK Corporation strictly enforces Responsible Business Alliance (RBA) audits, securing SBTi certification while maintaining 61.2% global renewable energy adoption (100% in Japan) against a 21.95 million t-CO2 footprint heavily concentrated in Scope 1, 2, and 3 emissions (with Scope 3 acting as the primary contributor).
R&D, ESG, and Forex Metrics
* R&D Expenditure: $1,936.69 million (JPY 289.7 billion) [+14.2% YoY]; 11.6% of total sales
* Software Intangibles: $169.23 million (JPY 25.31 billion) [2-10 year amortization]
* Patents: $0.84 million (JPY 126 million)
* Other Technology Value: $32.81 million (JPY 4.90 billion)
* Human Capital as a Change Driver: 92% survey participation; Communication Score 71 points (Target 75 points)
* FX Dynamics: JPY +1.2% vs USD; JPY -6.7% vs EUR
* FX Net Impact: -$16.71 million (JPY 2.5 billion) on revenue; -$70.87 million (JPY 10.6 billion) on operating profit
* FX Sensitivity Baseline: $13.37 million (JPY 2 billion) OP variance per 1 JPY/USD fluctuation; $2.01 million (JPY 0.3 billion) OP variance per 1 JPY/EUR fluctuation
HDIN Institutional Verdict
Management is executing a disciplined architecture governed by the TDK Value Added (TVA) framework. By front-loading $18.72 million in passive component structural reforms in H1, the executive suite extracted a $39.45 million operational gain. The transition from commoditized electronic components to AI ecosystem solutions is physically verified by TDK Corporation's balance sheet structure: capitalized software intangibles reached $169.23 million, vastly outstripping traditional patent valuations of $0.84 million.
While the firm remains structurally exposed to the Democratic Republic of Congo for cobalt and China for heavy rare earths (dysprosium), its $733.44 million capital deployment for upstream advance payments establishes a formidable physical supply moat. The targeted ~35% dividend payout ratio ensures that free cash flows generated by this hardware scaling are systematically transferred to equity holders.
Table 7: Capital Expenditure & Restructuring
| Category | USD (Millions) | JPY (Billions) |
| Energy CapEx Deployment | $1,290.98 | 193.1 |
| HDD Heads & Suspensions CapEx | $222.92 | 33.3 |
| Upstream Supply Advance Payments | $733.44 | 109.7 |
| H1 Structural Reform Expenses | $18.72 | 2.8 |
Table 8: Impairment Analysis
| Asset Class | USD (Millions) | JPY (Millions) | Breakdown / Note |
| Magnet Impairment | $5.84 | 873 | Tangibles: $5.64M; ROU: $0.12M; Intangibles: $0.08M |
| Energy Impairment | $6.94 | 1,030 | Tangibles: $6.76M; Intangibles: $0.18M |
| Sensor Impairment | $2.43 | 364 | Tangibles |
| Other Goodwill | $2.26 | 338 | - |
| Passive Impairment Reversal | (-$12.45) | (-1,860) | Reversal |
| Total Net Impairment Loss | $5.02 | 751 | Net Result |
Table 9: Asset Valuation: High-Frequency Components
| Metric | Details |
| Current Book Value | $119.68 million (JPY 17.9 billion) |
| Testing Parameter | 13.0% Discount Rate |
| Prior Year Valuation | $71.03 million (JPY 10.6 billion) |
Table 10: Shareholder Returns Policy
| Category | Details |
| Dividend Payout Ratio Target | ~35% (Adjusted for Oct 2024 1:5 stock split) |
| Interim Dividend | $0.11 (JPY 16.00) per share |
| Final Proposed Dividend | $0.13 (JPY 20.00) per share |
| Total Annual Dividend | $0.24 (JPY 36.00) per share |
Table 11: FY2027 Forward Guidance & Efficiency Targets
| Metric | Target / Assumption |
| Macro FX Assumption | 135 JPY/USD |
| Revenue Target | $16,714.74 million (JPY 2,500 billion) |
| Revenue Growth | ~5% (Normalized) |
| Return on Equity (ROE) | 10%+ |
| Operating Profit Margin (OPM) | 11%+ |
| ROIC (Mid-term) | 8%+ |
| ROIC (Long-term) | 12%+ |
Presentation Download & Video Access:
- Presentation Download: Click the PDF download link under 'Related Topics' to access the full institutional presentation of this report.
- Video Link: Click this link to watch the HDIN analyst briefing on YouTube.
About HDIN Research:
HDIN Research is a premier global market intelligence and strategic advisory firm specializing in institutional-grade financial analysis, supply chain audits, and macroeconomic forecasting. Our dedicated sector analysts deliver actionable, data-driven insights tailored for private equity, hedge funds, and corporate strategy teams. Visit us at http://www.hdinresearch.com.
2026 AI Transparency Footer:
"This intelligence report was authored by HDIN Research analysts following a rigorous audit of official corporate filings. AI was utilized for massive-scale data synthesis and structural drafting, ensuring 100% inclusion of reported data points. All strategic insights, financial modeling, and final verdicts were verified by our editorial board to ensure professional accuracy and compliance with 2026 Google Search E-E-A-T standards."