Olympus Corporation: $179.7M Capex Realignment Near Tokyo HQ as -4.8% SIS Margin Signals U.S. FDA Compliance Bottlenecks
Date : 2026-06-20
Reading : 343
HDIN Executive Takeaways
* Olympus Corporation reported flat 0.0% ex-FX top-line growth at $6,757.3 million, masked by a $90.7 million currency tailwind, while reported operating profit plummeted 40.2% to $649.3 million amid a 3.8 percentage point gross margin contraction.
* The Aizu, Fukushima manufacturing facility halted specific U.S. importations following a June 2025 FDA alert, accelerating the $72.1 million "Elevate" compliance program and forcing critical supply chain localization across Suzhou, China, and Dong Nai, Vietnam.
* Institutional attention pivots to a $1,200.6 million Goodwill concentration in the Surgical segment, testing aggressive 10.7%–13.6% WACC assumptions against $57.2 million in capitalized R&D write-downs and a 90% independent board restructuring prioritizing patient safety metrics.
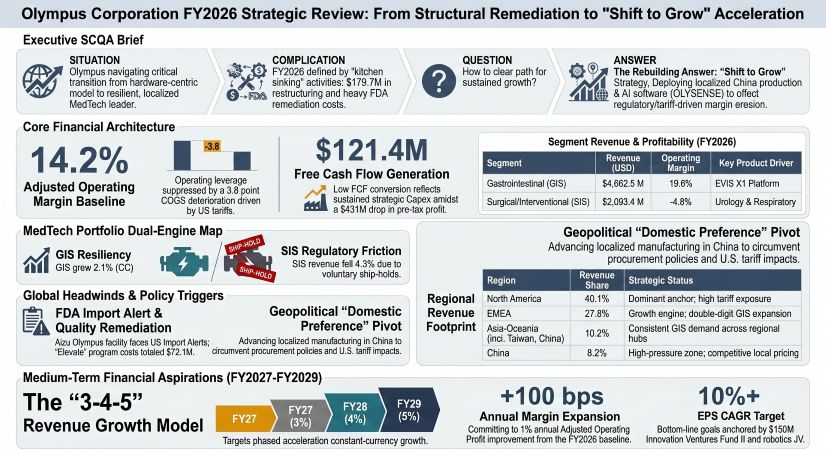
Figure Olympus Corporation FY2026 Strategic Review: From Structural Remediation to Shift to Grow Acceleration
 Segmental Realities and Margin Compression
Olympus Corporation [TYO: 7733] executed a fiscal year characterized by severe gross margin deterioration, shrinking 3.8 percentage points to 64.7% (Gross Profit of $4,373.2 million) driven by a 13.7% expansion in Cost of Sales to $2,384.1 million (356,586 million JPY) equating to a 35.3% COGS ratio. A $90.7 million (13,560 million JPY) favorable exchange rate artificially propped consolidated revenue to $6,757.3 million (1,010,676 million JPY), representing a 1.3% as-reported expansion, but precisely 0.0% ex-FX. Net foreign exchange volatility (EUR 174.79 JPY; CNY 21.25 JPY; USD 150.77 JPY) simultaneously applied a -$2.3 million (-339 million JPY) headwind to the reported operating profit. Net profit registered at $455.8 million, reflecting a $435.1 million contraction in pre-tax profit.
Adjusted Operating Profit compressed 24.0% to $958.2 million, yielding a 14.2% margin, which represents a 4.7 percentage point degradation from FY2025. This baseline was established after adding back $384.7 million (+83.9% year-over-year) in "Other Expenses" and deducting $75.8 million in "Other Income" (including $40.08 million / 5,995 million JPY from Evident Corporation licensing and $7.80 million / 1,166 million JPY from an Olympus Czech Group, s.r.o. property sale). Total production volume stabilized at $6,094.1 million (911,491 million JPY).
* Gastrointestinal Solutions (GIS): Generated $4,662.5 million (697,359 million JPY) in revenue, representing 3.5% as-reported and 2.1% ex-FX growth. Operating profit fell 20.5% to $911.7 million (136,359 million JPY), compressing margins to 19.6%. Production volume equaled $4,362.6 million.
* Surgical & Interventional Solutions (SIS): Contracted to $2,093.4 million (313,109 million JPY) in revenue (-3.0% as-reported, -4.3% ex-FX). The division collapsed from a prior $102.1 million profit into an operating deficit of -$100.2 million (-14,986 million JPY), landing at a -4.8% margin. Production volume equaled $1,728.8 million.
Table Cost Structure and Balance Sheet Degradation:
Infrastructure Layout and Regional Moats
Olympus operates from its global headquarters in Hachioji, Tokyo, supported by the Technology Development Center Ishikawa and Technology Development Center Utsuki. Core surgical R&D operates via Medi-Tate Ltd. in Or-Akiva, Israel, holding $55.43 million (8,290 million JPY) in unamortized intangible value. However, the physical manufacturing network is undergoing severe geopolitical testing.
* North America ($2,711.1 million / 40.1% revenue): Anchored by Olympus Corporation of the Americas in Pennsylvania and Gyrus ACMI, Inc. in Massachusetts. Regional revenue relied on the EVIS X1 (EDOF video scopes), EU-ME3 ultrasound systems, and GORE VIABIL Biliary Endoprosthesis launches. Pipeline execution faces constraints following the June 24, 2025, U.S. FDA Import Alert applied to bronchoscopes, laparoscopes, and ureterorenoscopes sourced from the Aizu Olympus facility in Fukushima, Japan.
* EMEA ($1,879.2 million / 27.8% revenue): Operations are coordinated by Olympus Europa SE & Co. KG in Hamburg, Germany, with manufacturing localized at Olympus Winter & Ibe GmbH (Hamburg) and KeyMed Ltd. (Essex, UK).
* APAC & China ($1,237.2 million combined revenue): Olympus Corporation of Asia Pacific Limited in Hong Kong and Olympus (China) Co., Ltd. in Beijing navigate distinct regional dynamics. To bypass Chinese domestic-preference procurement policies and counter U.S. tariffs, Olympus utilizes Olympus (Suzhou) Medical Device Co., Ltd. in Jiangsu and Olympus Vietnam Co., Ltd. in Dong Nai for GIS manufacturing.
* Japan ($694.7 million / 10.3% revenue): Domestic manufacturing covers Nagano (Tatsuno, Ina), Shirakawa, Aomori, and Hinode. Sales were pressured by rigid hospital budget caps, countered by deployments of the NBI/TXI-enabled EVIS X1 video system and the VISERA ELITE III system.
* Supply Chain De-risking & Commercial Integration: To maintain a resilient optical glass supply, Olympus holds 400,000 shares ($2.85 million / 427 million JPY) in Ohara Inc. The firm added one strategic unlisted holding for $14.0 million (2,099 million JPY), expanding total unlisted equity to six entities valued at $14.3 million (2,140 million JPY) to secure semiconductor buffer inventory. Commercially, Olympus transitioned its Chilean market to direct-sales by acquiring Sur Medical SpA for $29.72 million (4,445 million JPY), booking $12.23 million (1,829 million JPY) in Goodwill and $11.58 million (1,732 million JPY) in customer intangibles. Future product pipelines aim to connect 5% of hardware to the OLYSENSE CAD/AI platform by FY2028, expanding to 25% by FY2031.
HDIN Institutional Verdict
Olympus Corporation management is advancing a "Shift to Grow" narrative, committing to a 100 basis point annual Adjusted Operating Profit Margin expansion from the current 14.2% baseline and targeting constant-currency revenue growth of 3% in FY2027, 4% in FY2028, and 5% in FY2029 to reach a >10% EPS CAGR. However, HDIN Research determines this forward guidance requires mathematically frictionless execution within a severely impaired Surgical & Interventional Solutions division.
The immediate structural reality is a $1,200.6 million (179,576 million JPY) Goodwill concentration in the SIS segment, absorbing 92.4% of the $1,298.7 million total Goodwill and 11.7% of total consolidated assets. Management defends this carrying value using aggressive WACC discount rates of 10.7%–13.6% (up from 12.2% in FY2025) and terminal growth assumptions of 2.2%–3.6% for SIS (2.1%–6.3% for GIS). Yet, the simultaneous $57.2 million impairment of internally capitalized development assets confirms that regulatory friction—specifically the FDA Import Alert and concurrent voluntary EBUS-TBNA and therapeutic energy ship-holds—is actively deteriorating pipeline asset recoverability. Total intangibles now sit at $675.5 million.
Capital allocation matrices further illustrate margin friction. Olympus committed to early-stage venturing by injecting $29.3 million (4,410 million JPY) into the Swan EndoSurgical joint venture, with total commitments up to $206 million. This venture alone generated an operating profit drag of -$11.34 million (-1,696 million JPY) and introduced complex option mark-to-market volatility ($23.59 million / 3,528 million JPY in income versus $28.02 million / 4,191 million JPY in expense), resulting in a consolidated equity-method loss of -$24.74 million (-3,700 million JPY). A contingent $7.4 million (1,114 million JPY) guarantee was zeroed, while $10.69 million (1,599 million JPY) is locked in FVOCI assets like Neuspera Medical. Moving into FY2027, Olympus pledges $150 million to the OIV Fund II and $270 million to acquire BioProtect Ltd.
Executive remuneration structures explicitly confirm the severity of the operational crisis. The CEO's FY2026 Short-Term Incentive payout collapsed to 48.6%, as the 25% operating margin mandate registered a 0% score. By hardwiring 40% of the FY2027 STI to "Patient safety" and tying Long-Term Incentives (60% PSU / 40% RSU) to a strict 84%–85% reduction in Scope 1 and 2 emissions by FY2029 (versus an FY2020 baseline), the 90% independent board (10 of 11 members post-June 2026, alongside 49.30% foreign ownership) is systematically enforcing compliance over top-line expansion. If the $72.1 million QA/RA remediation fails to immediately dissolve FDA restrictions, the FY2027 revenue targets will face insurmountable mathematical headwinds.
Presentation Download & Video Access:
- Presentation Download: Click the PDF download link under 'Related Topics' to access the full institutional presentation of this report.
- Video Link: Click this link to watch the HDIN analyst briefing on YouTube.
About HDIN Research:
HDIN Research is a premier global market intelligence and strategic advisory firm specializing in institutional-grade financial analysis, supply chain audits, and macroeconomic forecasting. Our dedicated sector analysts deliver actionable, data-driven insights tailored for private equity, hedge funds, and corporate strategy teams. Visit us at http://www.hdinresearch.com.
*This intelligence report was authored by HDIN Research analysts following a rigorous audit of official corporate filings. AI was utilized for massive-scale data synthesis and structural drafting, ensuring 100% inclusion of reported data points. All strategic insights, financial modeling, and final verdicts were verified by our editorial board to ensure professional accuracy and compliance with 2026 Google Search E-E-A-T standards.*
* Olympus Corporation reported flat 0.0% ex-FX top-line growth at $6,757.3 million, masked by a $90.7 million currency tailwind, while reported operating profit plummeted 40.2% to $649.3 million amid a 3.8 percentage point gross margin contraction.
* The Aizu, Fukushima manufacturing facility halted specific U.S. importations following a June 2025 FDA alert, accelerating the $72.1 million "Elevate" compliance program and forcing critical supply chain localization across Suzhou, China, and Dong Nai, Vietnam.
* Institutional attention pivots to a $1,200.6 million Goodwill concentration in the Surgical segment, testing aggressive 10.7%–13.6% WACC assumptions against $57.2 million in capitalized R&D write-downs and a 90% independent board restructuring prioritizing patient safety metrics.
Figure Olympus Corporation FY2026 Strategic Review: From Structural Remediation to Shift to Grow Acceleration
Segmental Realities and Margin CompressionOlympus Corporation [TYO: 7733] executed a fiscal year characterized by severe gross margin deterioration, shrinking 3.8 percentage points to 64.7% (Gross Profit of $4,373.2 million) driven by a 13.7% expansion in Cost of Sales to $2,384.1 million (356,586 million JPY) equating to a 35.3% COGS ratio. A $90.7 million (13,560 million JPY) favorable exchange rate artificially propped consolidated revenue to $6,757.3 million (1,010,676 million JPY), representing a 1.3% as-reported expansion, but precisely 0.0% ex-FX. Net foreign exchange volatility (EUR 174.79 JPY; CNY 21.25 JPY; USD 150.77 JPY) simultaneously applied a -$2.3 million (-339 million JPY) headwind to the reported operating profit. Net profit registered at $455.8 million, reflecting a $435.1 million contraction in pre-tax profit.
Adjusted Operating Profit compressed 24.0% to $958.2 million, yielding a 14.2% margin, which represents a 4.7 percentage point degradation from FY2025. This baseline was established after adding back $384.7 million (+83.9% year-over-year) in "Other Expenses" and deducting $75.8 million in "Other Income" (including $40.08 million / 5,995 million JPY from Evident Corporation licensing and $7.80 million / 1,166 million JPY from an Olympus Czech Group, s.r.o. property sale). Total production volume stabilized at $6,094.1 million (911,491 million JPY).
* Gastrointestinal Solutions (GIS): Generated $4,662.5 million (697,359 million JPY) in revenue, representing 3.5% as-reported and 2.1% ex-FX growth. Operating profit fell 20.5% to $911.7 million (136,359 million JPY), compressing margins to 19.6%. Production volume equaled $4,362.6 million.
* Surgical & Interventional Solutions (SIS): Contracted to $2,093.4 million (313,109 million JPY) in revenue (-3.0% as-reported, -4.3% ex-FX). The division collapsed from a prior $102.1 million profit into an operating deficit of -$100.2 million (-14,986 million JPY), landing at a -4.8% margin. Production volume equaled $1,728.8 million.
Table Cost Structure and Balance Sheet Degradation:
| Category | Metric | FY2026 Result | Commentary |
|---|---|---|---|
| SG&A & Restructuring | SG&A Expense | $3,390.3M | +2.3% YoY; 50.2% of revenue (+0.5 pts) |
| Global Workforce Optimization Cost | $179.7M (JPY 26,872M) | Ongoing restructuring and efficiency program | |
| QA/RA Elevate Program | Quality Remediation Cost | $72.1M (JPY 10,781M) | Down from FY2025 peak of $129.0M |
| YoY Reduction | $57.3M (JPY 8,600M) | Indicates remediation progress | |
| R&D Investment | Expensed R&D | $589.3M (JPY 88,147M) | Core innovation spending |
| Capitalized R&D | $145.8M (JPY 21,801M) | Development asset creation | |
| Impairments | Total Impairment Losses | $80.8M (JPY 12,085M) | Significant asset write-downs |
| Development Asset Write-Down | $57.2M (JPY 8,555M) | Full write-off of capitalized projects | |
| └ GIS Development Assets | $34.6M (JPY 5,179M) | Fully impaired | |
| └ SIS Development Assets | $22.6M (JPY 3,376M) | Fully impaired | |
| SIS Technology Intangibles Impairment | $10.7M (JPY 1,595M) | Additional technology-related charge | |
| Balance Sheet | Total Assets | $10,277.3M | +7.2% YoY |
| Inventory | $1,384.6M | +10.7% YoY accumulation | |
| Inventory Valuation Write-Downs | $213.6M (JPY 31,955M) | Reflects inventory quality pressure | |
| Provisions | Total Provisions | $173.5M (JPY 25,950M) | Multi-category risk reserves |
| Warranty Liabilities | $44.6M (JPY 6,667M) | Product quality exposure | |
| └ Surgical Recall Reserve | $16.7M (JPY 2,500M) | Recall-related costs | |
| └ Small Intestine Endoscope Reserve | $2.7M (JPY 411M) | Product-specific provision | |
| └ High-Speed Insufflator Reserve | $3.4M (JPY 513M) | Product-specific provision | |
| Duodenoscope Cap Replacement Reserve | $17.6M (JPY 2,631M) | Regulatory compliance cost | |
| Uncertain Tax Interpretation Reserve | $43.9M (JPY 6,571M) | Tax exposure | |
| Litigation Reserve (Net) | $7.1M (JPY 1,068M) | Includes Olympus Shenzhen reversal benefit | |
| Cash Flow | Operating Cash Flow | $672.5M | -47.2% YoY |
| Corporate Tax Payments | $417.0M (JPY 62,374M) | Major cash drain | |
| Capital Expenditure | $551.1M | Core investment spending | |
| Free Cash Flow (Proxy) | $121.4M | OCF less CapEx | |
| Cash & Equivalents | $1,257.2M | Down $431.2M YoY | |
| Capital Structure | Total Liabilities | $4,848.1M | Moderate leverage profile |
| Total Debt | $1,601.8M | Includes short- and long-term debt | |
| └ Short-Term Debt | $534.0M | Current obligations | |
| └ Long-Term Debt | $1,067.7M | Long-term financing | |
| Net Debt | $344.6M | Conservative leverage position | |
| Equity Ratio | 52.8% | Improved by 0.4 percentage points | |
| Shareholder Returns | Financing Cash Outflow | $585.9M | Capital return activity |
| Share Repurchases | $334.3M (JPY 50.0B) | Buyback execution | |
| Dividends Paid | $150.8M | Shareholder distributions | |
| Portfolio Optimization | Orthopedic Business Divestiture Gain | $2.9M (JPY 435M) | Final transaction gain |
| Divested Assets | $83.4M (JPY 12,480M) | Assets sold | |
| Divested Liabilities | $26.9M (JPY 4,030M) | Liabilities transferred | |
| Historical Revenue Contribution | $19.6M (JPY 2,929M) | Pre-divestiture revenue | |
| Historical Cash Inflow | $43.8M (JPY 6,551M) | Transaction cash proceeds |
Infrastructure Layout and Regional Moats
Olympus operates from its global headquarters in Hachioji, Tokyo, supported by the Technology Development Center Ishikawa and Technology Development Center Utsuki. Core surgical R&D operates via Medi-Tate Ltd. in Or-Akiva, Israel, holding $55.43 million (8,290 million JPY) in unamortized intangible value. However, the physical manufacturing network is undergoing severe geopolitical testing.
* North America ($2,711.1 million / 40.1% revenue): Anchored by Olympus Corporation of the Americas in Pennsylvania and Gyrus ACMI, Inc. in Massachusetts. Regional revenue relied on the EVIS X1 (EDOF video scopes), EU-ME3 ultrasound systems, and GORE VIABIL Biliary Endoprosthesis launches. Pipeline execution faces constraints following the June 24, 2025, U.S. FDA Import Alert applied to bronchoscopes, laparoscopes, and ureterorenoscopes sourced from the Aizu Olympus facility in Fukushima, Japan.
* EMEA ($1,879.2 million / 27.8% revenue): Operations are coordinated by Olympus Europa SE & Co. KG in Hamburg, Germany, with manufacturing localized at Olympus Winter & Ibe GmbH (Hamburg) and KeyMed Ltd. (Essex, UK).
* APAC & China ($1,237.2 million combined revenue): Olympus Corporation of Asia Pacific Limited in Hong Kong and Olympus (China) Co., Ltd. in Beijing navigate distinct regional dynamics. To bypass Chinese domestic-preference procurement policies and counter U.S. tariffs, Olympus utilizes Olympus (Suzhou) Medical Device Co., Ltd. in Jiangsu and Olympus Vietnam Co., Ltd. in Dong Nai for GIS manufacturing.
* Japan ($694.7 million / 10.3% revenue): Domestic manufacturing covers Nagano (Tatsuno, Ina), Shirakawa, Aomori, and Hinode. Sales were pressured by rigid hospital budget caps, countered by deployments of the NBI/TXI-enabled EVIS X1 video system and the VISERA ELITE III system.
* Supply Chain De-risking & Commercial Integration: To maintain a resilient optical glass supply, Olympus holds 400,000 shares ($2.85 million / 427 million JPY) in Ohara Inc. The firm added one strategic unlisted holding for $14.0 million (2,099 million JPY), expanding total unlisted equity to six entities valued at $14.3 million (2,140 million JPY) to secure semiconductor buffer inventory. Commercially, Olympus transitioned its Chilean market to direct-sales by acquiring Sur Medical SpA for $29.72 million (4,445 million JPY), booking $12.23 million (1,829 million JPY) in Goodwill and $11.58 million (1,732 million JPY) in customer intangibles. Future product pipelines aim to connect 5% of hardware to the OLYSENSE CAD/AI platform by FY2028, expanding to 25% by FY2031.
HDIN Institutional Verdict
Olympus Corporation management is advancing a "Shift to Grow" narrative, committing to a 100 basis point annual Adjusted Operating Profit Margin expansion from the current 14.2% baseline and targeting constant-currency revenue growth of 3% in FY2027, 4% in FY2028, and 5% in FY2029 to reach a >10% EPS CAGR. However, HDIN Research determines this forward guidance requires mathematically frictionless execution within a severely impaired Surgical & Interventional Solutions division.
The immediate structural reality is a $1,200.6 million (179,576 million JPY) Goodwill concentration in the SIS segment, absorbing 92.4% of the $1,298.7 million total Goodwill and 11.7% of total consolidated assets. Management defends this carrying value using aggressive WACC discount rates of 10.7%–13.6% (up from 12.2% in FY2025) and terminal growth assumptions of 2.2%–3.6% for SIS (2.1%–6.3% for GIS). Yet, the simultaneous $57.2 million impairment of internally capitalized development assets confirms that regulatory friction—specifically the FDA Import Alert and concurrent voluntary EBUS-TBNA and therapeutic energy ship-holds—is actively deteriorating pipeline asset recoverability. Total intangibles now sit at $675.5 million.
Capital allocation matrices further illustrate margin friction. Olympus committed to early-stage venturing by injecting $29.3 million (4,410 million JPY) into the Swan EndoSurgical joint venture, with total commitments up to $206 million. This venture alone generated an operating profit drag of -$11.34 million (-1,696 million JPY) and introduced complex option mark-to-market volatility ($23.59 million / 3,528 million JPY in income versus $28.02 million / 4,191 million JPY in expense), resulting in a consolidated equity-method loss of -$24.74 million (-3,700 million JPY). A contingent $7.4 million (1,114 million JPY) guarantee was zeroed, while $10.69 million (1,599 million JPY) is locked in FVOCI assets like Neuspera Medical. Moving into FY2027, Olympus pledges $150 million to the OIV Fund II and $270 million to acquire BioProtect Ltd.
Executive remuneration structures explicitly confirm the severity of the operational crisis. The CEO's FY2026 Short-Term Incentive payout collapsed to 48.6%, as the 25% operating margin mandate registered a 0% score. By hardwiring 40% of the FY2027 STI to "Patient safety" and tying Long-Term Incentives (60% PSU / 40% RSU) to a strict 84%–85% reduction in Scope 1 and 2 emissions by FY2029 (versus an FY2020 baseline), the 90% independent board (10 of 11 members post-June 2026, alongside 49.30% foreign ownership) is systematically enforcing compliance over top-line expansion. If the $72.1 million QA/RA remediation fails to immediately dissolve FDA restrictions, the FY2027 revenue targets will face insurmountable mathematical headwinds.
Presentation Download & Video Access:
- Presentation Download: Click the PDF download link under 'Related Topics' to access the full institutional presentation of this report.
- Video Link: Click this link to watch the HDIN analyst briefing on YouTube.
About HDIN Research:
HDIN Research is a premier global market intelligence and strategic advisory firm specializing in institutional-grade financial analysis, supply chain audits, and macroeconomic forecasting. Our dedicated sector analysts deliver actionable, data-driven insights tailored for private equity, hedge funds, and corporate strategy teams. Visit us at http://www.hdinresearch.com.
*This intelligence report was authored by HDIN Research analysts following a rigorous audit of official corporate filings. AI was utilized for massive-scale data synthesis and structural drafting, ensuring 100% inclusion of reported data points. All strategic insights, financial modeling, and final verdicts were verified by our editorial board to ensure professional accuracy and compliance with 2026 Google Search E-E-A-T standards.*