Denka Company Limited: US Facility Suspension Near Louisiana as 339 bps Margin Expansion Signals Advanced Material Transition
Date : 2026-06-23
Reading : 99
HDIN Executive Takeaways
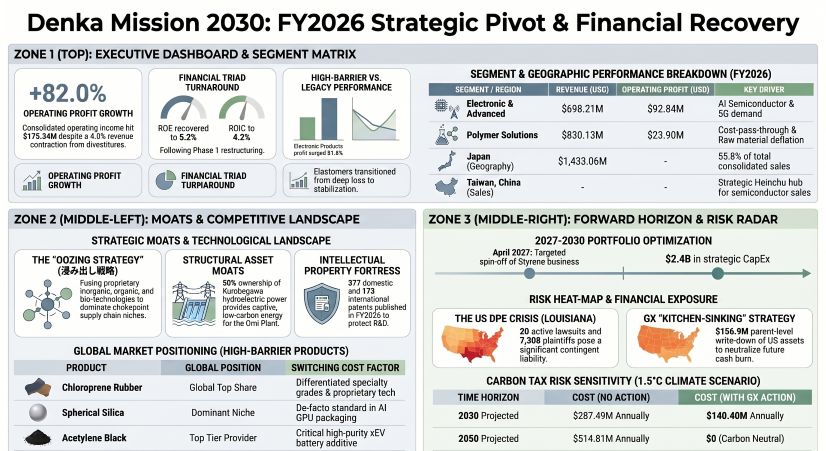
* Denka Company Limited [TYO: 4061] reported a 4.0% consolidated net sales contraction to $2,569.04M, while operating profit expanded 82.0% to $175.34M, driven by cost-pass-through mechanisms and AI semiconductor material demand.
* The indefinite suspension of the DPE chloroprene plant in Louisiana eliminated structural cash burn, triggering $141.1M in special impairment losses and escalating US parent-level write-downs to $156.89M.
* A 1.5°C climate scenario exposes the energy-intensive carbide chain to a $287.49M carbon tax burden by 2030 unless planned process electrification mitigates this liability to a projected $140.40M.
Figure Denka Mission 2030: FY2026 Strategic Pivot & Financial Recovery
 Segmental Realities and Financial Equilibrium
Despite a $100.28M (JPY 15.0 Billion) increase in fixed costs from aggressive upfront investments during Phase 1 of its "Mission 2030" plan, Denka Company Limited successfully prioritized margin protection over volume expansion. The firm implemented downward sales price revisions aligned with naphtha deflation, optically compressing top-line revenue by 4.0%. However, by utilizing dynamic formula-based pricing to pass input fluctuations to end-users, gross profit margins expanded by 339 basis points to 24.53%, pushing operating profit to $175.34M (JPY 26.22 Billion), exceeding the management's revised "must-achieve" milestone of JPY 25.0 Billion.
Consolidated Income & Profitability Profile
* Net Sales: $2,569.04M (-4.0% YoY, down from $2,676.04M)
* Gross Profit: $630.19M (+11.4% YoY, up from $565.59M)
* Gross Profit Margin: 24.53% (+339 bps from 21.14%)
* Operating Profit: $175.34M (+82.0% YoY, up from $96.36M)
* Operating Margin: 6.82% (+322 bps from 3.60%)
* Net Income: $104.94M (JPY 15.69 Billion, turning around a -$82.24M loss)
* ROE: 5.2% (+9.3 pts from -4.1%, targeting 8.0% in Phase 2)
* ROIC: 4.2% (+1.7 pts from 2.5%)
* Operating Cash Flow: $241.72M (+94.2% YoY, up from $124.49M)
* Earnings Quality Ratio (OCF / Net Income): 2.30x
Table 1: Segmental Performance Matrix
Table 2: Geographic Performance Matrix
Capital Structure, Liquidity, & Asset Efficiency
Management enacted strict financial discipline, reducing its original 8-year CapEx plan from JPY 640.0 Billion to JPY 540.0 Billion (a $668.6M reduction). Total long-term CapEx is budgeted at $3.61 Billion, with $2.41 Billion (JPY 360.0 Billion) reserved for strategic megatrends.
* Total Assets: $4,553.13M (+3.9% YoY); Asset Turnover: 0.56x (-0.05x).
* Total Net Assets: $2,265.36M (+9.9% YoY); Equity Ratio: 45.6% (+0.4 pts).
* D/E Ratio: 0.71x (Improved from 0.73x, tracking near the < 0.7x target).
* Interest Coverage Ratio: 17.7x (+8.8x from 8.9x).
* Debt Repayment Period: 6.1 Years (-5.6 years from 11.7 years).
* Working Capital: Total inventories declined 2.4% to $851.76M. Cost of sales contracted 8.1% to $1,938.85M. Estimated inventory turnover extended by 9.5 days to 160.4 days, but Cash Conversion Cycle (CCC) improved by an equivalent of $53.49M (JPY 8.0 Billion).
* Capital Deployment: FY2026 total CapEx reached $375.08M (JPY 56.10 Billion). Investing Cash Flow outlays narrowed by 24.4% to -$301.01M. Financing Cash Flow contracted 81.0% to $50.83M.
* Shareholder Returns: Dividends paid totaled $57.68M (JPY 8.62 Billion) at $0.67 (100 JPY) per share, representing a 54.9% payout ratio against a cumulative 50% target. Share buybacks were minimal at $0.04M (JPY 6.7 million).
Global Infrastructure Layout and Regional Moats
Denka's physical network leverages severe upstream integration. The energy-intensive "Carbide Chain" relies on a 50% joint venture with Kurobegawa Electric Power, which provides 145 MW of localized hydroelectric power (targeting 150 MW by 2030). The company assumes off-balance sheet guarantee obligations of $68.28M (JPY 10,213 million) overall, strictly allocating $68.28M (JPY 10,212 million) to secure this JV energy infrastructure. Parent-level guarantees stand at $194.10M (JPY 29,032 million).
Manufacturing and Restructuring Footprint
* Japan (Core R&D & Production): Assets include the Denka Innovation Center (Machida), Gosen Site (Niigata), and primary plants: Omi (Niigata), Omuta (Fukuoka), Chiba, Shibukawa (Gunma), Isesaki (Gunma), and Kinos (Ibaraki). The Ofuna Plant (Kanagawa) was entirely shuttered in March 2026. Domestic cement production was halted in June 2025. The styrene business is slated for spin-off in April 2027.
* Asia-Pacific Consolidation: Singapore houses Denka Life Innovation Research Pte. Ltd., Denka Singapore Pte. Ltd. (absorbing Toyokalon synthetic fiber production), and Denka Advantech Pte. Ltd. Operations in China include Denka Fine Materials (Suzhou), Denka Electronic Materials (Dalian), Denka Inorganic Materials (Tianjin), and Taiwan Chaoshuo Co. (Hsinchu). Vietnam operations scale out of Hung Yen.
* Thailand Joint Venture: To bypass localized logistics bottlenecks, Denka deployed $253.66M (JPY 37.94 Billion / JPY 37.9 Billion) CapEx alongside SCGC to construct Denka SCGC Advanced Materials Co., Ltd. in Rayong, securing local acetylene black supply for xEV batteries.
* US & European Presence: Denka Chemicals G.m.b.H. handles sales out of Düsseldorf, Germany. US manufacturing via Denka Performance Elastomer LLC (DPE) in Louisiana remains indefinitely suspended.
M&A Accounting Triggers
* KAINOS Acquisition: Denka acquired a 73.4% stake in clinical reagent manufacturer KAINOS via public tender offer in March 2026 for $49.25M (JPY 7,366 million). This generated $15.02M (JPY 2,246 million) in Positive Goodwill, to be straight-line amortized over a maximum of 20 years.
* Toyo Styrene Consolidation: Denka purchased an additional 15% voting block from Daicel for $1.34M (JPY 200 million), lifting control from 50% to 65%. Revaluing net assets triggered a massive $43.57M (JPY 6,517 million) Negative Goodwill gain, partially offset by a $32.59M (JPY 4,875 million) Loss on Step Acquisition on the original 50% stake.
HDIN Institutional Verdict
Denka's balance sheet undergoes severe structural stress-testing primarily driven by its US exposures and impending Green Transformation (GX) mandates, contrasted by favorable domestic actuarial updates. While the firm hedges FX risk (USD/JPY, EUR/USD, THB/USD) and executes interest rate swaps on long-term debt, external litigation and carbon cost exposures dwarf traditional financial risks. Furthermore, Denka will adopt the ASBJ Statement No. 34 lease accounting standard in FY2028, capitalizing operating leases onto the balance sheet.
Forensic Adjustments & Litigation Liabilities
* US Mass Tort & EPA Crisis: The suspended Louisiana DPE facility is defending 20 lawsuits involving 7,308 plaintiffs. At a maximum $50,000 per plaintiff, gross contingent exposure theoretically hits $365.4M. The EPA mandated strict emission reductions in April/May 2024, prompting federal appeals in May and July 2024.
* Parent-Level Write-Downs: The crisis forced a $141.1M special impairment loss in FY2026. On a standalone parent basis, Denka recognized a $156.89M (JPY 23,466 million) impairment on Denka USA LLC shares, driving a total "Loss on Valuation of Shares of Subsidiaries and Associates" to $160.99M (JPY 24,079 million). The Deferred Tax Asset (DTA) valuation allowance increased by $30.47M (JPY 4,557 million).
* ARO & Pension Adjustments: Asset Retirement Obligations (ARO) improved via a $5.70M (JPY 853 million) downward estimate revision, reducing the opening $12.25M (JPY 1,833 million) balance to $6.25M (JPY 935 million). Concurrently, management raised the pension discount rate assumption from 1.2-1.9% to 1.9-3.1%. This shrank the Projected Benefit Obligation (PBO) by $17.38M (JPY 2,600 million). Current PBO stands at $216.61M (JPY 32,398 million) against $274.05M (JPY 40,990 million) in plan assets. Adding the $9.73M (JPY 1,455 million) unfunded PBO, Denka holds a net Retirement Benefit Asset of $47.71M (JPY 7,136 million).
R&D Execution & Intellectual Property Moats
Denka allocated $98.74M (JPY 14.76 Billion) to R&D, deploying 849 personnel globally. Output included 377 domestic patents, 173 international patents, and 308 registered domestic patents. Partnerships include Yamagata University, Niigata University, and the NIMS-Denka Next-Generation Materials Research Center.
* Capital Stratification: Electronic & Advanced secured 37.3% ($36.88M), Life Innovation 30.8% ($30.41M), Elastomer & Infrastructure 16.4% ($16.15M), Polymer Solutions 12.7% ($12.52M), and Engineering 2.8% ($2.75M). Core product pipelines mandate scaling Sneacton (low-dielectric 5G resin), G47Δ (cancer therapy), LEAF (CO2-absorbing concrete), Denka IPX (ABS resin), and D-NODE (chemical recycling).
Governance, Human Capital & Decarbonization Pressures
* Corporate Governance: The 9-member Board maintains 44.4% independence (4 outside directors). The 4-member Audit Committee holds 75% independence (3 members). The 6-member Nomination/Remuneration Committee is chaired by an independent director. Management execution utilizes 20 executive officers (only 3 are concurrent directors). Compensation mixes 60% base, 30% performance-linked cash, and 10% trust-based stock delivered at retirement.
* Labor Analytics: The consolidated workforce comprises 6,454 full-time and 1,071 temporary workers (Electronic & Advanced: 1,818 FT / 256 PT; Elastomer: 1,395 FT / 231 PT; Life: 1,139 FT / 235 PT; Polymer: 1,037 FT / 137 PT; Corporate: 1,065 FT / 212 PT). The parent company's 4,234 full-time workers report an average age of 40.8 years, tenure of 16.4 years, and average salary of $50,512 (JPY 7,555,075, a 0.53% YoY variance).
* DE&I Metrics: Female managers account for 5.7% (targeting 15%). The aggregate wage gap sits at 64.4% (73.2% for regular employees, 41.2% for part-time). Male childcare utilization hit 77.0% (targeting 85%). Upskilling budgets escalated from $46 (JPY 70,000) to $73 (JPY 110,000) per employee.
* GX Quantified Liabilities: Scope 1 & 2 carbon emissions contracted 51% from the 2.47 Million t-CO2 baseline to 1.20 Million t-CO2 (FY2024 actual: 1.77 Million t-CO2), tracking ahead of the 0.98 Million t-CO2 (-60%) target for 2030 and absolute 0 by 2050. Under a 1.5°C scenario, inaction triggers carbon taxes of $287.49M (JPY 43.0 Billion) by 2030 and $514.81M (JPY 77.0 Billion) by 2050. GX intervention limits this to $140.40M (JPY 21.0 Billion) by 2030 and $0 by 2050.
* Cost Sensitivities: Under a 3-4°C scenario, naphtha inflation exposes Polymer Solutions to a -$26.74M to +$40.12M (-4.0B to +6.0B JPY) operating cost swing by 2030, widening to -$33.43M to +$80.23M by 2050. Natural gas volatility exposes Omi/Chiba plants to a -$40.12M to +$6.69M variance by 2030, and -$53.49M to +$6.69M by 2050. Physical flooding risks exact $6.69M (JPY 1.0 Billion) in projected annual damages.
Presentation Download & Video Access:
Presentation Download: Click the PDF download link under 'Related Topics' to access the full institutional presentation of this report.
Video Link: Click this link to watch the HDIN analyst briefing on YouTube.
About HDIN Research:
HDIN Research is a premier global market intelligence and strategic advisory firm specializing in institutional-grade financial analysis, supply chain audits, and macroeconomic forecasting. Our dedicated sector analysts deliver actionable, data-driven insights tailored for private equity, hedge funds, and corporate strategy teams. Visit us at http://www.hdinresearch.com.
2026 AI Transparency Footer:
"This intelligence report was authored by HDIN Research analysts following a rigorous audit of official corporate filings. AI was utilized for massive-scale data synthesis and structural drafting, ensuring 100% inclusion of reported data points. All strategic insights, financial modeling, and final verdicts were verified by our editorial board to ensure professional accuracy and compliance with 2026 Google Search E-E-A-T standards."
* Denka Company Limited [TYO: 4061] reported a 4.0% consolidated net sales contraction to $2,569.04M, while operating profit expanded 82.0% to $175.34M, driven by cost-pass-through mechanisms and AI semiconductor material demand.
* The indefinite suspension of the DPE chloroprene plant in Louisiana eliminated structural cash burn, triggering $141.1M in special impairment losses and escalating US parent-level write-downs to $156.89M.
* A 1.5°C climate scenario exposes the energy-intensive carbide chain to a $287.49M carbon tax burden by 2030 unless planned process electrification mitigates this liability to a projected $140.40M.
Figure Denka Mission 2030: FY2026 Strategic Pivot & Financial Recovery
Segmental Realities and Financial EquilibriumDespite a $100.28M (JPY 15.0 Billion) increase in fixed costs from aggressive upfront investments during Phase 1 of its "Mission 2030" plan, Denka Company Limited successfully prioritized margin protection over volume expansion. The firm implemented downward sales price revisions aligned with naphtha deflation, optically compressing top-line revenue by 4.0%. However, by utilizing dynamic formula-based pricing to pass input fluctuations to end-users, gross profit margins expanded by 339 basis points to 24.53%, pushing operating profit to $175.34M (JPY 26.22 Billion), exceeding the management's revised "must-achieve" milestone of JPY 25.0 Billion.
Consolidated Income & Profitability Profile
* Net Sales: $2,569.04M (-4.0% YoY, down from $2,676.04M)
* Gross Profit: $630.19M (+11.4% YoY, up from $565.59M)
* Gross Profit Margin: 24.53% (+339 bps from 21.14%)
* Operating Profit: $175.34M (+82.0% YoY, up from $96.36M)
* Operating Margin: 6.82% (+322 bps from 3.60%)
* Net Income: $104.94M (JPY 15.69 Billion, turning around a -$82.24M loss)
* ROE: 5.2% (+9.3 pts from -4.1%, targeting 8.0% in Phase 2)
* ROIC: 4.2% (+1.7 pts from 2.5%)
* Operating Cash Flow: $241.72M (+94.2% YoY, up from $124.49M)
* Earnings Quality Ratio (OCF / Net Income): 2.30x
Table 1: Segmental Performance Matrix
| Segment | Revenue ($M) | YoY Change | Operating Profit ($M) | YoY Change | Key Performance Drivers |
| Electronic & Advanced Products | $698.21 | +13.3% | $92.84 | +51.5% | Robust demand for spherical silica/alumina in AI packaging and Sneacton/AlSinc for 5G/power infrastructure. |
| Polymer Solutions | $830.13 | -8.3% | $23.90 | +209.8% | Profit spreads widened as raw material cost declines outpaced ASP adjustments. |
| Elastomer & Infrastructure | $652.43 | -12.6% | $0.45 | Turnaround | Profitability stabilized following the strategic suspension of the US plant operations. |
| Life Innovation | $270.91 | -6.3% | $41.77 | -34.9% | Earnings impacted by the normalization of COVID-19 and influenza diagnostic testing volumes. |
| Others (Engineering/Trading) | $117.35 | -1.1% | $16.23 | +1.3% | Stable performance with marginal changes in both top and bottom lines. |
Table 2: Geographic Performance Matrix
| Region | Revenue ($M) | YoY Change | % of Total Sales |
| Japan | $1,433.06 | -3.3% | 55.8% |
| China | $356.11 | -14.0% | 13.8% |
| Other Asia | $352.58 | +0.4% | 13.7% |
| Americas / Europe | $427.27 | -0.4% | 16.6% |
Capital Structure, Liquidity, & Asset Efficiency
Management enacted strict financial discipline, reducing its original 8-year CapEx plan from JPY 640.0 Billion to JPY 540.0 Billion (a $668.6M reduction). Total long-term CapEx is budgeted at $3.61 Billion, with $2.41 Billion (JPY 360.0 Billion) reserved for strategic megatrends.
* Total Assets: $4,553.13M (+3.9% YoY); Asset Turnover: 0.56x (-0.05x).
* Total Net Assets: $2,265.36M (+9.9% YoY); Equity Ratio: 45.6% (+0.4 pts).
* D/E Ratio: 0.71x (Improved from 0.73x, tracking near the < 0.7x target).
* Interest Coverage Ratio: 17.7x (+8.8x from 8.9x).
* Debt Repayment Period: 6.1 Years (-5.6 years from 11.7 years).
* Working Capital: Total inventories declined 2.4% to $851.76M. Cost of sales contracted 8.1% to $1,938.85M. Estimated inventory turnover extended by 9.5 days to 160.4 days, but Cash Conversion Cycle (CCC) improved by an equivalent of $53.49M (JPY 8.0 Billion).
* Capital Deployment: FY2026 total CapEx reached $375.08M (JPY 56.10 Billion). Investing Cash Flow outlays narrowed by 24.4% to -$301.01M. Financing Cash Flow contracted 81.0% to $50.83M.
* Shareholder Returns: Dividends paid totaled $57.68M (JPY 8.62 Billion) at $0.67 (100 JPY) per share, representing a 54.9% payout ratio against a cumulative 50% target. Share buybacks were minimal at $0.04M (JPY 6.7 million).
Global Infrastructure Layout and Regional Moats
Denka's physical network leverages severe upstream integration. The energy-intensive "Carbide Chain" relies on a 50% joint venture with Kurobegawa Electric Power, which provides 145 MW of localized hydroelectric power (targeting 150 MW by 2030). The company assumes off-balance sheet guarantee obligations of $68.28M (JPY 10,213 million) overall, strictly allocating $68.28M (JPY 10,212 million) to secure this JV energy infrastructure. Parent-level guarantees stand at $194.10M (JPY 29,032 million).
Manufacturing and Restructuring Footprint
* Japan (Core R&D & Production): Assets include the Denka Innovation Center (Machida), Gosen Site (Niigata), and primary plants: Omi (Niigata), Omuta (Fukuoka), Chiba, Shibukawa (Gunma), Isesaki (Gunma), and Kinos (Ibaraki). The Ofuna Plant (Kanagawa) was entirely shuttered in March 2026. Domestic cement production was halted in June 2025. The styrene business is slated for spin-off in April 2027.
* Asia-Pacific Consolidation: Singapore houses Denka Life Innovation Research Pte. Ltd., Denka Singapore Pte. Ltd. (absorbing Toyokalon synthetic fiber production), and Denka Advantech Pte. Ltd. Operations in China include Denka Fine Materials (Suzhou), Denka Electronic Materials (Dalian), Denka Inorganic Materials (Tianjin), and Taiwan Chaoshuo Co. (Hsinchu). Vietnam operations scale out of Hung Yen.
* Thailand Joint Venture: To bypass localized logistics bottlenecks, Denka deployed $253.66M (JPY 37.94 Billion / JPY 37.9 Billion) CapEx alongside SCGC to construct Denka SCGC Advanced Materials Co., Ltd. in Rayong, securing local acetylene black supply for xEV batteries.
* US & European Presence: Denka Chemicals G.m.b.H. handles sales out of Düsseldorf, Germany. US manufacturing via Denka Performance Elastomer LLC (DPE) in Louisiana remains indefinitely suspended.
M&A Accounting Triggers
* KAINOS Acquisition: Denka acquired a 73.4% stake in clinical reagent manufacturer KAINOS via public tender offer in March 2026 for $49.25M (JPY 7,366 million). This generated $15.02M (JPY 2,246 million) in Positive Goodwill, to be straight-line amortized over a maximum of 20 years.
* Toyo Styrene Consolidation: Denka purchased an additional 15% voting block from Daicel for $1.34M (JPY 200 million), lifting control from 50% to 65%. Revaluing net assets triggered a massive $43.57M (JPY 6,517 million) Negative Goodwill gain, partially offset by a $32.59M (JPY 4,875 million) Loss on Step Acquisition on the original 50% stake.
HDIN Institutional Verdict
Denka's balance sheet undergoes severe structural stress-testing primarily driven by its US exposures and impending Green Transformation (GX) mandates, contrasted by favorable domestic actuarial updates. While the firm hedges FX risk (USD/JPY, EUR/USD, THB/USD) and executes interest rate swaps on long-term debt, external litigation and carbon cost exposures dwarf traditional financial risks. Furthermore, Denka will adopt the ASBJ Statement No. 34 lease accounting standard in FY2028, capitalizing operating leases onto the balance sheet.
Forensic Adjustments & Litigation Liabilities
* US Mass Tort & EPA Crisis: The suspended Louisiana DPE facility is defending 20 lawsuits involving 7,308 plaintiffs. At a maximum $50,000 per plaintiff, gross contingent exposure theoretically hits $365.4M. The EPA mandated strict emission reductions in April/May 2024, prompting federal appeals in May and July 2024.
* Parent-Level Write-Downs: The crisis forced a $141.1M special impairment loss in FY2026. On a standalone parent basis, Denka recognized a $156.89M (JPY 23,466 million) impairment on Denka USA LLC shares, driving a total "Loss on Valuation of Shares of Subsidiaries and Associates" to $160.99M (JPY 24,079 million). The Deferred Tax Asset (DTA) valuation allowance increased by $30.47M (JPY 4,557 million).
* ARO & Pension Adjustments: Asset Retirement Obligations (ARO) improved via a $5.70M (JPY 853 million) downward estimate revision, reducing the opening $12.25M (JPY 1,833 million) balance to $6.25M (JPY 935 million). Concurrently, management raised the pension discount rate assumption from 1.2-1.9% to 1.9-3.1%. This shrank the Projected Benefit Obligation (PBO) by $17.38M (JPY 2,600 million). Current PBO stands at $216.61M (JPY 32,398 million) against $274.05M (JPY 40,990 million) in plan assets. Adding the $9.73M (JPY 1,455 million) unfunded PBO, Denka holds a net Retirement Benefit Asset of $47.71M (JPY 7,136 million).
R&D Execution & Intellectual Property Moats
Denka allocated $98.74M (JPY 14.76 Billion) to R&D, deploying 849 personnel globally. Output included 377 domestic patents, 173 international patents, and 308 registered domestic patents. Partnerships include Yamagata University, Niigata University, and the NIMS-Denka Next-Generation Materials Research Center.
* Capital Stratification: Electronic & Advanced secured 37.3% ($36.88M), Life Innovation 30.8% ($30.41M), Elastomer & Infrastructure 16.4% ($16.15M), Polymer Solutions 12.7% ($12.52M), and Engineering 2.8% ($2.75M). Core product pipelines mandate scaling Sneacton (low-dielectric 5G resin), G47Δ (cancer therapy), LEAF (CO2-absorbing concrete), Denka IPX (ABS resin), and D-NODE (chemical recycling).
Governance, Human Capital & Decarbonization Pressures
* Corporate Governance: The 9-member Board maintains 44.4% independence (4 outside directors). The 4-member Audit Committee holds 75% independence (3 members). The 6-member Nomination/Remuneration Committee is chaired by an independent director. Management execution utilizes 20 executive officers (only 3 are concurrent directors). Compensation mixes 60% base, 30% performance-linked cash, and 10% trust-based stock delivered at retirement.
* Labor Analytics: The consolidated workforce comprises 6,454 full-time and 1,071 temporary workers (Electronic & Advanced: 1,818 FT / 256 PT; Elastomer: 1,395 FT / 231 PT; Life: 1,139 FT / 235 PT; Polymer: 1,037 FT / 137 PT; Corporate: 1,065 FT / 212 PT). The parent company's 4,234 full-time workers report an average age of 40.8 years, tenure of 16.4 years, and average salary of $50,512 (JPY 7,555,075, a 0.53% YoY variance).
* DE&I Metrics: Female managers account for 5.7% (targeting 15%). The aggregate wage gap sits at 64.4% (73.2% for regular employees, 41.2% for part-time). Male childcare utilization hit 77.0% (targeting 85%). Upskilling budgets escalated from $46 (JPY 70,000) to $73 (JPY 110,000) per employee.
* GX Quantified Liabilities: Scope 1 & 2 carbon emissions contracted 51% from the 2.47 Million t-CO2 baseline to 1.20 Million t-CO2 (FY2024 actual: 1.77 Million t-CO2), tracking ahead of the 0.98 Million t-CO2 (-60%) target for 2030 and absolute 0 by 2050. Under a 1.5°C scenario, inaction triggers carbon taxes of $287.49M (JPY 43.0 Billion) by 2030 and $514.81M (JPY 77.0 Billion) by 2050. GX intervention limits this to $140.40M (JPY 21.0 Billion) by 2030 and $0 by 2050.
* Cost Sensitivities: Under a 3-4°C scenario, naphtha inflation exposes Polymer Solutions to a -$26.74M to +$40.12M (-4.0B to +6.0B JPY) operating cost swing by 2030, widening to -$33.43M to +$80.23M by 2050. Natural gas volatility exposes Omi/Chiba plants to a -$40.12M to +$6.69M variance by 2030, and -$53.49M to +$6.69M by 2050. Physical flooding risks exact $6.69M (JPY 1.0 Billion) in projected annual damages.
Presentation Download & Video Access:
Presentation Download: Click the PDF download link under 'Related Topics' to access the full institutional presentation of this report.
Video Link: Click this link to watch the HDIN analyst briefing on YouTube.
About HDIN Research:
HDIN Research is a premier global market intelligence and strategic advisory firm specializing in institutional-grade financial analysis, supply chain audits, and macroeconomic forecasting. Our dedicated sector analysts deliver actionable, data-driven insights tailored for private equity, hedge funds, and corporate strategy teams. Visit us at http://www.hdinresearch.com.
2026 AI Transparency Footer:
"This intelligence report was authored by HDIN Research analysts following a rigorous audit of official corporate filings. AI was utilized for massive-scale data synthesis and structural drafting, ensuring 100% inclusion of reported data points. All strategic insights, financial modeling, and final verdicts were verified by our editorial board to ensure professional accuracy and compliance with 2026 Google Search E-E-A-T standards."