Kyocera Corporation: Aggressive Capital Realignment Near Mainland China and Vietnam Hubs as a $1,671.5 Million Share Repurchase Signals Debt-Funded ROE Expansion
Date : 2026-06-23
Reading : 224
HDIN Executive Takeaways
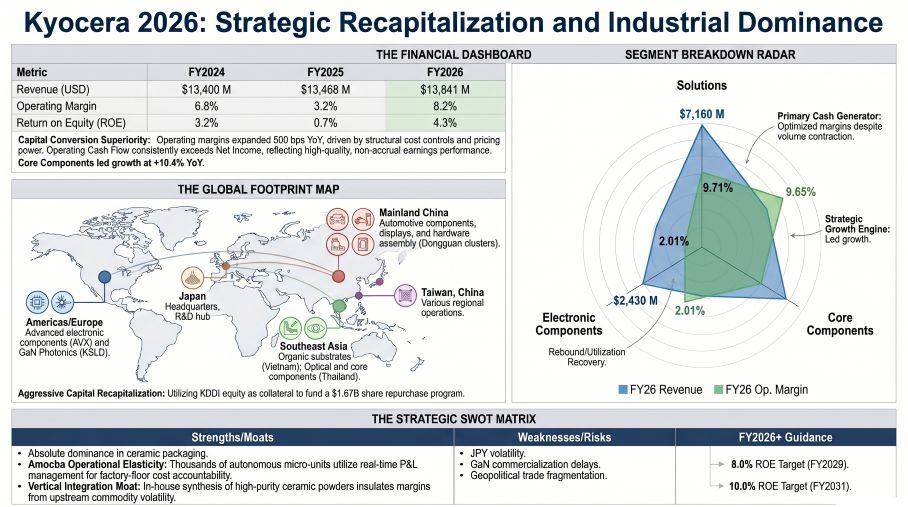
* Kyocera Corporation [TYO: 6971] expanded consolidated FY2026 operating profit margins by 499 basis points to 8.16% ($1,129.89 M OP), driven by a 933-bps margin expansion in Core Components ($4,368.76 M revenue) and a 41% operating profit surge in Solutions despite a 1.4% top-line contraction.
* Management authorized a $1,671.5 million (250,000 million JPY) share repurchase framework, funded via collateralizing 562.13 million shares of KDDI Corporation [TYO: 9433], targeting an ROE expansion from 4.3% in FY26 to 10.0% by March 2031.
* The firm is preemptively mitigating global trade friction by shifting inventory structures (+8.4% raw materials; -10.4% finished goods) and enforcing Responsible Business Alliance (RBA) and August 2024 EU regulatory compliance across decentralized nodes like Kyocera Vietnam Co., Ltd. and Kyocera Europe GmbH.
Figure Kyocera 2026: Strategic Recapitalization and Industrial Dominance
 Segmental Realities and Corporate Margin Architecture
Based on the FY2026 disclosures (Year Ended March 31, 2026, pegged at 1 USD = 149.5686 JPY), Kyocera Corporation engineered a sharp V-shaped profitability recovery without relying on heavy volume expansion. Consolidated revenue grew 2.8% to $13,841.1 million, while total operating profit expanded 499 bps to $1,129.89 million.
The firm’s internal architecture relies on decentralized "Amoeba" management nodes that autonomously adjusted production to match end-market cyclicality. Management maintained strict capital discipline, contracting investing cash outflows from $1,006.1 million (150,481 million JPY) in FY25 to $498.4 million (74,539 million JPY) in FY26, halving capital expenditure run-rates while holding research and development (R&D) expenses flat at $773.6 million (115,701 million JPY), representing 5.6% of total revenue compared to $776.1 million (116,087 million JPY) or 5.8% in FY25.
Table FY2026 Segmental Financial Performance
The Core Components segment acts as the primary top-line engine, containing the Semiconductor Related Components sub-segment, which alone generated $2,536.8 million (379,432 million JPY) or roughly 58% of the division's total revenue. Concurrently, the Electronic Components segment executed a 790% operating profit rebound from a depressed 0.23% margin in FY25. The geographic revenue split demonstrates sustained global diversification: Japan (~30%), the Americas (~18%), Europe (~17%), and Asia (~12%).
Working Capital and Credit Diagnostics
Kyocera Corporation’s balance sheet optimization reveals aggressive downstream clearing and upstream stockpiling. Total capital tied up in inventory remained effectively flat (+0.03%) at $3,490.07 million (522,004 million JPY). However, the internal composition shifted drastically:
* Raw Materials & Supplies: Expanded 8.4% to $1,213.60 million (181,516 million JPY) from $1,119.84 million.
* Work-in-Process (WIP): Expanded 7.2% to $937.19 million (140,174 million JPY) from $873.89 million.
* Finished Goods & Merchandise: Contracted 10.4% to $1,339.28 million (200,314 million JPY) from $1,495.05 million.
Credit default metrics confirm pristine health among downstream B2B buyers. Gross trade and other receivables contracted 0.1% to $2,576.06 million (385,298 million JPY), while the allowance for doubtful accounts rose 1.4% to $20.99 million (3,140 million JPY). Net trade receivables stood at $2,555.07 million (382,158 million JPY). The credit default coverage ratio expanded by a marginal 1 basis point to 0.81%, an exceptionally low expected default threshold for industrial manufacturers.
Infrastructure Layout and Regional Moats
Kyocera Corporation maintains a decentralized, highly localized manufacturing topology to mitigate geopolitical risk, tariff exposure, and localized infrastructure disruptions. This footprint is explicitly governed by the internal Risk Management Committee to enforce compliance with RBA parameters and August 2024 European Union operational mandates.
The firm’s global supply chain is physically structured across the following regional hubs:
* Mainland China: A massive high-volume assembly base including Dongguan Shilong Kyocera Co., Ltd. (automotive cameras, displays, tools), Kyocera Document Technology (Dongguan) Co., Ltd. (printers/MFPs), and Kyocera (China) Sales & Trading Corporation.
* Southeast Asia & Rest of Asia: Functioning as a regional risk hedge and direct supplier of organic substrates and core components via Kyocera Vietnam Co., Ltd., Kyocera Document Technology Vietnam Co., Ltd., and Kyocera (Thailand) Co., Ltd. Broader regional distribution is managed by Kyocera Korea Co., Ltd. and Kyocera Asia Pacific Pte. Ltd. (Singapore).
* The Americas: Dominated by Kyocera International, Inc., Kyocera AVX Components Corporation (electronic components), Kyocera SGS Precision Tools / Senco Industrial Tools, and Kyocera SLD Laser, Inc.
* Europe: Operations tailored for localized document solutions and precision tooling via Kyocera Europe GmbH, TA Triumph-Adler GmbH (Germany), and Kyocera Unimerco Tooling A/S (Denmark).
Beyond its physical properties, Kyocera Corporation secures downstream channel access via structural equity cross-holdings. The company controls 63.5 million shares in SPCG Public Company Limited (Thailand) and 2.08 million shares in NaITO, securing critical Southeast Asian infrastructure and industrial tooling ecosystems. Furthermore, management targets a 46% reduction in Scope 1, 2, and 3 GHG emissions by the fiscal year ending March 2031 (against an FY2020 baseline) alongside a 60% Renewable Energy (RE60) integration rate to neutralize future carbon-tax liabilities, anchoring a pathway to carbon neutrality by FY2051.
HDIN Institutional Verdict
Kyocera Corporation is systematically dismantling its historically stagnant balance sheet. Management’s decision to collateralize a portion of its 562,133,600 KDDI Corporation shares to access cheap corporate debt is a masterclass in capital efficiency. This financial engineering funds a massive $1,671.5 million share repurchase program (authorized April 30, 2026) and a 52.00 JPY dividend (adjusted upward from 50.00 JPY in FY25) without relinquishing KDDI dividend streams or voting influence. This explicit execution underpins management's commitment to drive ROE from an underperforming 4.3% in FY26 to a targeted 8.0% by March 2029, and 10.0% by March 2031.
However, Kyocera Corporation's inorganic M&A execution remains a structural liability. The firm recognized a severe $391.0 million (58,488 million JPY) goodwill impairment on Kyocera SLD Laser, Inc. The delayed commercialization of bleeding-edge Gallium Nitride (GaN) photonics exposes a vulnerability in post-merger integration (PMI) of deep-tech assets. To counter operational bloat in legacy hardware, the firm successfully carved out Kyocera Industrial Tools, Inc., shifting execution to a 33.0% equity-method joint venture (TL Sapphire Holdings, Inc.) with Truelink Capital Management, LLC. This combination of asset-light restructuring in industrial tools, debt-funded equity compression, and upstream material stockpiling positions Kyocera Corporation to violently defend its oligopolistic margins during the upcoming 5G and AI semiconductor packaging cycle.
Presentation Download & Video Access:
- Presentation Download: Click the PDF download link under 'Related Topics' to access the full institutional presentation of this report.
- Video Link: Click this link to watch the HDIN analyst briefing on YouTube.
About HDIN Research:
HDIN Research is a premier global market intelligence and strategic advisory firm specializing in institutional-grade financial analysis, supply chain audits, and macroeconomic forecasting. Our dedicated sector analysts deliver actionable, data-driven insights tailored for private equity, hedge funds, and corporate strategy teams. Visit us at http://www.hdinresearch.com.
2026 AI Transparency Footer:
"This intelligence report was authored by HDIN Research analysts following a rigorous audit of official corporate filings. AI was utilized for massive-scale data synthesis and structural drafting, ensuring 100% inclusion of reported data points. All strategic insights, financial modeling, and final verdicts were verified by our editorial board to ensure professional accuracy and compliance with 2026 Google Search E-E-A-T standards."
* Kyocera Corporation [TYO: 6971] expanded consolidated FY2026 operating profit margins by 499 basis points to 8.16% ($1,129.89 M OP), driven by a 933-bps margin expansion in Core Components ($4,368.76 M revenue) and a 41% operating profit surge in Solutions despite a 1.4% top-line contraction.
* Management authorized a $1,671.5 million (250,000 million JPY) share repurchase framework, funded via collateralizing 562.13 million shares of KDDI Corporation [TYO: 9433], targeting an ROE expansion from 4.3% in FY26 to 10.0% by March 2031.
* The firm is preemptively mitigating global trade friction by shifting inventory structures (+8.4% raw materials; -10.4% finished goods) and enforcing Responsible Business Alliance (RBA) and August 2024 EU regulatory compliance across decentralized nodes like Kyocera Vietnam Co., Ltd. and Kyocera Europe GmbH.
Figure Kyocera 2026: Strategic Recapitalization and Industrial Dominance
Segmental Realities and Corporate Margin ArchitectureBased on the FY2026 disclosures (Year Ended March 31, 2026, pegged at 1 USD = 149.5686 JPY), Kyocera Corporation engineered a sharp V-shaped profitability recovery without relying on heavy volume expansion. Consolidated revenue grew 2.8% to $13,841.1 million, while total operating profit expanded 499 bps to $1,129.89 million.
The firm’s internal architecture relies on decentralized "Amoeba" management nodes that autonomously adjusted production to match end-market cyclicality. Management maintained strict capital discipline, contracting investing cash outflows from $1,006.1 million (150,481 million JPY) in FY25 to $498.4 million (74,539 million JPY) in FY26, halving capital expenditure run-rates while holding research and development (R&D) expenses flat at $773.6 million (115,701 million JPY), representing 5.6% of total revenue compared to $776.1 million (116,087 million JPY) or 5.8% in FY25.
Table FY2026 Segmental Financial Performance
| Business Segment | FY26 Revenue ($M) | FY26 Operating Profit ($M) | FY26 OP Margin (%) | Proportion of Segment OP* |
| Core Components | $4,368.76 | $421.76 | 9.65% | 36.2% |
| Electronic Components | $2,430.23 | $48.91 | 2.01% | 4.2% |
| Solutions | $7,159.92 | $694.95 | 9.71% | 59.6% |
| Segment Total (Pre-Adj.) | $13,958.91 | $1,165.62 | 8.35% | 100.0% |
The Core Components segment acts as the primary top-line engine, containing the Semiconductor Related Components sub-segment, which alone generated $2,536.8 million (379,432 million JPY) or roughly 58% of the division's total revenue. Concurrently, the Electronic Components segment executed a 790% operating profit rebound from a depressed 0.23% margin in FY25. The geographic revenue split demonstrates sustained global diversification: Japan (~30%), the Americas (~18%), Europe (~17%), and Asia (~12%).
Working Capital and Credit Diagnostics
Kyocera Corporation’s balance sheet optimization reveals aggressive downstream clearing and upstream stockpiling. Total capital tied up in inventory remained effectively flat (+0.03%) at $3,490.07 million (522,004 million JPY). However, the internal composition shifted drastically:
* Raw Materials & Supplies: Expanded 8.4% to $1,213.60 million (181,516 million JPY) from $1,119.84 million.
* Work-in-Process (WIP): Expanded 7.2% to $937.19 million (140,174 million JPY) from $873.89 million.
* Finished Goods & Merchandise: Contracted 10.4% to $1,339.28 million (200,314 million JPY) from $1,495.05 million.
Credit default metrics confirm pristine health among downstream B2B buyers. Gross trade and other receivables contracted 0.1% to $2,576.06 million (385,298 million JPY), while the allowance for doubtful accounts rose 1.4% to $20.99 million (3,140 million JPY). Net trade receivables stood at $2,555.07 million (382,158 million JPY). The credit default coverage ratio expanded by a marginal 1 basis point to 0.81%, an exceptionally low expected default threshold for industrial manufacturers.
Infrastructure Layout and Regional Moats
Kyocera Corporation maintains a decentralized, highly localized manufacturing topology to mitigate geopolitical risk, tariff exposure, and localized infrastructure disruptions. This footprint is explicitly governed by the internal Risk Management Committee to enforce compliance with RBA parameters and August 2024 European Union operational mandates.
The firm’s global supply chain is physically structured across the following regional hubs:
* Mainland China: A massive high-volume assembly base including Dongguan Shilong Kyocera Co., Ltd. (automotive cameras, displays, tools), Kyocera Document Technology (Dongguan) Co., Ltd. (printers/MFPs), and Kyocera (China) Sales & Trading Corporation.
* Southeast Asia & Rest of Asia: Functioning as a regional risk hedge and direct supplier of organic substrates and core components via Kyocera Vietnam Co., Ltd., Kyocera Document Technology Vietnam Co., Ltd., and Kyocera (Thailand) Co., Ltd. Broader regional distribution is managed by Kyocera Korea Co., Ltd. and Kyocera Asia Pacific Pte. Ltd. (Singapore).
* The Americas: Dominated by Kyocera International, Inc., Kyocera AVX Components Corporation (electronic components), Kyocera SGS Precision Tools / Senco Industrial Tools, and Kyocera SLD Laser, Inc.
* Europe: Operations tailored for localized document solutions and precision tooling via Kyocera Europe GmbH, TA Triumph-Adler GmbH (Germany), and Kyocera Unimerco Tooling A/S (Denmark).
Beyond its physical properties, Kyocera Corporation secures downstream channel access via structural equity cross-holdings. The company controls 63.5 million shares in SPCG Public Company Limited (Thailand) and 2.08 million shares in NaITO, securing critical Southeast Asian infrastructure and industrial tooling ecosystems. Furthermore, management targets a 46% reduction in Scope 1, 2, and 3 GHG emissions by the fiscal year ending March 2031 (against an FY2020 baseline) alongside a 60% Renewable Energy (RE60) integration rate to neutralize future carbon-tax liabilities, anchoring a pathway to carbon neutrality by FY2051.
HDIN Institutional Verdict
Kyocera Corporation is systematically dismantling its historically stagnant balance sheet. Management’s decision to collateralize a portion of its 562,133,600 KDDI Corporation shares to access cheap corporate debt is a masterclass in capital efficiency. This financial engineering funds a massive $1,671.5 million share repurchase program (authorized April 30, 2026) and a 52.00 JPY dividend (adjusted upward from 50.00 JPY in FY25) without relinquishing KDDI dividend streams or voting influence. This explicit execution underpins management's commitment to drive ROE from an underperforming 4.3% in FY26 to a targeted 8.0% by March 2029, and 10.0% by March 2031.
However, Kyocera Corporation's inorganic M&A execution remains a structural liability. The firm recognized a severe $391.0 million (58,488 million JPY) goodwill impairment on Kyocera SLD Laser, Inc. The delayed commercialization of bleeding-edge Gallium Nitride (GaN) photonics exposes a vulnerability in post-merger integration (PMI) of deep-tech assets. To counter operational bloat in legacy hardware, the firm successfully carved out Kyocera Industrial Tools, Inc., shifting execution to a 33.0% equity-method joint venture (TL Sapphire Holdings, Inc.) with Truelink Capital Management, LLC. This combination of asset-light restructuring in industrial tools, debt-funded equity compression, and upstream material stockpiling positions Kyocera Corporation to violently defend its oligopolistic margins during the upcoming 5G and AI semiconductor packaging cycle.
Presentation Download & Video Access:
- Presentation Download: Click the PDF download link under 'Related Topics' to access the full institutional presentation of this report.
- Video Link: Click this link to watch the HDIN analyst briefing on YouTube.
About HDIN Research:
HDIN Research is a premier global market intelligence and strategic advisory firm specializing in institutional-grade financial analysis, supply chain audits, and macroeconomic forecasting. Our dedicated sector analysts deliver actionable, data-driven insights tailored for private equity, hedge funds, and corporate strategy teams. Visit us at http://www.hdinresearch.com.
2026 AI Transparency Footer:
"This intelligence report was authored by HDIN Research analysts following a rigorous audit of official corporate filings. AI was utilized for massive-scale data synthesis and structural drafting, ensuring 100% inclusion of reported data points. All strategic insights, financial modeling, and final verdicts were verified by our editorial board to ensure professional accuracy and compliance with 2026 Google Search E-E-A-T standards."