Yakult Honsha Co., Ltd.: Domestic Direct-to-Consumer Margin Collapse Offsets Asia/Oceania Growth as 127.7-Day Inventory Points to Demand Stagnation
Date : 2026-06-23
Reading : 194
HDIN Executive Takeaways
* Yakult Honsha Co., Ltd. [TYO: 2267] reported a 180-basis-point consolidated operating margin compression to 9.3%, driven by a 26.1% profit drop in the Japan Food & Beverages segment amid rigid direct-to-consumer overhead.
* The Asia/Oceania geography delivered a 16.8% operating profit expansion to $84.3 million, offsetting a 75.3% collapse in equity-method yields across localized joint ventures in Thailand, Korea, and the Philippines.
* Management executed $120.35 million in share buybacks and retired 33.8 million treasury shares to mitigate a 200-basis-point Return on Assets decline, masking a $41.9 million expansion in unfunded pension liabilities.
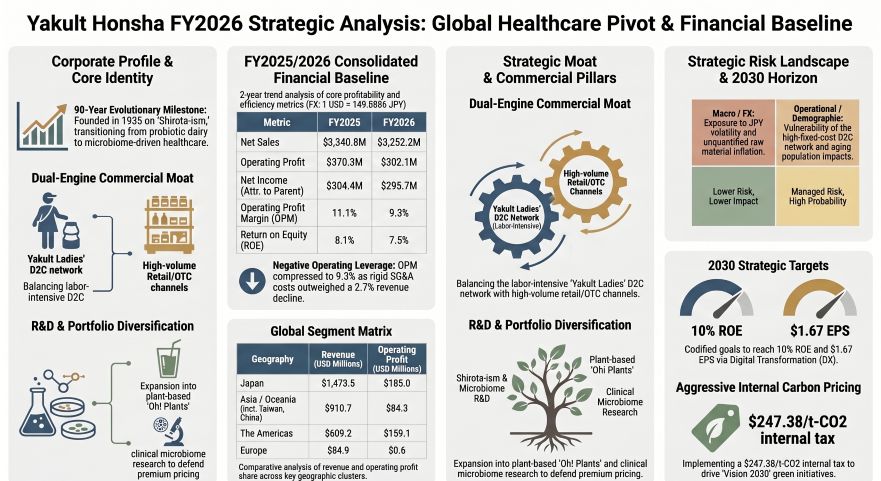
Figure Yakult Honsha FY2026 Strategic Analysis: Global Healthcare Pivot & Financial Baseline
 Segmental Realities and Margin Compression
Yakult Honsha Co., Ltd. is navigating a severe structural compression in operating profitability. Despite stable direct procurement costs, the firm’s reliance on rigid Selling, General, and Administrative (SG&A) expenses amid contracting sales volumes has generated negative operating leverage. Consolidated revenue contracted 2.7% year-over-year, declining from $3,340.8 million (¥499,683 million) in FY2025 to $3,252.2 million (¥486,425 million) in FY2026. All financial data utilizes the mandated FY2025 average translation rate of 1 USD = 149.5686 JPY.
Cost of Goods Sold (COGS) contracted from $1,365.0 million (¥204,163 million) to $1,338.4 million (¥200,189 million), resulting in a gross profit decline from $1,975.8 million to $1,913.7 million. The gross margin compressed 30 basis points from 59.1% to 58.8%. Concurrently, absolute SG&A expenses rose from $1,605.5 million to $1,611.6 million, driving a 18.4% decline in operating profit from $370.3 million (¥55,391 million) to $302.1 million (¥45,185 million). The consolidated operating margin contracted 180 basis points from 11.1% to 9.3%.
Table 1: Segment Profit Pool Decomposition
Table 2: Geographic Profit Pool Decomposition
Note: Geographies listed below account for international operations and specific regional breakdowns.
The total consolidated net profit base before Non-Controlling Interests (NCI) declined 9.2% from $366.08 million (¥54,754 million) to $332.22 million (¥49,689 million). NCI profit leakage collapsed 40.8% from $61.65 million (¥9,221 million) to $36.51 million (¥5,461 million), compressing the leakage rate from 16.8% to 11.0%. Consequently, net profit attributable to owners declined 2.9% from $304.4 million (¥45,533 million) to $295.7 million (¥44,228 million), holding a flat net margin of 9.1%.
Cash Flow and Asset Valuation Degradation:
Operating Cash Flow (OCF) dropped from $566.2 million (¥84,687 million) to $348.5 million (¥52,121 million), dragging the earnings quality ratio (OCF/Net Income) from 1.86x down to 1.18x. Cash outflows from investing activities contracted from $408.0 million (¥61,020 million) to $260.8 million (¥39,008 million), effectively halving Free Cash Flow from $158.2 million to $87.7 million.
Property, Plant, and Equipment (PPE) impairment losses normalized to zero in FY2026, following a $7.4 million (¥1,108 million) hit in FY2025. Losses on fixed asset retirements reached $2.6 million (¥396 million). However, losses on the valuation of investment securities surged 5,225% from $0.1 million (¥16 million) to $5.7 million (¥852 million). Share of profit from equity-method entities plummeted 75.3% from $9.16 million (¥1,370 million) to $2.27 million (¥339 million).
Infrastructure Layout and Regional Moats
Yakult Honsha Co., Ltd. operates a highly decentralized, short-shelf-life manufacturing base. The domestic production network is anchored by six primary nodes: Iwate Yakult Factory Co., Ltd., Chiba Yakult Factory Co., Ltd., Fuji Susono Yakult Factory Co., Ltd., Aichi Yakult Factory Co., Ltd., Okayama Wake Yakult Factory Co., Ltd., and Fukuoka Yakult Factory Co., Ltd.
The firm's commercial architecture is heavily reliant on the proprietary direct-to-consumer "Yakult Ladies" distribution channel, which currently distributes the flagship "Yakult 1000" and retail-targeted "Y1000" series. Overseas market penetration is structured via localized subsidiaries and joint ventures, including Indo Yakult Danone Co., Ltd., Korea Yakult Co., Ltd., Philippines Yakult Co., Ltd., Taiwan Yakult Co., Ltd. (mapping operations in Taiwan, China), and Thai Yakult Co., Ltd. Scientific validation and IP generation are managed through hubs such as the Yakult European R&D Center B.V. and the Shirota Protection Bacteria Research Institute, established in 1935. R&D capital allocation expanded 3.6% from $62.8 million (¥9,398 million) to $65.1 million (¥9,733 million), funding clinical validation in journals including *Bioscience of Microbiota*, *Beneficial Microbes*, *Gastroenterology*, and *The Journal of Nutrition*. The R&D pipeline is aggressively segmenting the functional beverage category via the "Oh! Plants" and "Yakult Vitals" brands.
Environmental compliance architecture is framed around the ISCC PLUS certification
Intergovernmental Panel on Climate Change (IPCC), Task Force on Climate-related Financial Disclosures (TCFD), Taskforce on Nature-related Financial Disclosures (TNFD), and Science Based Targets initiative (SBTi). Corporate governance tracks a 2024 emissions volume of 17,000t and deploys an Internal Carbon Pricing (ICP) mechanism at ¥37,000 per ton of CO2 ($247.38/t-CO2). The firm targets 20% and 100% recycling/reduction milestones by 2030 under the "Yakult Group Global Vision 2030".
HDIN Institutional Verdict
The operational data indicates structural demand stagnation for the core "Yakult 1000" series. Inventory compositional metrics confirm severe supply chain friction. While raw materials and supplies contracted 11.3% from $91.3 million (¥13,649 million) to $80.9 million (¥12,101 million), Work in Process (WIP) jumped 10.0% from $139.4 million (¥20,845 million) to $153.3 million (¥22,930 million). Finished goods inventory drifted up from $230.6 million (¥34,494 million) to $234.2 million (¥35,031 million). Consequently, total ending inventory expanded from $461.2 million (¥68,988 million) to $468.4 million (¥70,062 million), extending inventory turnover days from 123.3 days to 127.7 days—a 4.5-day expansion that severely penalizes a short-shelf-life dairy operator.
To offset the operational deceleration, the 13-director board (advised by the Nomination and Remuneration Advisory Committee and the Sustainability Advisory Committee) utilized balance sheet liquidity for equity base contraction. Long-term borrowings deleveraged 15.2% from $56.7 million (¥8,488 million) to $48.1 million (¥7,196 million), and short-term borrowings fell from $37.2 million (¥5,565 million) to $20.5 million (¥3,064 million). However, non-current lease obligations expanded 19.7% from $30.2 million (¥4,512 million) to $36.1 million (¥5,401 million), and net defined benefit pension liabilities surged 18.5% (a $41.9 million expansion) from $226.4 million (¥33,862 million) to $268.3 million (¥40,127 million).
Total assets bloated from $5,778.7 million (¥864,317 million) to $6,101.4 million (¥912,578 million), while net equity expanded from $4,208.9 million to $4,374.7 million, pushing the equity multiplier from 1.37x to 1.39x. Return on Assets (ROA) dropped from 8.9% to 6.9%, and Return on Equity (ROE) fell from 8.1% to 7.5%, widening the deficit against the 10% ROE and $1.67 (¥250) EPS target mandated by 2030.
In response, the firm authorized two major treasury stock acquisitions: a May 2025 program for 14.0 million shares at $200.58 million (¥30.0 billion) and a February 2026 program for 7.5 million shares at $100.29 million (¥15.0 billion). Management executed 5.02 million shares at $100.29 million (¥15.0 billion) under the first tranche, and 1.14 million shares at $20.06 million (¥3.0 billion) under the second. The firm cancelled 10.1 million shares in May 2025 and 23.7 million shares in February 2026, following a 2-for-1 stock split in October 2023. Concurrently, the annual dividend per share was hiked from $0.43 (¥64.00) to $0.47 (¥70.00), utilizing an interim payout of $0.22 (¥33.00) and a final payout of $0.25 (¥37.00). The implementation of a "2025 Restricted Stock Compensation" program aims to align executive performance, yet Yakult Honsha Co., Ltd. recorded a Total Shareholder Return (TSR) of 104.7%, severely lagging the TOPIX benchmark TSR of 180.6%. Until the firm implements the quantified Digital Transformation (DX) cost-savings required to right-size the "Yakult Ladies" network, the 127.7-day inventory buildup and $268.3 million pension liability will act as structural caps on enterprise value.
Presentation Download & Video Access:
- Presentation Download: Click the PDF download link under 'Related Topics' to access the full institutional presentation of this report.
- Video Link: Click this link to watch the HDIN analyst briefing on YouTube.
About HDIN Research:
HDIN Research is a premier global market intelligence and strategic advisory firm specializing in institutional-grade financial analysis, supply chain audits, and macroeconomic forecasting. Our dedicated sector analysts deliver actionable, data-driven insights tailored for private equity, hedge funds, and corporate strategy teams. Visit us at http://www.hdinresearch.com.
*2026 AI Transparency Footer:*
"This intelligence report was authored by HDIN Research analysts following a rigorous audit of official corporate filings. AI was utilized for massive-scale data synthesis and structural drafting, ensuring 100% inclusion of reported data points. All strategic insights, financial modeling, and final verdicts were verified by our editorial board to ensure professional accuracy and compliance with 2026 Google Search E-E-A-T standards."
* Yakult Honsha Co., Ltd. [TYO: 2267] reported a 180-basis-point consolidated operating margin compression to 9.3%, driven by a 26.1% profit drop in the Japan Food & Beverages segment amid rigid direct-to-consumer overhead.
* The Asia/Oceania geography delivered a 16.8% operating profit expansion to $84.3 million, offsetting a 75.3% collapse in equity-method yields across localized joint ventures in Thailand, Korea, and the Philippines.
* Management executed $120.35 million in share buybacks and retired 33.8 million treasury shares to mitigate a 200-basis-point Return on Assets decline, masking a $41.9 million expansion in unfunded pension liabilities.
Figure Yakult Honsha FY2026 Strategic Analysis: Global Healthcare Pivot & Financial Baseline
Segmental Realities and Margin CompressionYakult Honsha Co., Ltd. is navigating a severe structural compression in operating profitability. Despite stable direct procurement costs, the firm’s reliance on rigid Selling, General, and Administrative (SG&A) expenses amid contracting sales volumes has generated negative operating leverage. Consolidated revenue contracted 2.7% year-over-year, declining from $3,340.8 million (¥499,683 million) in FY2025 to $3,252.2 million (¥486,425 million) in FY2026. All financial data utilizes the mandated FY2025 average translation rate of 1 USD = 149.5686 JPY.
Cost of Goods Sold (COGS) contracted from $1,365.0 million (¥204,163 million) to $1,338.4 million (¥200,189 million), resulting in a gross profit decline from $1,975.8 million to $1,913.7 million. The gross margin compressed 30 basis points from 59.1% to 58.8%. Concurrently, absolute SG&A expenses rose from $1,605.5 million to $1,611.6 million, driving a 18.4% decline in operating profit from $370.3 million (¥55,391 million) to $302.1 million (¥45,185 million). The consolidated operating margin contracted 180 basis points from 11.1% to 9.3%.
Table 1: Segment Profit Pool Decomposition
| Business Segment | Revenue (FY24/25) | Revenue (FY25/26) | YoY Growth | OP (FY24/25) | OP (FY25/26) | YoY OP Growth | OP Margin (FY25) | OP Margin (FY26) | Margin Delta |
| F&B (Japan) |
$1,563.5 M (¥233,847M) |
$1,473.5 M (¥220,386M) |
-5.8% |
$250.5 M (¥37,464M) |
$185.0 M (¥27,668M) |
-26.1% | 16.02% | 12.56% | -347 bps |
| F&B (Overseas) |
$1,596.3 M (¥238,755M) |
$1,604.8 M (¥239,951M) |
+0.5% |
$245.8 M (¥36,706M) |
$240.0 M (¥35,904M) |
-2.3% | 15.40% | 14.96% | -44 bps |
| Pharma, Cosmetics & Others |
$181.0 M (¥27,078M) |
$173.9 M (¥26,014M) |
-3.9% |
$15.7 M (¥2,348M) |
$16.0 M (¥2,398M) |
+1.9% | 8.67% | 9.20% | +53 bps |
| Segment Total | $3,340.8 M | $3,252.2 M | -2.7% | $512.0 M | $441.0 M | -13.9% | 15.33% | 13.56% | -177 bps |
Table 2: Geographic Profit Pool Decomposition
| Region | Revenue (FY24/25) | Revenue (FY25/26) | YoY Growth | OP (FY24/25) | OP (FY25/26) | YoY OP Growth | OP Margin (FY25) | OP Margin (FY26) | Margin Delta |
| Americas |
$613.9 M (¥91,822M) |
$609.2 M (¥91,120M) |
-0.8% | $172.3 M | $159.1 M | -7.7% | 28.07% | 26.12% | -195 bps |
| Asia / Oceania |
$901.3 M (¥134,803M) |
$910.7 M (¥136,209M) |
+1.0% |
$72.2 M (¥10,794M) |
$84.3 M (¥12,611M) |
+16.8% | 8.01% | 9.26% | +125 bps |
| Europe |
$81.1 M (¥12,130M) |
$84.9 M (¥12,694M) |
+4.7% | $1.0 M |
$0.6 M (¥91M) |
-40.0% | 1.23% | 0.71% | -52 bps |
The total consolidated net profit base before Non-Controlling Interests (NCI) declined 9.2% from $366.08 million (¥54,754 million) to $332.22 million (¥49,689 million). NCI profit leakage collapsed 40.8% from $61.65 million (¥9,221 million) to $36.51 million (¥5,461 million), compressing the leakage rate from 16.8% to 11.0%. Consequently, net profit attributable to owners declined 2.9% from $304.4 million (¥45,533 million) to $295.7 million (¥44,228 million), holding a flat net margin of 9.1%.
Cash Flow and Asset Valuation Degradation:
Operating Cash Flow (OCF) dropped from $566.2 million (¥84,687 million) to $348.5 million (¥52,121 million), dragging the earnings quality ratio (OCF/Net Income) from 1.86x down to 1.18x. Cash outflows from investing activities contracted from $408.0 million (¥61,020 million) to $260.8 million (¥39,008 million), effectively halving Free Cash Flow from $158.2 million to $87.7 million.
Property, Plant, and Equipment (PPE) impairment losses normalized to zero in FY2026, following a $7.4 million (¥1,108 million) hit in FY2025. Losses on fixed asset retirements reached $2.6 million (¥396 million). However, losses on the valuation of investment securities surged 5,225% from $0.1 million (¥16 million) to $5.7 million (¥852 million). Share of profit from equity-method entities plummeted 75.3% from $9.16 million (¥1,370 million) to $2.27 million (¥339 million).
Infrastructure Layout and Regional Moats
Yakult Honsha Co., Ltd. operates a highly decentralized, short-shelf-life manufacturing base. The domestic production network is anchored by six primary nodes: Iwate Yakult Factory Co., Ltd., Chiba Yakult Factory Co., Ltd., Fuji Susono Yakult Factory Co., Ltd., Aichi Yakult Factory Co., Ltd., Okayama Wake Yakult Factory Co., Ltd., and Fukuoka Yakult Factory Co., Ltd.
The firm's commercial architecture is heavily reliant on the proprietary direct-to-consumer "Yakult Ladies" distribution channel, which currently distributes the flagship "Yakult 1000" and retail-targeted "Y1000" series. Overseas market penetration is structured via localized subsidiaries and joint ventures, including Indo Yakult Danone Co., Ltd., Korea Yakult Co., Ltd., Philippines Yakult Co., Ltd., Taiwan Yakult Co., Ltd. (mapping operations in Taiwan, China), and Thai Yakult Co., Ltd. Scientific validation and IP generation are managed through hubs such as the Yakult European R&D Center B.V. and the Shirota Protection Bacteria Research Institute, established in 1935. R&D capital allocation expanded 3.6% from $62.8 million (¥9,398 million) to $65.1 million (¥9,733 million), funding clinical validation in journals including *Bioscience of Microbiota*, *Beneficial Microbes*, *Gastroenterology*, and *The Journal of Nutrition*. The R&D pipeline is aggressively segmenting the functional beverage category via the "Oh! Plants" and "Yakult Vitals" brands.
Environmental compliance architecture is framed around the ISCC PLUS certification
Intergovernmental Panel on Climate Change (IPCC), Task Force on Climate-related Financial Disclosures (TCFD), Taskforce on Nature-related Financial Disclosures (TNFD), and Science Based Targets initiative (SBTi). Corporate governance tracks a 2024 emissions volume of 17,000t and deploys an Internal Carbon Pricing (ICP) mechanism at ¥37,000 per ton of CO2 ($247.38/t-CO2). The firm targets 20% and 100% recycling/reduction milestones by 2030 under the "Yakult Group Global Vision 2030".
HDIN Institutional Verdict
The operational data indicates structural demand stagnation for the core "Yakult 1000" series. Inventory compositional metrics confirm severe supply chain friction. While raw materials and supplies contracted 11.3% from $91.3 million (¥13,649 million) to $80.9 million (¥12,101 million), Work in Process (WIP) jumped 10.0% from $139.4 million (¥20,845 million) to $153.3 million (¥22,930 million). Finished goods inventory drifted up from $230.6 million (¥34,494 million) to $234.2 million (¥35,031 million). Consequently, total ending inventory expanded from $461.2 million (¥68,988 million) to $468.4 million (¥70,062 million), extending inventory turnover days from 123.3 days to 127.7 days—a 4.5-day expansion that severely penalizes a short-shelf-life dairy operator.
To offset the operational deceleration, the 13-director board (advised by the Nomination and Remuneration Advisory Committee and the Sustainability Advisory Committee) utilized balance sheet liquidity for equity base contraction. Long-term borrowings deleveraged 15.2% from $56.7 million (¥8,488 million) to $48.1 million (¥7,196 million), and short-term borrowings fell from $37.2 million (¥5,565 million) to $20.5 million (¥3,064 million). However, non-current lease obligations expanded 19.7% from $30.2 million (¥4,512 million) to $36.1 million (¥5,401 million), and net defined benefit pension liabilities surged 18.5% (a $41.9 million expansion) from $226.4 million (¥33,862 million) to $268.3 million (¥40,127 million).
Total assets bloated from $5,778.7 million (¥864,317 million) to $6,101.4 million (¥912,578 million), while net equity expanded from $4,208.9 million to $4,374.7 million, pushing the equity multiplier from 1.37x to 1.39x. Return on Assets (ROA) dropped from 8.9% to 6.9%, and Return on Equity (ROE) fell from 8.1% to 7.5%, widening the deficit against the 10% ROE and $1.67 (¥250) EPS target mandated by 2030.
In response, the firm authorized two major treasury stock acquisitions: a May 2025 program for 14.0 million shares at $200.58 million (¥30.0 billion) and a February 2026 program for 7.5 million shares at $100.29 million (¥15.0 billion). Management executed 5.02 million shares at $100.29 million (¥15.0 billion) under the first tranche, and 1.14 million shares at $20.06 million (¥3.0 billion) under the second. The firm cancelled 10.1 million shares in May 2025 and 23.7 million shares in February 2026, following a 2-for-1 stock split in October 2023. Concurrently, the annual dividend per share was hiked from $0.43 (¥64.00) to $0.47 (¥70.00), utilizing an interim payout of $0.22 (¥33.00) and a final payout of $0.25 (¥37.00). The implementation of a "2025 Restricted Stock Compensation" program aims to align executive performance, yet Yakult Honsha Co., Ltd. recorded a Total Shareholder Return (TSR) of 104.7%, severely lagging the TOPIX benchmark TSR of 180.6%. Until the firm implements the quantified Digital Transformation (DX) cost-savings required to right-size the "Yakult Ladies" network, the 127.7-day inventory buildup and $268.3 million pension liability will act as structural caps on enterprise value.
Presentation Download & Video Access:
- Presentation Download: Click the PDF download link under 'Related Topics' to access the full institutional presentation of this report.
- Video Link: Click this link to watch the HDIN analyst briefing on YouTube.
About HDIN Research:
HDIN Research is a premier global market intelligence and strategic advisory firm specializing in institutional-grade financial analysis, supply chain audits, and macroeconomic forecasting. Our dedicated sector analysts deliver actionable, data-driven insights tailored for private equity, hedge funds, and corporate strategy teams. Visit us at http://www.hdinresearch.com.
*2026 AI Transparency Footer:*
"This intelligence report was authored by HDIN Research analysts following a rigorous audit of official corporate filings. AI was utilized for massive-scale data synthesis and structural drafting, ensuring 100% inclusion of reported data points. All strategic insights, financial modeling, and final verdicts were verified by our editorial board to ensure professional accuracy and compliance with 2026 Google Search E-E-A-T standards."