FANUC Corporation: 48.1% CapEx Contraction Near Japanese Hubs as 15.7% Operating Income Growth Signals Aggressive Yield Pivot
Date : 2026-06-25
Reading : 105
HDIN Executive Takeaways
* FANUC Corporation's net sales expanded 7.6% year-over-year to $5,735.4 million, driving a 15.7% operating income increase to $1,228.6 million by offsetting a 21.2% raw material inventory destocking.
* Centralized domestic manufacturing via FANUC Partronics and FANUC Servo limits upstream supply exposure, while localized service centers spanning the Americas to China secure a 16.5% recurring revenue baseline.
* Decelerating capital expenditures by 48.1% alongside a $755.4 million foreign exchange translation tailwind positions the firm to execute a targeted 60% dividend payout and a 10 million share repurchase authorization.
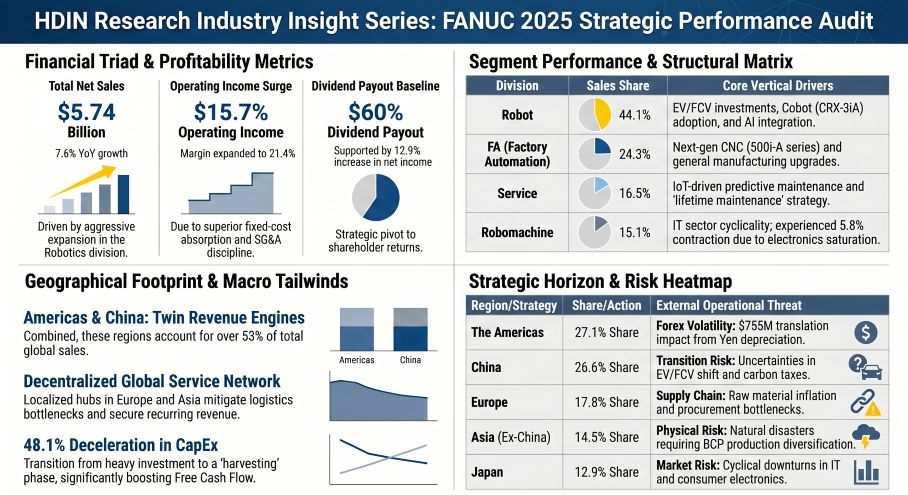
Figure FANUC 2025 Strategic Performance Audit
 Segmental Realities and Operating Leverage
FANUC Corporation [TYO: 6954] demonstrated top-line expansion and strict fixed-cost absorption during the fiscal year ending March 2026 (FY2025). Converted at the reporting exchange rate of 1 USD = 149.5686 JPY, total net sales grew 7.6% year-over-year (YoY). The Gross Profit Margin expanded by 130 basis points to 38.3%, supported by a reduction in Cost of Sales (COGS) as a percentage of total revenue from 63.0% to 61.7%.
While raw material costs escalated, the firm maintained operating leverage by compressing SG&A expenses from 17.1% to 16.9% of revenue. Research and Development (R&D) intensity similarly declined from 5.85% to 5.24% of net sales, indicating a commercialization phase of existing intellectual property rather than early-stage capital deployment.
Table 1: Income Statement Summary & Cost Breakdown
Table 2: Supplementary Cost & Expense Details
*Cost Structure Mix Shifts: Material costs expanded from 61.3% to 64.2% of total manufacturing costs. This inflation was counterbalanced by proportional declines in subcontracting (17.2% to 15.5%) and overhead (15.5% to 13.8%).*
Revenue Matrix: Segments and Geographies
The Robotics division acts as the primary growth engine, capturing Electric Vehicle (EV) and Fuel Cell Vehicle (FCV) capital expenditures. Conversely, the Robomachine segment faced cyclical contraction linked to Information Technology (IT) sector saturation.
* Robotics (44.1% mix): $2,531.35M / 378,610M JPY (+14.9% YoY)
* Factory Automation (24.3% mix): $1,393.86M / 208,478M JPY (+7.0% YoY)
* Service (16.5% mix): $943.67M / 141,143M JPY (+4.4% YoY vs FY2024 at $903.61M / 135,151M JPY)
* Robomachine (15.1% mix): $866.49M / 129,600M JPY (-5.8% YoY vs FY2024 at $920.00M / 137,588M JPY)
* The Americas: $1,552.16M / 232,154M JPY (27.06%)
* China: $1,526.90M / 228,376M JPY (26.62%)
* Europe: $1,018.74M / 152,371M JPY (17.76%)
* Asia (ex-China): $830.54M / 124,223M JPY (14.48%)
* Japan (Domestic): $740.68M / 110,782M JPY (12.91%)
* Others: $66.36M / 9,925M JPY (1.16%)
Infrastructure Layout and Regional Moats
FANUC bifurcates its operational model by centralizing hardware production domestically while decentralizing lifecycle services globally. To insulate downstream assembly from tier-1 component shortages, the firm utilizes wholly-owned Japanese subsidiaries, FANUC Partronics and FANUC Servo, to source internal electronics and motors.
Distribution and high-margin recurring services are routed through regional nodes, including FANUC America Corporation, FANUC Europe Corporation, BEIJING-FANUC Mechatronics, SHANGHAI-FANUC Robotics/Robomachine, KOREA FANUC CORPORATION, FANUC INDIA PRIVATE LIMITED, and TAIWAN FANUC CORPORATION.
Technological output reflects a structural pivot from closed-loop hardware to open-source IT integration. The firm deployed next-generation 500i-A and 503i-A series CNCs, α i-D servo systems, the heavy-duty R-2000/E, and the ultra-lightweight CRX-3iA collaborative robot. Software capabilities expanded via the FIELD system (FANUC Intelligent Edge Link and Drive) and the integration of ROS 2 (Robot Operating System), Python, and GitHub into the robotics matrix.
Governance protocols dictate aggressive mitigation of physical and transitional risks. The Board institutionalized a Business Continuity Plan (BCP) focused on the diversification of production bases and procurement to hedge against raw material cost volatility and natural disasters. Cyber infrastructure is governed by a Chief Information Security Officer (CISO), an internal Computer Security Incident Response Team (CSIRT), and a Product Security Incident Response Team (PSIRT). Concurrently, 20% of executive remuneration is tied to Environmental, Social, and Governance (ESG) targets, tracking Scope 1 and Scope 2 Greenhouse Gas reductions, the proportion of female management, male childcare leave acquisition rates, and gender wage differentials targeted for 2026 and 2030.
HDIN Institutional Verdict
FANUC is operating at peak asset utilization and capital efficiency. The near-total elimination of asset impairment charges ($0.20M / 30M JPY) on a $319.47M depreciation base confirms highly effective fixed-asset absorption.
The balance sheet reflects massive liquidity accumulation heavily subsidized by Japanese Yen depreciation. Total "Cash and Deposits" expanded 22.8% to $4,800.95M (718,071M JPY) from $3,948.05M (590,504M JPY), supplemented by Short-term Securities doubling to $239.35M (35,800M JPY) from $106.97M (16,000M JPY). Crucially, $755.40M (112,984M JPY) of this liquidity surge is derived from a positive foreign exchange translation difference on cash equivalents, up from $165.74M (24,790M JPY) in the prior year, alongside $72.92M (10,907M JPY) in non-operating FX gains (up from $63.33M / 9,472M JPY).
Working capital mechanics reveal an aggressive 21.2% upstream destocking of Raw Materials to $564.49M (84,430M JPY) from $715.91M (107,077M JPY), and a 5.1% drop in Work-in-Progress (WIP) to $528.09M (78,986M JPY) from $556.39M (83,219M JPY). Total inventory contracted 4.3% to $2,088.33M (312,349M JPY) from $2,181.05M (326,216M JPY), despite Finished Goods inventory rising 9.6% to $995.75M (148,933M JPY) from $908.75M (135,920M JPY).
Capital Allocation and Shareholder Yield
Return on Equity (ROE) expanded 70 basis points to 9.3% from 8.6%. This yield accretion is structurally guaranteed by the Board's decision to collapse capital expenditures by 48.1% to $141.6 million (21,181M JPY) from $272.8 million (40,805M JPY). Supported by stable operating cash flow of $1,677.5 million (250,896M JPY)—down marginally from $1,706.7 million (255,273M JPY)—management is aggressively redirecting Free Cash Flow to equity holders.
The firm executed a 60% dividend payout policy via two tranches totaling $668.13 million (99,932M JPY: 47,899M JPY and 52,033M JPY). Furthermore, matching the prior two fiscal cycles, the Board authorized a $334.30 million (50,000M JPY) share repurchase program for up to 10,000,000 shares executable through March 2027. Despite management citing TCFD-aligned physical risks and carbon tax uncertainties, this aggressive capital deployment strategy demonstrates absolute operational confidence in their recurring revenue floor.
Presentation Download & Video Access:
- Presentation Download: Click the PDF download link under 'Related Topics' to access the full institutional presentation of this report.
- Video Link: Click this link to watch the HDIN analyst briefing on YouTube.
About HDIN Research:
HDIN Research is a premier global market intelligence and strategic advisory firm specializing in institutional-grade financial analysis, supply chain audits, and macroeconomic forecasting. Our dedicated sector analysts deliver actionable, data-driven insights tailored for private equity, hedge funds, and corporate strategy teams. Visit us at http://www.hdinresearch.com.
*2026 AI Transparency Footer:*
"This intelligence report was authored by HDIN Research analysts following a rigorous audit of official corporate filings. AI was utilized for massive-scale data synthesis and structural drafting, ensuring 100% inclusion of reported data points. All strategic insights, financial modeling, and final verdicts were verified by our editorial board to ensure professional accuracy and compliance with 2026 Google Search E-E-A-T standards."
* FANUC Corporation's net sales expanded 7.6% year-over-year to $5,735.4 million, driving a 15.7% operating income increase to $1,228.6 million by offsetting a 21.2% raw material inventory destocking.
* Centralized domestic manufacturing via FANUC Partronics and FANUC Servo limits upstream supply exposure, while localized service centers spanning the Americas to China secure a 16.5% recurring revenue baseline.
* Decelerating capital expenditures by 48.1% alongside a $755.4 million foreign exchange translation tailwind positions the firm to execute a targeted 60% dividend payout and a 10 million share repurchase authorization.
Figure FANUC 2025 Strategic Performance Audit
Segmental Realities and Operating LeverageFANUC Corporation [TYO: 6954] demonstrated top-line expansion and strict fixed-cost absorption during the fiscal year ending March 2026 (FY2025). Converted at the reporting exchange rate of 1 USD = 149.5686 JPY, total net sales grew 7.6% year-over-year (YoY). The Gross Profit Margin expanded by 130 basis points to 38.3%, supported by a reduction in Cost of Sales (COGS) as a percentage of total revenue from 63.0% to 61.7%.
While raw material costs escalated, the firm maintained operating leverage by compressing SG&A expenses from 17.1% to 16.9% of revenue. Research and Development (R&D) intensity similarly declined from 5.85% to 5.24% of net sales, indicating a commercialization phase of existing intellectual property rather than early-stage capital deployment.
Table 1: Income Statement Summary & Cost Breakdown
| Financial Metric | FY2024 (USD) | FY2024 (JPY) | FY2025 (USD) | FY2025 (JPY) | YoY Delta (%) |
| Net Sales | $5,329.5M | ¥797,129M | $5,735.4M | ¥857,831M | +7.6% |
| Cost of Goods Sold (COGS) | $3,357.7M | ¥502,204M | $3,539.3M | ¥529,365M | +5.4% |
| Gross Profit | $1,971.8M | ¥294,925M | $2,196.1M | ¥328,466M | +11.4% |
| Selling, General & Administrative (SG&A) | $909.8M | ¥136,079M | $967.5M | ¥144,703M | +6.3% |
| Operating Income | $1,062.0M | ¥158,846M | $1,228.6M | ¥183,763M | +15.7% |
| Net Income | $986.6M | ¥147,557M | $1,113.5M | ¥166,543M | +12.9% |
Table 2: Supplementary Cost & Expense Details
| Cost Component / Expense | FY2024 (USD) | FY2024 (JPY) | FY2025 (USD) | FY2025 (JPY) | YoY Delta (%) |
| Total Manufacturing Costs | $2,308.0M | ¥345,202M | $2,585.1M | ¥386,651M | +12.0% |
| ↳ Material Costs | $1,415.7M | ¥211,742M | $1,659.4M | ¥248,200M | +17.2% |
| Research & Development (R&D) | $312.00M | ¥46,666M | $300.59M | ¥44,959M | -3.6% |
| Depreciation | $310.55M | ¥46,448M | $319.47M | ¥47,782M | +2.9% |
| Asset Impairment | $3.49M | ¥522M | $0.20M | ¥30M | -94.2% |
*Cost Structure Mix Shifts: Material costs expanded from 61.3% to 64.2% of total manufacturing costs. This inflation was counterbalanced by proportional declines in subcontracting (17.2% to 15.5%) and overhead (15.5% to 13.8%).*
Revenue Matrix: Segments and Geographies
The Robotics division acts as the primary growth engine, capturing Electric Vehicle (EV) and Fuel Cell Vehicle (FCV) capital expenditures. Conversely, the Robomachine segment faced cyclical contraction linked to Information Technology (IT) sector saturation.
* Robotics (44.1% mix): $2,531.35M / 378,610M JPY (+14.9% YoY)
* Factory Automation (24.3% mix): $1,393.86M / 208,478M JPY (+7.0% YoY)
* Service (16.5% mix): $943.67M / 141,143M JPY (+4.4% YoY vs FY2024 at $903.61M / 135,151M JPY)
* Robomachine (15.1% mix): $866.49M / 129,600M JPY (-5.8% YoY vs FY2024 at $920.00M / 137,588M JPY)
* The Americas: $1,552.16M / 232,154M JPY (27.06%)
* China: $1,526.90M / 228,376M JPY (26.62%)
* Europe: $1,018.74M / 152,371M JPY (17.76%)
* Asia (ex-China): $830.54M / 124,223M JPY (14.48%)
* Japan (Domestic): $740.68M / 110,782M JPY (12.91%)
* Others: $66.36M / 9,925M JPY (1.16%)
Infrastructure Layout and Regional Moats
FANUC bifurcates its operational model by centralizing hardware production domestically while decentralizing lifecycle services globally. To insulate downstream assembly from tier-1 component shortages, the firm utilizes wholly-owned Japanese subsidiaries, FANUC Partronics and FANUC Servo, to source internal electronics and motors.
Distribution and high-margin recurring services are routed through regional nodes, including FANUC America Corporation, FANUC Europe Corporation, BEIJING-FANUC Mechatronics, SHANGHAI-FANUC Robotics/Robomachine, KOREA FANUC CORPORATION, FANUC INDIA PRIVATE LIMITED, and TAIWAN FANUC CORPORATION.
Technological output reflects a structural pivot from closed-loop hardware to open-source IT integration. The firm deployed next-generation 500i-A and 503i-A series CNCs, α i-D servo systems, the heavy-duty R-2000/E, and the ultra-lightweight CRX-3iA collaborative robot. Software capabilities expanded via the FIELD system (FANUC Intelligent Edge Link and Drive) and the integration of ROS 2 (Robot Operating System), Python, and GitHub into the robotics matrix.
Governance protocols dictate aggressive mitigation of physical and transitional risks. The Board institutionalized a Business Continuity Plan (BCP) focused on the diversification of production bases and procurement to hedge against raw material cost volatility and natural disasters. Cyber infrastructure is governed by a Chief Information Security Officer (CISO), an internal Computer Security Incident Response Team (CSIRT), and a Product Security Incident Response Team (PSIRT). Concurrently, 20% of executive remuneration is tied to Environmental, Social, and Governance (ESG) targets, tracking Scope 1 and Scope 2 Greenhouse Gas reductions, the proportion of female management, male childcare leave acquisition rates, and gender wage differentials targeted for 2026 and 2030.
HDIN Institutional Verdict
FANUC is operating at peak asset utilization and capital efficiency. The near-total elimination of asset impairment charges ($0.20M / 30M JPY) on a $319.47M depreciation base confirms highly effective fixed-asset absorption.
The balance sheet reflects massive liquidity accumulation heavily subsidized by Japanese Yen depreciation. Total "Cash and Deposits" expanded 22.8% to $4,800.95M (718,071M JPY) from $3,948.05M (590,504M JPY), supplemented by Short-term Securities doubling to $239.35M (35,800M JPY) from $106.97M (16,000M JPY). Crucially, $755.40M (112,984M JPY) of this liquidity surge is derived from a positive foreign exchange translation difference on cash equivalents, up from $165.74M (24,790M JPY) in the prior year, alongside $72.92M (10,907M JPY) in non-operating FX gains (up from $63.33M / 9,472M JPY).
Working capital mechanics reveal an aggressive 21.2% upstream destocking of Raw Materials to $564.49M (84,430M JPY) from $715.91M (107,077M JPY), and a 5.1% drop in Work-in-Progress (WIP) to $528.09M (78,986M JPY) from $556.39M (83,219M JPY). Total inventory contracted 4.3% to $2,088.33M (312,349M JPY) from $2,181.05M (326,216M JPY), despite Finished Goods inventory rising 9.6% to $995.75M (148,933M JPY) from $908.75M (135,920M JPY).
Capital Allocation and Shareholder Yield
Return on Equity (ROE) expanded 70 basis points to 9.3% from 8.6%. This yield accretion is structurally guaranteed by the Board's decision to collapse capital expenditures by 48.1% to $141.6 million (21,181M JPY) from $272.8 million (40,805M JPY). Supported by stable operating cash flow of $1,677.5 million (250,896M JPY)—down marginally from $1,706.7 million (255,273M JPY)—management is aggressively redirecting Free Cash Flow to equity holders.
The firm executed a 60% dividend payout policy via two tranches totaling $668.13 million (99,932M JPY: 47,899M JPY and 52,033M JPY). Furthermore, matching the prior two fiscal cycles, the Board authorized a $334.30 million (50,000M JPY) share repurchase program for up to 10,000,000 shares executable through March 2027. Despite management citing TCFD-aligned physical risks and carbon tax uncertainties, this aggressive capital deployment strategy demonstrates absolute operational confidence in their recurring revenue floor.
Presentation Download & Video Access:
- Presentation Download: Click the PDF download link under 'Related Topics' to access the full institutional presentation of this report.
- Video Link: Click this link to watch the HDIN analyst briefing on YouTube.
About HDIN Research:
HDIN Research is a premier global market intelligence and strategic advisory firm specializing in institutional-grade financial analysis, supply chain audits, and macroeconomic forecasting. Our dedicated sector analysts deliver actionable, data-driven insights tailored for private equity, hedge funds, and corporate strategy teams. Visit us at http://www.hdinresearch.com.
*2026 AI Transparency Footer:*
"This intelligence report was authored by HDIN Research analysts following a rigorous audit of official corporate filings. AI was utilized for massive-scale data synthesis and structural drafting, ensuring 100% inclusion of reported data points. All strategic insights, financial modeling, and final verdicts were verified by our editorial board to ensure professional accuracy and compliance with 2026 Google Search E-E-A-T standards."