JEOL Ltd.: FY2026 Capital Realignment Near Tokyo Headquarters as 404-Day Inventory Cycle Secures 46.6% Semiconductor Lithography Margins
Date : 2026-06-25
Reading : 240
HDIN Executive Takeaways
* JEOL Ltd. forecasts an 8.8% top-line contraction to $1,199.14 million for FY2026, offset by a 59.6% net income recovery ($179.15 million), signaling the exhaustion of extraordinary non-operating losses amidst cooling semiconductor capital expenditure cycles.
* Management is actively stockpiling $712.70 million in inventory across centralized Japanese manufacturing hubs to insulate its monopolistic Electron Beam mask-writing duopoly against single-source procurement vulnerabilities.
* A structural shift toward a job-based compensation framework and Recruitment Process Outsourcing (RPO) delivered a 9.3% year-over-year expansion in operating profit per employee, directly combating Japanese demographic attrition constraints.
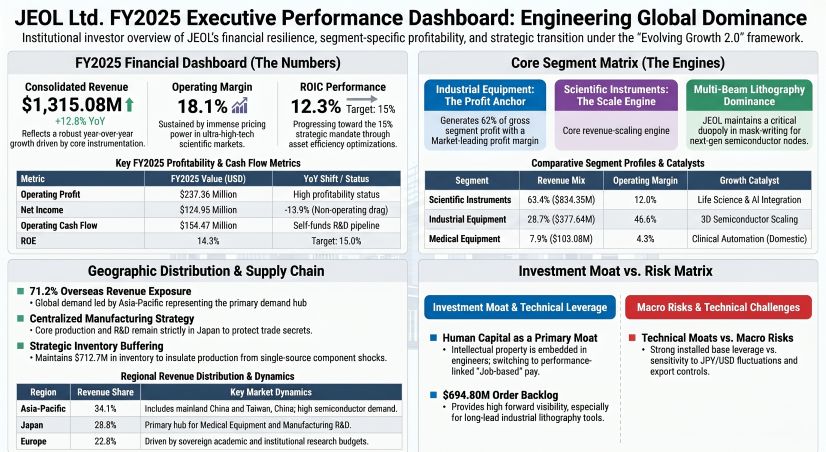
Figure JEOL Ltd FY2025 Executive Performance Dashboard: Engineering Global Dominance
 Segmental Realities and Margin Compression
JEOL Ltd. [TYO: 6951] operates a bifurcated financial architecture where scale is derived from legacy instrumentation, but enterprise value is strictly anchored by ultra-high-margin semiconductor lithography tools. For the fiscal year 2025, the firm reported consolidated revenue of $1,315.08 million (196,695 million JPY), representing a 12.8% year-over-year expansion. Gross profit finalized at $617.76 million (47.0% margin), flowing down to an operating profit of $237.36 million (18.1% margin). Despite core operational stability, net profit contracted by 13.9% year-over-year to $124.95 million, down from $145.11 million in FY2024, driven by extraordinary losses.
The firm's forward guidance for FY2026 anticipates a macroeconomic normalization cycle. Management projects revenue to contract 8.8% to $1,199.14 million (179,353 million JPY) and operating income to compress 16.9% to $191.28 million (28,610 million JPY). Conversely, net income is guided to accelerate 59.6% to $179.15 million (26,796 million JPY) as non-operating headwinds dissipate.
Table FY2025 Core Segmental Breakdown (Converted at 1 USD = 149.5686 JPY)
Consolidated FY2025 order intake reached $1,203.92 million (180,069 million JPY), backed by a production volume of $1,167.46 million (174,616 million JPY). Going into FY2026, total order intake is projected to contract 10.3% to $1,167.46 million (174,616 million JPY). However, forward visibility is insulated by a static total order backlog of $694.80 million (103,920 million JPY), matching 100.7% of the prior year's levels. The highly profitable Industrial Equipment segment commands $323.85 million (48,438 million JPY) of this backlog, reflecting a marginal 5.1% year-over-year contraction and equating to a stabilized 0.97 Book-to-Bill ratio.
Infrastructure Layout and Regional Moats
The geographic footprint of JEOL Ltd. highlights an overt dependency on Asian semiconductor foundries and western institutional research funding, with 71.2% of FY2025 revenue generated outside the domestic Japanese market.
* Asia-Pacific (incl. China & Taiwan, China): $448.27 million (34.1% of revenue). Driven by Spot Beam, Variable Shape Beam (VSB), and Multi-Beam lithography demand.
* Japan (Domestic): $379.04 million (28.8% of revenue). Dominates the lower-margin Medical Equipment sector.
* Europe: $299.43 million (22.8% of revenue). Anchored by deep institutional R&D funding for Transmission Electron Microscopes (TEM) and Nuclear Magnetic Resonance (NMR) tools.
* Americas: $188.32 million (14.3% of revenue).
To enforce strict quality control and protect unpatented intellectual property, precision manufacturing is aggressively centralized within Japan through subsidiaries including JEOL Yamagata Co., Ltd., Japan Superconductor Technology (JASTEC), Micro Electron Co., Ltd, and JEOL Techno Service Co., Ltd. Overseas subsidiaries operate strictly as sales and maintenance outposts: JEOL USA (104 employees), JEOL (EUROPE) SAS in France (72 employees), JEOL (U.K.) LTD (59 employees), alongside one specific overseas development unit, Integrated Dynamic Electron Solutions, Inc., in the United States.
Operational resilience relies on an intentional distortion of working capital efficiency. Entering FY2026, JEOL operates with a 392-day Cash Conversion Cycle (CCC). This is structured around 109 Days Sales Outstanding (DSO) and 121 Days Payable Outstanding (DPO), fundamentally dragged by an extreme 404 Days Inventory Outstanding (DIO). Management has bloated the balance sheet with $712.70 million (106,597 million JPY) in total inventory, offsetting an expected FY2026 Cost of Goods Sold of $644.01 million (96,323 million JPY).
This inventory stack consists of $114.63 million in raw materials, $260.41 million in finished goods, and $337.66 million (50,503 million JPY) in Work-In-Progress (WIP). The WIP figure represents a minor contraction from the FY2025 WIP of $345.77 million (51,717 million JPY), proving that internal manufacturing bottlenecks are clearing. The inventory expansion serves as a physical hedge against single-source component vulnerabilities flagged in the risk matrix. Trade receivables measure $357.62 million (53,489 million JPY) against trade payables of $214.12 million (32,025 million JPY).
HDIN Institutional Verdict
JEOL Ltd. maintains a fortress balance sheet operating with a positive economic spread. Generating a 12.3% Return on Invested Capital (ROIC) against a historical 6.0% to 8.0% Japanese corporate WACC, the firm inherently creates shareholder value. However, management trails the 15.0% ROIC and 15.0% Return on Equity (ROE) targets outlined in their "Evolving Growth 2.0 - A New Horizon" strategic framework, currently posting an ROE of 14.3% and a Return on Assets (ROA) of 8.4%.
The shortfall in capital efficiency is driven by ultra-conservative treasury allocations. With $1,487.52 million in total assets against $913.65 million in equity (61.4% equity ratio), the firm carries an essentially unlevered Debt-to-Equity ratio of 5.5%. Total interest-bearing debt rests at ~$50.70 million. Liquidity is excessive, holding a Current Ratio of 2.32x (Current Assets: $1,133.20 million; Current Liabilities: $488.04 million) and a Quick Ratio of 1.55x. In FY2025, operating cash flows of $154.47 million (23,104 million JPY) heavily outweighed CapEx of $39.50 million (5,908 million JPY). Yet, shareholder returns remain highly muted: dividends consumed a mere $10.50 million (1,570 million JPY), share buybacks were effectively zero ($0.01 million), and management opted to execute $16.49 million (2,467 million JPY) in unnecessary debt repayments.
Related-party risk is minimal. Borrowings from 7.5% stakeholder Mitsubishi UFJ Trust and Banking Corporation equaled $60.17 million (9,000 million JPY) across both FY2025 and FY2026, comprising $26.74 million (4,000 million JPY) in short-term and $33.43 million (5,000 million JPY) in long-term facilities for FY2026. Consolidated interest expense totaled $0.80 million in FY2025 and $0.89 million in FY2026, confirming these loans execute strictly at market-rate pricing. State subsidy reliance is effectively zero, with grant income falling from $0.75 million (112 million JPY) in FY2025 to $0 in the FY2026 guidance.
Competitively, JEOL utilizes a lean 6.63% R&D intensity—allocating $87.17 million (13,038 million JPY) in total R&D, of which $86.10 million (12,878 million JPY) is captured via SG&A—to fund its "Creation and Development" and "Yokogushi 2.0" (cross-functional) mandates. This concentrated capital defends its duopoly against IMS Nanofabrication in Multi-Beam lithography and maintains market balance against Bruker, NuFlare Technology, Hitachi High-Tech, and Thermo Fisher Scientific (FEI) in adjacent instrument sectors.
To preserve this engineering moat against global talent shortages, the firm increased consolidated headcount from 3,435 in FY2024 to 3,604 in FY2025, projecting 3,731 for FY2026. Labor efficiency metrics validate this human capital scaling: revenue per employee accelerated 7.5% to $364,895, while operating profit per employee outpaced it, rising 9.3% to $63,861. Corporate governance has been bound to these operational realities via a Board Incentive Plan (BIP) Trust, which mathematically limits executive payouts to a 50%-170% performance multiplier tied directly to absolute ROE and ROIC achievement, forcing institutional alignment.
Presentation Download & Video Access:
Presentation Download: Click the PDF download link under 'Related Topics' to access the full institutional presentation of this report.
Video Link: Click this link to watch the HDIN analyst briefing on YouTube.
About HDIN Research:
HDIN Research is a premier global market intelligence and strategic advisory firm specializing in institutional-grade financial analysis, supply chain audits, and macroeconomic forecasting. Our dedicated sector analysts deliver actionable, data-driven insights tailored for private equity, hedge funds, and corporate strategy teams. Visit us at http://www.hdinresearch.com.
2026 AI Transparency Footer:
*This intelligence report was authored by HDIN Research analysts following a rigorous audit of official corporate filings. AI was utilized for massive-scale data synthesis and structural drafting, ensuring 100% inclusion of reported data points. All strategic insights, financial modeling, and final verdicts were verified by our editorial board to ensure professional accuracy and compliance with 2026 Google Search E-E-A-T standards.*
* JEOL Ltd. forecasts an 8.8% top-line contraction to $1,199.14 million for FY2026, offset by a 59.6% net income recovery ($179.15 million), signaling the exhaustion of extraordinary non-operating losses amidst cooling semiconductor capital expenditure cycles.
* Management is actively stockpiling $712.70 million in inventory across centralized Japanese manufacturing hubs to insulate its monopolistic Electron Beam mask-writing duopoly against single-source procurement vulnerabilities.
* A structural shift toward a job-based compensation framework and Recruitment Process Outsourcing (RPO) delivered a 9.3% year-over-year expansion in operating profit per employee, directly combating Japanese demographic attrition constraints.
Figure JEOL Ltd FY2025 Executive Performance Dashboard: Engineering Global Dominance
Segmental Realities and Margin CompressionJEOL Ltd. [TYO: 6951] operates a bifurcated financial architecture where scale is derived from legacy instrumentation, but enterprise value is strictly anchored by ultra-high-margin semiconductor lithography tools. For the fiscal year 2025, the firm reported consolidated revenue of $1,315.08 million (196,695 million JPY), representing a 12.8% year-over-year expansion. Gross profit finalized at $617.76 million (47.0% margin), flowing down to an operating profit of $237.36 million (18.1% margin). Despite core operational stability, net profit contracted by 13.9% year-over-year to $124.95 million, down from $145.11 million in FY2024, driven by extraordinary losses.
The firm's forward guidance for FY2026 anticipates a macroeconomic normalization cycle. Management projects revenue to contract 8.8% to $1,199.14 million (179,353 million JPY) and operating income to compress 16.9% to $191.28 million (28,610 million JPY). Conversely, net income is guided to accelerate 59.6% to $179.15 million (26,796 million JPY) as non-operating headwinds dissipate.
Table FY2025 Core Segmental Breakdown (Converted at 1 USD = 149.5686 JPY)
| Business Segment | Revenue | Operating Income | Operating Margin | Order Intake (USD) | Key Operational Metrics & Context |
| Scientific & Measuring Instruments |
$834.35M (¥124,793M) |
$100.40M (¥15,017M) |
12.0% | $796.76M |
• Represents 63.4% of total company revenue • Employs 1,601 domestic personnel |
| Industrial Equipment (Semiconductor) |
$377.64M (¥56,483M) |
$175.95M (¥26,316M) |
46.6% | $304.36M |
• Generates >62% of gross segment operating profit • Highly efficient structure with 26 dedicated personnel |
| Medical Equipment |
$103.08M (¥15,418M) |
$4.43M (¥662M) |
4.3% | N/A |
• Non-core operational drag • Strictly focused on the domestic Japanese healthcare market |
Consolidated FY2025 order intake reached $1,203.92 million (180,069 million JPY), backed by a production volume of $1,167.46 million (174,616 million JPY). Going into FY2026, total order intake is projected to contract 10.3% to $1,167.46 million (174,616 million JPY). However, forward visibility is insulated by a static total order backlog of $694.80 million (103,920 million JPY), matching 100.7% of the prior year's levels. The highly profitable Industrial Equipment segment commands $323.85 million (48,438 million JPY) of this backlog, reflecting a marginal 5.1% year-over-year contraction and equating to a stabilized 0.97 Book-to-Bill ratio.
Infrastructure Layout and Regional Moats
The geographic footprint of JEOL Ltd. highlights an overt dependency on Asian semiconductor foundries and western institutional research funding, with 71.2% of FY2025 revenue generated outside the domestic Japanese market.
* Asia-Pacific (incl. China & Taiwan, China): $448.27 million (34.1% of revenue). Driven by Spot Beam, Variable Shape Beam (VSB), and Multi-Beam lithography demand.
* Japan (Domestic): $379.04 million (28.8% of revenue). Dominates the lower-margin Medical Equipment sector.
* Europe: $299.43 million (22.8% of revenue). Anchored by deep institutional R&D funding for Transmission Electron Microscopes (TEM) and Nuclear Magnetic Resonance (NMR) tools.
* Americas: $188.32 million (14.3% of revenue).
To enforce strict quality control and protect unpatented intellectual property, precision manufacturing is aggressively centralized within Japan through subsidiaries including JEOL Yamagata Co., Ltd., Japan Superconductor Technology (JASTEC), Micro Electron Co., Ltd, and JEOL Techno Service Co., Ltd. Overseas subsidiaries operate strictly as sales and maintenance outposts: JEOL USA (104 employees), JEOL (EUROPE) SAS in France (72 employees), JEOL (U.K.) LTD (59 employees), alongside one specific overseas development unit, Integrated Dynamic Electron Solutions, Inc., in the United States.
Operational resilience relies on an intentional distortion of working capital efficiency. Entering FY2026, JEOL operates with a 392-day Cash Conversion Cycle (CCC). This is structured around 109 Days Sales Outstanding (DSO) and 121 Days Payable Outstanding (DPO), fundamentally dragged by an extreme 404 Days Inventory Outstanding (DIO). Management has bloated the balance sheet with $712.70 million (106,597 million JPY) in total inventory, offsetting an expected FY2026 Cost of Goods Sold of $644.01 million (96,323 million JPY).
This inventory stack consists of $114.63 million in raw materials, $260.41 million in finished goods, and $337.66 million (50,503 million JPY) in Work-In-Progress (WIP). The WIP figure represents a minor contraction from the FY2025 WIP of $345.77 million (51,717 million JPY), proving that internal manufacturing bottlenecks are clearing. The inventory expansion serves as a physical hedge against single-source component vulnerabilities flagged in the risk matrix. Trade receivables measure $357.62 million (53,489 million JPY) against trade payables of $214.12 million (32,025 million JPY).
HDIN Institutional Verdict
JEOL Ltd. maintains a fortress balance sheet operating with a positive economic spread. Generating a 12.3% Return on Invested Capital (ROIC) against a historical 6.0% to 8.0% Japanese corporate WACC, the firm inherently creates shareholder value. However, management trails the 15.0% ROIC and 15.0% Return on Equity (ROE) targets outlined in their "Evolving Growth 2.0 - A New Horizon" strategic framework, currently posting an ROE of 14.3% and a Return on Assets (ROA) of 8.4%.
The shortfall in capital efficiency is driven by ultra-conservative treasury allocations. With $1,487.52 million in total assets against $913.65 million in equity (61.4% equity ratio), the firm carries an essentially unlevered Debt-to-Equity ratio of 5.5%. Total interest-bearing debt rests at ~$50.70 million. Liquidity is excessive, holding a Current Ratio of 2.32x (Current Assets: $1,133.20 million; Current Liabilities: $488.04 million) and a Quick Ratio of 1.55x. In FY2025, operating cash flows of $154.47 million (23,104 million JPY) heavily outweighed CapEx of $39.50 million (5,908 million JPY). Yet, shareholder returns remain highly muted: dividends consumed a mere $10.50 million (1,570 million JPY), share buybacks were effectively zero ($0.01 million), and management opted to execute $16.49 million (2,467 million JPY) in unnecessary debt repayments.
Related-party risk is minimal. Borrowings from 7.5% stakeholder Mitsubishi UFJ Trust and Banking Corporation equaled $60.17 million (9,000 million JPY) across both FY2025 and FY2026, comprising $26.74 million (4,000 million JPY) in short-term and $33.43 million (5,000 million JPY) in long-term facilities for FY2026. Consolidated interest expense totaled $0.80 million in FY2025 and $0.89 million in FY2026, confirming these loans execute strictly at market-rate pricing. State subsidy reliance is effectively zero, with grant income falling from $0.75 million (112 million JPY) in FY2025 to $0 in the FY2026 guidance.
Competitively, JEOL utilizes a lean 6.63% R&D intensity—allocating $87.17 million (13,038 million JPY) in total R&D, of which $86.10 million (12,878 million JPY) is captured via SG&A—to fund its "Creation and Development" and "Yokogushi 2.0" (cross-functional) mandates. This concentrated capital defends its duopoly against IMS Nanofabrication in Multi-Beam lithography and maintains market balance against Bruker, NuFlare Technology, Hitachi High-Tech, and Thermo Fisher Scientific (FEI) in adjacent instrument sectors.
To preserve this engineering moat against global talent shortages, the firm increased consolidated headcount from 3,435 in FY2024 to 3,604 in FY2025, projecting 3,731 for FY2026. Labor efficiency metrics validate this human capital scaling: revenue per employee accelerated 7.5% to $364,895, while operating profit per employee outpaced it, rising 9.3% to $63,861. Corporate governance has been bound to these operational realities via a Board Incentive Plan (BIP) Trust, which mathematically limits executive payouts to a 50%-170% performance multiplier tied directly to absolute ROE and ROIC achievement, forcing institutional alignment.
Presentation Download & Video Access:
Presentation Download: Click the PDF download link under 'Related Topics' to access the full institutional presentation of this report.
Video Link: Click this link to watch the HDIN analyst briefing on YouTube.
About HDIN Research:
HDIN Research is a premier global market intelligence and strategic advisory firm specializing in institutional-grade financial analysis, supply chain audits, and macroeconomic forecasting. Our dedicated sector analysts deliver actionable, data-driven insights tailored for private equity, hedge funds, and corporate strategy teams. Visit us at http://www.hdinresearch.com.
2026 AI Transparency Footer:
*This intelligence report was authored by HDIN Research analysts following a rigorous audit of official corporate filings. AI was utilized for massive-scale data synthesis and structural drafting, ensuring 100% inclusion of reported data points. All strategic insights, financial modeling, and final verdicts were verified by our editorial board to ensure professional accuracy and compliance with 2026 Google Search E-E-A-T standards.*