C3.ai Inc.: Margin Compression and Cloud Liabilities Near Redwood City as Revenue Contracts 35.7% Signals Severe Liquidity Strain
Date : 2026-06-27
Reading : 232
HDIN Executive Takeaways
* C3.ai, Inc. posted a 35.7% top-line contraction to $250.27 million, triggering a gross margin collapse to 31% as inflexible $441.4 million purchase commitments pressure unit economics.
* Redwood City operations exhibit severe working capital friction; unbilled receivables hit 42.6% of net accounts receivable amid a 59.2% volume deployment contraction.
* A 33.3% equity dilution overhang caps institutional value, with non-cash compensation reaching $268.53 million, representing 107.3% of total recognized revenue.
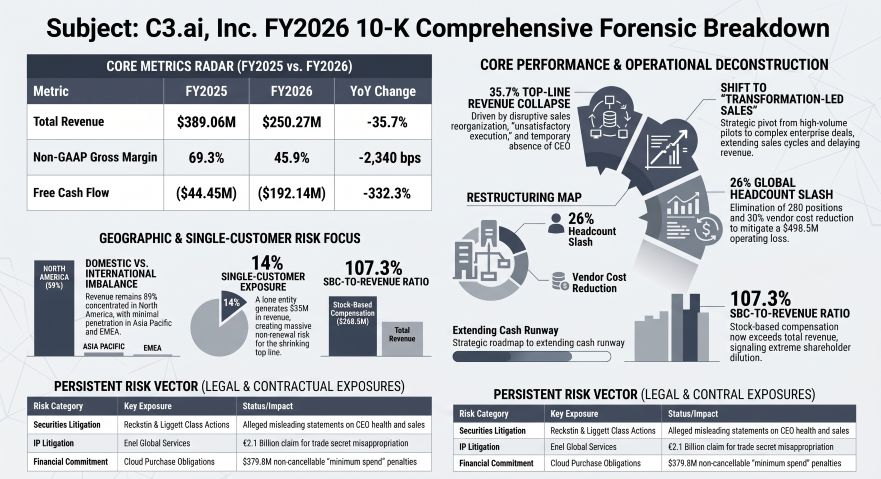
Figure C3.ai Inc FY2026 10-K Comprehensive Forensic Breakdown
 Segmental Realities and Margin Compression
C3.ai, Inc. [NASDAQ: AI] reports a deteriorating operational baseline for FY2026, characterized by high fixed costs intersecting with contracting consumption metrics. Total recognized revenue fell 35.7% year-over-year to $250.27 million, down from $389.06 million in FY2025. This top-line contraction generated an operating loss of $(498.50) million (an expansion of 53.7% from FY2025’s $(324.42) million loss) and accelerated the company's accumulated deficit to $1.8 billion.
The structural shift from traditional ratable SaaS subscriptions to a consumption-based pricing framework drove an immediate decline in recognized revenue streams, quantified across all operating segments:
* Subscription Revenue: Contracted 30.7% to $227.09 million (from $327.63 million in FY2025), collapsing subscription gross margins from 56% to 27%.
* Professional Services Revenue: Dropped 62.3% to $23.18 million (from $61.43 million). This decline comprises a $25.0 million reduction in prioritized engineering services and a $13.3 million decrease in standard service fees, compressing the segment's gross margin from 85% to 72%.
* Remaining Performance Obligations (RPO): Total RPO declined 13.6% from $235.1 million to $203.1 million, with $129.3 million slated for recognition within the next 12 months.
* Volume Metrics: Executed Initial Production Deployments (IPDs) fell 59.2%, from 174 in FY2025 to 71 in FY2026.
The evaporation of high-margin professional services and the absorption of fixed infrastructure expenses compressed the company's blended GAAP Gross Profit by 67.2% to $77.38 million (a 31% margin, down from 61% in FY2025). Non-GAAP Gross Profit dropped 57.4% to $114.90 million (a 45.9% margin, down from 69.3%), achieved by adding back $35.62 million in Cost of Subscription Stock-Based Compensation (SBC) and $1.90 million in Cost of Professional Services SBC. FY2025 comparables were $30.48 million and $3.18 million, respectively.
Operating cash flow consumption accelerated by 359.4% to $(190.23) million, widening by $148.8 million year-over-year from $(41.41) million. Free Cash Flow burn expanded 332.3% to $(192.14) million (from $(44.45) million). Working capital dynamics exhibit friction: Gross Accounts Receivable (AR) contracted 26.4% to $101.61 million (from $138.10 million), yet the absolute Allowance for Doubtful Accounts rose 21.4% to $1.065 million (from $0.877 million). Consequently, the allowance-to-gross AR ratio expanded from 0.63% to 1.05%. Unbilled receivables increased to $42.8 million (up from $40.2 million), now constituting 42.6% of the net AR balance versus 29.3% in FY2025. Deferred revenue recognized sequentially decreased to $36.5 million from $38.5 million. C3.ai, Inc. capitalized $0 in software development costs in both fiscal years, capturing total R&D expenses of $229.09 million (up from $226.39 million) directly on the income statement and reducing net capitalized software on the balance sheet from $0.8 million to $0.6 million.
Infrastructure Layout and Regional Moats
C3.ai, Inc.'s physical and partner architecture concentrates risk within North America and hyperscaler ecosystems. Geographic revenue generation remains heavily domestic: North America delivered $225.81 million (89% of total revenue), followed by Europe, the Middle East, and Africa (EMEA) at $22.02 million, the Rest of World at $1.76 million, and Asia Pacific at $0.69 million.
The firm maintains an active sublease agreement in Redwood City, California, with First Virtual Group, Inc., an entity chaired by C3.ai, Inc. CEO Thomas M. Siebel. The 3,130-square-foot space carried an initial base rent of $8,608 per month through September 30, 2023, automatically renewing on October 1, 2023, with mandated annual increases.
Technological infrastructure relies exclusively on public cloud providers—Amazon Web Services (AWS), Microsoft Azure, and Google Cloud—to support the C3 Agentic AI Platform, C3 AI Studio, C3 Code, C3 AI Applications, and C3 Generative AI. This dependency is enforced by $379.8 million in non-cancelable purchase commitments for cloud hosting and $61.6 million for professional services over the next one to four years. Offloading customer onboarding demands an integrated network of System Integrators (SIs), including Capgemini, PwC, Booz Allen Hamilton, McKinsey, Fractal, Accenture, and Lockheed Martin. The historic joint-venture dependency on Baker Hughes—which contributed $10.6 million in subscription fees and $5.8 million in professional services in FY2024—was strategically unwound, dropping its related-party status on June 30, 2023.
Legal and regulatory footprints dictate external capital risks. In Italy, C3.ai, Inc. targets Enel Global Services in a €2.1 billion ($2.37 billion) trade secret misappropriation suit, while Enel countersues for ownership of two European patent applications. Domestically, the company holds 33 issued U.S. patents, including US 12,111,859 for generative AI agents, and recently secured a $23.3 million trade secret jury verdict against Cummins Inc. Future operations across EMEA confront compliance thresholds under the EU AI Act (risking fines up to €35 million or 7% of global revenue, approximately $39.57 million) and the NIS2 Directive (fines up to €10 million or 2% of revenue, approximately $11.31 million).
HDIN Institutional Verdict
While C3.ai, Inc. reports a liquidity pool of $575.5 million ($66.2 million in cash; $509.3 million in marketable securities)—down 22.5% from $742.7 million in FY2025—the optical 3.00-year operational runway masks acute structural deficits. Management’s pivot to "Transformation-Led Sales" attempts to correct volume deceleration, but the enterprise relies on unsustainable equity dilution to fund operations.
Total SBC expense reached $268.53 million, representing 107.3% of top-line revenue. Of the $575.88 million in total operating expenses, 40.1% ($231.02 million) is funded via non-cash SBC. Segmental distribution reveals aggressive equity reliance: Sales & Marketing consumed $237.37 million ($95.53 million SBC / 40.2%); R&D consumed $229.09 million ($79.22 million SBC / 34.6%); and G&A consumed $98.60 million ($51.45 million SBC / 52.2%).
To stem the $470.37 million Net Loss (a 62.9% expansion from FY2025’s $(288.70) million loss), the Board executed a 26% workforce reduction (terminating approximately 280 full-time employees) and a 30% annualized vendor cost reduction. This generated $10.83 million in Q4 restructuring charges ($5.2 million in cash severance; $5.6 million in non-cash property write-offs and SBC), of which $4.82 million (44.5%) was realized as SBC.
This compensation structure has forged a 33.3% dilution overhang. With 151,949,285 Class A shares and 3,499,992 Class B shares outstanding (155.45 million total), the unvested pipeline of 32,419,000 options and 19,414,000 Restricted Stock Units totals 51.83 million new Class A shares. On a fully diluted basis of 207.28 million shares, 25.0% of the firm's equity is allocated internally. Institutional influence is simultaneously nullified by Thomas M. Siebel’s 87.8% control of Class B stock and 14.9% of Class A stock, securing 49.6% of the total voting power.
Key-person and concentration risks compound the liquidity threat. The unanticipated health absence of the CEO required a temporary transition to Stephen Ehikian in September 2025 before Siebel returned in May 2026. This triggered the Liggett Case, an August 2025 class action alleging misleading statements, with a motion to dismiss slated for June 2026. This case stays three derivative actions (Jaffee, Steffens, Fernicola), mirroring the Reckstin Family Trust litigation, where a March 2026 court sustained reseller claims, staying six related derivative suits (Suri, Rabasca, Vo, Lanfair, Pankow, Rosenfeld). Commercially, a single Customer-Entity drove 14% ($35.04 million) of FY2026 revenue, while two entities control 36% of accounts receivable (25% and 11%). Should external cloud consumption fail to satisfy the $441.4 million in fixed infrastructure commitments, margin contraction will accelerate, neutralizing the firm's capital reserves before the Transformation-Led strategy can mature.
Presentation Download & Video Access:
- Presentation Download: Click the PDF download link under 'Related Topics' to access the full institutional presentation of this report.
- Video Link: Click this link to watch the HDIN analyst briefing on YouTube.
About HDIN Research:
HDIN Research is a premier global market intelligence and strategic advisory firm specializing in institutional-grade financial analysis, supply chain audits, and macroeconomic forecasting. Our dedicated sector analysts deliver actionable, data-driven insights tailored for private equity, hedge funds, and corporate strategy teams. Visit us at http://www.hdinresearch.com.
2026 AI Transparency Footer:
"This intelligence report was authored by HDIN Research analysts following a rigorous audit of official corporate filings. AI was utilized for massive-scale data synthesis and structural drafting, ensuring 100% inclusion of reported data points. All strategic insights, financial modeling, and final verdicts were verified by our editorial board to ensure professional accuracy and compliance with 2026 Google Search E-E-A-T standards."
* C3.ai, Inc. posted a 35.7% top-line contraction to $250.27 million, triggering a gross margin collapse to 31% as inflexible $441.4 million purchase commitments pressure unit economics.
* Redwood City operations exhibit severe working capital friction; unbilled receivables hit 42.6% of net accounts receivable amid a 59.2% volume deployment contraction.
* A 33.3% equity dilution overhang caps institutional value, with non-cash compensation reaching $268.53 million, representing 107.3% of total recognized revenue.
Figure C3.ai Inc FY2026 10-K Comprehensive Forensic Breakdown
Segmental Realities and Margin CompressionC3.ai, Inc. [NASDAQ: AI] reports a deteriorating operational baseline for FY2026, characterized by high fixed costs intersecting with contracting consumption metrics. Total recognized revenue fell 35.7% year-over-year to $250.27 million, down from $389.06 million in FY2025. This top-line contraction generated an operating loss of $(498.50) million (an expansion of 53.7% from FY2025’s $(324.42) million loss) and accelerated the company's accumulated deficit to $1.8 billion.
The structural shift from traditional ratable SaaS subscriptions to a consumption-based pricing framework drove an immediate decline in recognized revenue streams, quantified across all operating segments:
* Subscription Revenue: Contracted 30.7% to $227.09 million (from $327.63 million in FY2025), collapsing subscription gross margins from 56% to 27%.
* Professional Services Revenue: Dropped 62.3% to $23.18 million (from $61.43 million). This decline comprises a $25.0 million reduction in prioritized engineering services and a $13.3 million decrease in standard service fees, compressing the segment's gross margin from 85% to 72%.
* Remaining Performance Obligations (RPO): Total RPO declined 13.6% from $235.1 million to $203.1 million, with $129.3 million slated for recognition within the next 12 months.
* Volume Metrics: Executed Initial Production Deployments (IPDs) fell 59.2%, from 174 in FY2025 to 71 in FY2026.
The evaporation of high-margin professional services and the absorption of fixed infrastructure expenses compressed the company's blended GAAP Gross Profit by 67.2% to $77.38 million (a 31% margin, down from 61% in FY2025). Non-GAAP Gross Profit dropped 57.4% to $114.90 million (a 45.9% margin, down from 69.3%), achieved by adding back $35.62 million in Cost of Subscription Stock-Based Compensation (SBC) and $1.90 million in Cost of Professional Services SBC. FY2025 comparables were $30.48 million and $3.18 million, respectively.
Operating cash flow consumption accelerated by 359.4% to $(190.23) million, widening by $148.8 million year-over-year from $(41.41) million. Free Cash Flow burn expanded 332.3% to $(192.14) million (from $(44.45) million). Working capital dynamics exhibit friction: Gross Accounts Receivable (AR) contracted 26.4% to $101.61 million (from $138.10 million), yet the absolute Allowance for Doubtful Accounts rose 21.4% to $1.065 million (from $0.877 million). Consequently, the allowance-to-gross AR ratio expanded from 0.63% to 1.05%. Unbilled receivables increased to $42.8 million (up from $40.2 million), now constituting 42.6% of the net AR balance versus 29.3% in FY2025. Deferred revenue recognized sequentially decreased to $36.5 million from $38.5 million. C3.ai, Inc. capitalized $0 in software development costs in both fiscal years, capturing total R&D expenses of $229.09 million (up from $226.39 million) directly on the income statement and reducing net capitalized software on the balance sheet from $0.8 million to $0.6 million.
Infrastructure Layout and Regional Moats
C3.ai, Inc.'s physical and partner architecture concentrates risk within North America and hyperscaler ecosystems. Geographic revenue generation remains heavily domestic: North America delivered $225.81 million (89% of total revenue), followed by Europe, the Middle East, and Africa (EMEA) at $22.02 million, the Rest of World at $1.76 million, and Asia Pacific at $0.69 million.
The firm maintains an active sublease agreement in Redwood City, California, with First Virtual Group, Inc., an entity chaired by C3.ai, Inc. CEO Thomas M. Siebel. The 3,130-square-foot space carried an initial base rent of $8,608 per month through September 30, 2023, automatically renewing on October 1, 2023, with mandated annual increases.
Technological infrastructure relies exclusively on public cloud providers—Amazon Web Services (AWS), Microsoft Azure, and Google Cloud—to support the C3 Agentic AI Platform, C3 AI Studio, C3 Code, C3 AI Applications, and C3 Generative AI. This dependency is enforced by $379.8 million in non-cancelable purchase commitments for cloud hosting and $61.6 million for professional services over the next one to four years. Offloading customer onboarding demands an integrated network of System Integrators (SIs), including Capgemini, PwC, Booz Allen Hamilton, McKinsey, Fractal, Accenture, and Lockheed Martin. The historic joint-venture dependency on Baker Hughes—which contributed $10.6 million in subscription fees and $5.8 million in professional services in FY2024—was strategically unwound, dropping its related-party status on June 30, 2023.
Legal and regulatory footprints dictate external capital risks. In Italy, C3.ai, Inc. targets Enel Global Services in a €2.1 billion ($2.37 billion) trade secret misappropriation suit, while Enel countersues for ownership of two European patent applications. Domestically, the company holds 33 issued U.S. patents, including US 12,111,859 for generative AI agents, and recently secured a $23.3 million trade secret jury verdict against Cummins Inc. Future operations across EMEA confront compliance thresholds under the EU AI Act (risking fines up to €35 million or 7% of global revenue, approximately $39.57 million) and the NIS2 Directive (fines up to €10 million or 2% of revenue, approximately $11.31 million).
HDIN Institutional Verdict
While C3.ai, Inc. reports a liquidity pool of $575.5 million ($66.2 million in cash; $509.3 million in marketable securities)—down 22.5% from $742.7 million in FY2025—the optical 3.00-year operational runway masks acute structural deficits. Management’s pivot to "Transformation-Led Sales" attempts to correct volume deceleration, but the enterprise relies on unsustainable equity dilution to fund operations.
Total SBC expense reached $268.53 million, representing 107.3% of top-line revenue. Of the $575.88 million in total operating expenses, 40.1% ($231.02 million) is funded via non-cash SBC. Segmental distribution reveals aggressive equity reliance: Sales & Marketing consumed $237.37 million ($95.53 million SBC / 40.2%); R&D consumed $229.09 million ($79.22 million SBC / 34.6%); and G&A consumed $98.60 million ($51.45 million SBC / 52.2%).
To stem the $470.37 million Net Loss (a 62.9% expansion from FY2025’s $(288.70) million loss), the Board executed a 26% workforce reduction (terminating approximately 280 full-time employees) and a 30% annualized vendor cost reduction. This generated $10.83 million in Q4 restructuring charges ($5.2 million in cash severance; $5.6 million in non-cash property write-offs and SBC), of which $4.82 million (44.5%) was realized as SBC.
This compensation structure has forged a 33.3% dilution overhang. With 151,949,285 Class A shares and 3,499,992 Class B shares outstanding (155.45 million total), the unvested pipeline of 32,419,000 options and 19,414,000 Restricted Stock Units totals 51.83 million new Class A shares. On a fully diluted basis of 207.28 million shares, 25.0% of the firm's equity is allocated internally. Institutional influence is simultaneously nullified by Thomas M. Siebel’s 87.8% control of Class B stock and 14.9% of Class A stock, securing 49.6% of the total voting power.
Key-person and concentration risks compound the liquidity threat. The unanticipated health absence of the CEO required a temporary transition to Stephen Ehikian in September 2025 before Siebel returned in May 2026. This triggered the Liggett Case, an August 2025 class action alleging misleading statements, with a motion to dismiss slated for June 2026. This case stays three derivative actions (Jaffee, Steffens, Fernicola), mirroring the Reckstin Family Trust litigation, where a March 2026 court sustained reseller claims, staying six related derivative suits (Suri, Rabasca, Vo, Lanfair, Pankow, Rosenfeld). Commercially, a single Customer-Entity drove 14% ($35.04 million) of FY2026 revenue, while two entities control 36% of accounts receivable (25% and 11%). Should external cloud consumption fail to satisfy the $441.4 million in fixed infrastructure commitments, margin contraction will accelerate, neutralizing the firm's capital reserves before the Transformation-Led strategy can mature.
Presentation Download & Video Access:
- Presentation Download: Click the PDF download link under 'Related Topics' to access the full institutional presentation of this report.
- Video Link: Click this link to watch the HDIN analyst briefing on YouTube.
About HDIN Research:
HDIN Research is a premier global market intelligence and strategic advisory firm specializing in institutional-grade financial analysis, supply chain audits, and macroeconomic forecasting. Our dedicated sector analysts deliver actionable, data-driven insights tailored for private equity, hedge funds, and corporate strategy teams. Visit us at http://www.hdinresearch.com.
2026 AI Transparency Footer:
"This intelligence report was authored by HDIN Research analysts following a rigorous audit of official corporate filings. AI was utilized for massive-scale data synthesis and structural drafting, ensuring 100% inclusion of reported data points. All strategic insights, financial modeling, and final verdicts were verified by our editorial board to ensure professional accuracy and compliance with 2026 Google Search E-E-A-T standards."