Lenovo Group Limited: 48% Inventory Expansion Near Global Nodes as $83.08 Billion AI Revenue Base Drives Structural Margin Upgrades
Date : 2026-06-29
Reading : 232
HDIN Executive Takeaways
* Lenovo Group Limited expanded top-line revenue by 20% to $83.08 billion, executing a deliberate 48% inventory accumulation ($11.72 billion) to front-run component shortages while stretching its Days Payable Outstanding (DPO) to 99.9 days via $4.45 billion in supplier financing.
* Capital expenditures accelerated by 61% to $1.86 billion, aggressively routing digital infrastructure upgrades across geographically localized automated hubs in Monterrey, Mexico, and Budapest, Hungary, shielding operations from cross-border tariff volatility.
* An institutional migration toward high-margin recurring ecosystems generated $2.24 billion in services operating profit (22.4% margin), fully insulating a 70-basis-point gross margin contraction within legacy hardware divisions.
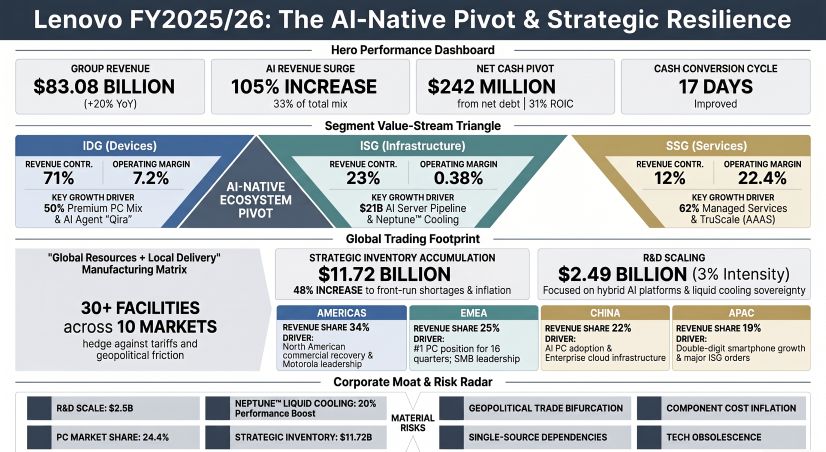
Figure Lenovo FY2025/26: The Al-Native Pivot & Strategic Resilience
 Segmental Realities and Margin Compression
Lenovo Group Limited [HKG: 0992] recorded $83.08 billion in global revenue, representing a 20% expansion from $69.08 billion in the prior fiscal year. This trajectory was heavily catalyzed by AI-related hardware and service deployments, which grew 105% year-over-year to capture 33% of aggregate group revenue. Gross profit reached $12.81 billion (up 15% from $11.10 billion); however, structural shifts in product mix and component cost pressures compressed gross margins by 70 basis points to 15.4% (down from 16.1%).
Despite upstream cost inflation, disciplined cost containment drove operating expenses down by 140 basis points to 11.5% of revenue. This operating leverage expanded reported operating profit by 50.7% to $3.26 billion (from $2.16 billion), raising the operating margin by 80 basis points to 3.9% (3.8% adjusted). Total reported net income covered by operating cash flow ($4.02 billion, up from $1.10 billion) reached $2.16 billion, representing a 1.86x cash realization multiple. Net income attributable to equity holders expanded 38% to $1.91 billion (from $1.38 billion), lifting net margins by 30 basis points to 2.3% (2.5% adjusted at $2.05 billion).
Segmental performance reveals a bifurcated monetization architecture balancing scale with software-led accretion:
* Intelligent Devices Group (IDG): Revenue expanded 17% to $58.94 billion, maintaining a 7.2% operating margin on $4.22 billion in operating profit. Global PC market share reached 24.4% (+1.3 percentage points), outpacing the broader market by 5.6 percentage points on cumulative shipments exceeding 1.1 billion units. Premium units accounted for 50% of PC shipments and 19% of smartphone shipments, with Motorola driving 6% shipment growth against a 3% market decline outside China.
* Infrastructure Solutions Group (ISG): Revenue surged 32% to $19.19 billion, driven by a $21 billion AI server pipeline and over 5,800 global AI projects. The division inflected to a full-year operating profit of $73.37 million (0.38% margin), reversing a prior-year loss of $(68.50) million.
* Solutions & Services Group (SSG): Revenue expanded 19% to $10.03 billion, yielding $2.24 billion in operating profit at a 22.4% margin. Managed Services and Project/Vertical Solutions account for 62% of segment revenue, outpacing broader IT service market growth by 4x.
Research and development (R&D) OPEX reached $2,490,403,000, representing an 8.84% increase from $2,288,204,000, driven by a $114.5 million expansion in lab testing and services. R&D intensity held strictly at 3.00% of revenue, with $109.35 million capitalized for ongoing patent/technology projects (down from $234.80 million).
Corporate profitability was actively managed via non-cash adjustments and provision escalations. Gross provisions settled at $1,137.72 million ($945.07 million current; $192.65 million non-current), led by a product warranty provision of $1,054.68 million (an 8.6% increase from $970.69 million). The firm recognized a $284.82 million restructuring charge to optimize the ISG portfolio, leaving $55.19 million unfunded. Intangible assets totaled $7,920.75 million (down from $8,232.98 million), housing $6,203 million in goodwill and indefinite-life intangibles. Management executed a $234.32 million impairment against patents and technology (up from $123.14 million), alongside a $3.26 million construction-in-progress (CIP) impairment. Net income was insulated by a $230 million fair value gain on warrant liabilities and a $330 million gain on financial assets. Defined benefit pension deficits improved to $203.82 million (down from $220.78 million), backed by a $599.27 million obligation against $395.45 million in plan assets. Operating lease capitalizations resulted in $648.84 million in Right-of-Use assets and $415.41 million in liabilities ($110.02 million current; $305.40 million non-current). A written put option generated a $291.10 million derivative liability.
Infrastructure Layout and Regional Moats
Lenovo Group Limited executes manufacturing through a hybrid matrix of 30 production bases across 10 geographic markets, fortified by 20 R&D centers. Geographic revenue distribution remains strictly balanced, with the Americas, China, EMEA, and Asia-Pacific each contributing between 19% and 34% of aggregate volume. The Americas recorded 21% top-line growth (elevating North American IDG market share to 20.4%), EMEA maintained its PC leadership for 16 consecutive quarters at 28.2%, Asia-Pacific expanded by 23%, and China delivered 16% growth.
Capital expenditure (CapEx) expanded 61% to $1.859 billion (from $1.151 billion). Property, Plant, and Equipment (PPE) additions absorbed $723.73 million, while CIP allocations surged 93% to $546.07 million for digital infrastructure. The production network utilizes localized nodes—specifically the Global Lighthouse facility in Monterrey, Mexico; heavy-weight server infrastructure in Budapest, Hungary; the LCFC hub in Hefei, China; the Shenzhen IT integration center; and the Motorola-dedicated Wuhan facility. High-density cooling architecture dominates ISG manufacturing, processing over 70,000 server racks annually, with direct liquid cooling capacity exceeding 11,000 racks (yielding 20% performance improvements). Global cloud deployments leverage facilities such as the Nscale AI project in Iceland.
To neutralize single-source component risks and global tariff friction, management forcefully transitioned to a "Just-In-Case" working capital model, extending the Cash Conversion Cycle (CCC) by 15 days to 17 days. Inventory balances surged 48% to $11.72 billion. Raw materials and work-in-progress constitute 60% ($7.04 billion) of this balance, yielding a Days Inventory Outstanding (DIO) of 60.9 days and requiring a $139.05 million COGS inventory provision. Days Sales Outstanding (DSO) extended to 63.7 days on $14.50 billion in receivables (+38%).
Liquidity optimization is heavily reliant on central treasury interventions. Lenovo stretched its Days Payable Outstanding (DPO) to 99.9 days, supported by $19.24 billion in payables (+61%). The balance sheet carries $4,452.50 million tied to supplier financing and reverse-factoring arrangements, categorized across notes payable ($3,717.42 million), other payables ($631.38 million), and trade payables ($103.69 million). The firm deployed $17.68 billion in forward foreign exchange contracts to hedge against localized currency fluctuations.
HDIN Institutional Verdict
Lenovo Group Limited’s $83.08 billion financial base demonstrates superior balance sheet optimization and high-quality cash conversion, validating a definitive transition from a transactional hardware distributor to an AI-native ecosystem. Capital efficiency is structurally intact: total assets expanded to $57.13 billion (from $44.23 billion), generating an average asset turnover ratio of 1.64x. Total equity swelled 27% to $8.44 billion (from $6.66 billion), driving Return on Equity (ROE) to 25.3%. Deducting a 21.9% effective tax rate yields a Net Operating Profit After Tax (NOPAT) of $2.55 billion against an $8.20 billion invested capital base, establishing an exceptional Return on Invested Capital (ROIC) of 31.0%. Free Cash Flow proxy estimates reach $2.16 billion after massive capital expenditures.
The firm's capital structure aggressively de-risked into a true net cash position of $242.49 million, reversing a prior net debt position of $(551) million. Liquidity reserves total $4,983.53 million ($4,887.16 million in cash; $96.37 million in restricted deposits), further buffered by $2,030.50 million in FVTPL assets and $49.65 million in FVOCI assets. Gearing improved radically from 0.81x to 0.56x. Gross debt contracted 12% to $4,741.04 million, strategically dispersed across $280.68 million in short-term bank loans (1.24%–6.63% rates), $597.77 million in current convertible bonds, $2,052.71 million in long-term notes, and $1,809.89 million in long-term convertible bonds (5.65%–6.07% rates).
Corporate governance and ESG compliance provide institutional downside protection. The 12-member Board of Directors structurally prevents executive overreach, composed of 1 Executive Director, 4 Non-Executive Directors, and 7 Independent Non-Executive Directors (a 58% independence ratio). Committee independence is strict: Audit (3 INEDs, 1 NED), Remuneration (2 INEDs, 1 NED), and Nomination (3 INEDs, 1 NED, 1 ED). The Board achieves 25% female representation (3 members), mirroring 37% female workforce representation (29% technical, 25% management). Executive stock ownership mandates force the CEO to hold 5x base salary and senior management 3x base salary in equity. Environmental commitments are validated by SBTi, targeting a 90% absolute emission reduction across Scope 1, 2, and 3 by 2050, resulting in an MSCI AAA rating.
Management’s Value-in-Use (VIU) DCF models rely on pre-tax discount rates of 13%–14% (IDG), 14%–16% (ISG), and 18% (SSG), forecasting 5-year CAGRs of 1%–2% (IDG), 7%–13% (ISG), and 14% (SSG). Thin headroom exists in regional ISG units, where a 5.0% CAGR drop in China or an 8.3% drop in Asia-Pacific would trigger impairment. Ultimately, Lenovo’s ability to secure 62% of its SSG revenue from complex recurring contracts completely isolates the firm from retail consumer cyclicality, confirming the institutional viability of its AI hardware supercycle monetization.
Presentation Download & Video Access:
- Presentation Download: Click the PDF download link under 'Related Topics' to access the full institutional presentation of this report.
- Video Link: Click this link to watch the HDIN analyst briefing on YouTube.
About HDIN Research:
HDIN Research is a premier global market intelligence and strategic advisory firm specializing in institutional-grade financial analysis, supply chain audits, and macroeconomic forecasting. Our dedicated sector analysts deliver actionable, data-driven insights tailored for private equity, hedge funds, and corporate strategy teams. Visit us at http://www.hdinresearch.com.
2026 AI Transparency Footer:
"This intelligence report was authored by HDIN Research analysts following a rigorous audit of official corporate filings. AI was utilized for massive-scale data synthesis and structural drafting, ensuring 100% inclusion of reported data points. All strategic insights, financial modeling, and final verdicts were verified by our editorial board to ensure professional accuracy and compliance with 2026 Google Search E-E-A-T standards."
* Lenovo Group Limited expanded top-line revenue by 20% to $83.08 billion, executing a deliberate 48% inventory accumulation ($11.72 billion) to front-run component shortages while stretching its Days Payable Outstanding (DPO) to 99.9 days via $4.45 billion in supplier financing.
* Capital expenditures accelerated by 61% to $1.86 billion, aggressively routing digital infrastructure upgrades across geographically localized automated hubs in Monterrey, Mexico, and Budapest, Hungary, shielding operations from cross-border tariff volatility.
* An institutional migration toward high-margin recurring ecosystems generated $2.24 billion in services operating profit (22.4% margin), fully insulating a 70-basis-point gross margin contraction within legacy hardware divisions.
Figure Lenovo FY2025/26: The Al-Native Pivot & Strategic Resilience
Segmental Realities and Margin CompressionLenovo Group Limited [HKG: 0992] recorded $83.08 billion in global revenue, representing a 20% expansion from $69.08 billion in the prior fiscal year. This trajectory was heavily catalyzed by AI-related hardware and service deployments, which grew 105% year-over-year to capture 33% of aggregate group revenue. Gross profit reached $12.81 billion (up 15% from $11.10 billion); however, structural shifts in product mix and component cost pressures compressed gross margins by 70 basis points to 15.4% (down from 16.1%).
Despite upstream cost inflation, disciplined cost containment drove operating expenses down by 140 basis points to 11.5% of revenue. This operating leverage expanded reported operating profit by 50.7% to $3.26 billion (from $2.16 billion), raising the operating margin by 80 basis points to 3.9% (3.8% adjusted). Total reported net income covered by operating cash flow ($4.02 billion, up from $1.10 billion) reached $2.16 billion, representing a 1.86x cash realization multiple. Net income attributable to equity holders expanded 38% to $1.91 billion (from $1.38 billion), lifting net margins by 30 basis points to 2.3% (2.5% adjusted at $2.05 billion).
Segmental performance reveals a bifurcated monetization architecture balancing scale with software-led accretion:
* Intelligent Devices Group (IDG): Revenue expanded 17% to $58.94 billion, maintaining a 7.2% operating margin on $4.22 billion in operating profit. Global PC market share reached 24.4% (+1.3 percentage points), outpacing the broader market by 5.6 percentage points on cumulative shipments exceeding 1.1 billion units. Premium units accounted for 50% of PC shipments and 19% of smartphone shipments, with Motorola driving 6% shipment growth against a 3% market decline outside China.
* Infrastructure Solutions Group (ISG): Revenue surged 32% to $19.19 billion, driven by a $21 billion AI server pipeline and over 5,800 global AI projects. The division inflected to a full-year operating profit of $73.37 million (0.38% margin), reversing a prior-year loss of $(68.50) million.
* Solutions & Services Group (SSG): Revenue expanded 19% to $10.03 billion, yielding $2.24 billion in operating profit at a 22.4% margin. Managed Services and Project/Vertical Solutions account for 62% of segment revenue, outpacing broader IT service market growth by 4x.
Research and development (R&D) OPEX reached $2,490,403,000, representing an 8.84% increase from $2,288,204,000, driven by a $114.5 million expansion in lab testing and services. R&D intensity held strictly at 3.00% of revenue, with $109.35 million capitalized for ongoing patent/technology projects (down from $234.80 million).
Corporate profitability was actively managed via non-cash adjustments and provision escalations. Gross provisions settled at $1,137.72 million ($945.07 million current; $192.65 million non-current), led by a product warranty provision of $1,054.68 million (an 8.6% increase from $970.69 million). The firm recognized a $284.82 million restructuring charge to optimize the ISG portfolio, leaving $55.19 million unfunded. Intangible assets totaled $7,920.75 million (down from $8,232.98 million), housing $6,203 million in goodwill and indefinite-life intangibles. Management executed a $234.32 million impairment against patents and technology (up from $123.14 million), alongside a $3.26 million construction-in-progress (CIP) impairment. Net income was insulated by a $230 million fair value gain on warrant liabilities and a $330 million gain on financial assets. Defined benefit pension deficits improved to $203.82 million (down from $220.78 million), backed by a $599.27 million obligation against $395.45 million in plan assets. Operating lease capitalizations resulted in $648.84 million in Right-of-Use assets and $415.41 million in liabilities ($110.02 million current; $305.40 million non-current). A written put option generated a $291.10 million derivative liability.
Infrastructure Layout and Regional Moats
Lenovo Group Limited executes manufacturing through a hybrid matrix of 30 production bases across 10 geographic markets, fortified by 20 R&D centers. Geographic revenue distribution remains strictly balanced, with the Americas, China, EMEA, and Asia-Pacific each contributing between 19% and 34% of aggregate volume. The Americas recorded 21% top-line growth (elevating North American IDG market share to 20.4%), EMEA maintained its PC leadership for 16 consecutive quarters at 28.2%, Asia-Pacific expanded by 23%, and China delivered 16% growth.
Capital expenditure (CapEx) expanded 61% to $1.859 billion (from $1.151 billion). Property, Plant, and Equipment (PPE) additions absorbed $723.73 million, while CIP allocations surged 93% to $546.07 million for digital infrastructure. The production network utilizes localized nodes—specifically the Global Lighthouse facility in Monterrey, Mexico; heavy-weight server infrastructure in Budapest, Hungary; the LCFC hub in Hefei, China; the Shenzhen IT integration center; and the Motorola-dedicated Wuhan facility. High-density cooling architecture dominates ISG manufacturing, processing over 70,000 server racks annually, with direct liquid cooling capacity exceeding 11,000 racks (yielding 20% performance improvements). Global cloud deployments leverage facilities such as the Nscale AI project in Iceland.
To neutralize single-source component risks and global tariff friction, management forcefully transitioned to a "Just-In-Case" working capital model, extending the Cash Conversion Cycle (CCC) by 15 days to 17 days. Inventory balances surged 48% to $11.72 billion. Raw materials and work-in-progress constitute 60% ($7.04 billion) of this balance, yielding a Days Inventory Outstanding (DIO) of 60.9 days and requiring a $139.05 million COGS inventory provision. Days Sales Outstanding (DSO) extended to 63.7 days on $14.50 billion in receivables (+38%).
Liquidity optimization is heavily reliant on central treasury interventions. Lenovo stretched its Days Payable Outstanding (DPO) to 99.9 days, supported by $19.24 billion in payables (+61%). The balance sheet carries $4,452.50 million tied to supplier financing and reverse-factoring arrangements, categorized across notes payable ($3,717.42 million), other payables ($631.38 million), and trade payables ($103.69 million). The firm deployed $17.68 billion in forward foreign exchange contracts to hedge against localized currency fluctuations.
HDIN Institutional Verdict
Lenovo Group Limited’s $83.08 billion financial base demonstrates superior balance sheet optimization and high-quality cash conversion, validating a definitive transition from a transactional hardware distributor to an AI-native ecosystem. Capital efficiency is structurally intact: total assets expanded to $57.13 billion (from $44.23 billion), generating an average asset turnover ratio of 1.64x. Total equity swelled 27% to $8.44 billion (from $6.66 billion), driving Return on Equity (ROE) to 25.3%. Deducting a 21.9% effective tax rate yields a Net Operating Profit After Tax (NOPAT) of $2.55 billion against an $8.20 billion invested capital base, establishing an exceptional Return on Invested Capital (ROIC) of 31.0%. Free Cash Flow proxy estimates reach $2.16 billion after massive capital expenditures.
The firm's capital structure aggressively de-risked into a true net cash position of $242.49 million, reversing a prior net debt position of $(551) million. Liquidity reserves total $4,983.53 million ($4,887.16 million in cash; $96.37 million in restricted deposits), further buffered by $2,030.50 million in FVTPL assets and $49.65 million in FVOCI assets. Gearing improved radically from 0.81x to 0.56x. Gross debt contracted 12% to $4,741.04 million, strategically dispersed across $280.68 million in short-term bank loans (1.24%–6.63% rates), $597.77 million in current convertible bonds, $2,052.71 million in long-term notes, and $1,809.89 million in long-term convertible bonds (5.65%–6.07% rates).
Corporate governance and ESG compliance provide institutional downside protection. The 12-member Board of Directors structurally prevents executive overreach, composed of 1 Executive Director, 4 Non-Executive Directors, and 7 Independent Non-Executive Directors (a 58% independence ratio). Committee independence is strict: Audit (3 INEDs, 1 NED), Remuneration (2 INEDs, 1 NED), and Nomination (3 INEDs, 1 NED, 1 ED). The Board achieves 25% female representation (3 members), mirroring 37% female workforce representation (29% technical, 25% management). Executive stock ownership mandates force the CEO to hold 5x base salary and senior management 3x base salary in equity. Environmental commitments are validated by SBTi, targeting a 90% absolute emission reduction across Scope 1, 2, and 3 by 2050, resulting in an MSCI AAA rating.
Management’s Value-in-Use (VIU) DCF models rely on pre-tax discount rates of 13%–14% (IDG), 14%–16% (ISG), and 18% (SSG), forecasting 5-year CAGRs of 1%–2% (IDG), 7%–13% (ISG), and 14% (SSG). Thin headroom exists in regional ISG units, where a 5.0% CAGR drop in China or an 8.3% drop in Asia-Pacific would trigger impairment. Ultimately, Lenovo’s ability to secure 62% of its SSG revenue from complex recurring contracts completely isolates the firm from retail consumer cyclicality, confirming the institutional viability of its AI hardware supercycle monetization.
Presentation Download & Video Access:
- Presentation Download: Click the PDF download link under 'Related Topics' to access the full institutional presentation of this report.
- Video Link: Click this link to watch the HDIN analyst briefing on YouTube.
About HDIN Research:
HDIN Research is a premier global market intelligence and strategic advisory firm specializing in institutional-grade financial analysis, supply chain audits, and macroeconomic forecasting. Our dedicated sector analysts deliver actionable, data-driven insights tailored for private equity, hedge funds, and corporate strategy teams. Visit us at http://www.hdinresearch.com.
2026 AI Transparency Footer:
"This intelligence report was authored by HDIN Research analysts following a rigorous audit of official corporate filings. AI was utilized for massive-scale data synthesis and structural drafting, ensuring 100% inclusion of reported data points. All strategic insights, financial modeling, and final verdicts were verified by our editorial board to ensure professional accuracy and compliance with 2026 Google Search E-E-A-T standards."