Virtuix Holdings Inc.: Strategic Pivot to Consumer Hardware Near Zhuhai and Taiwan as 25% Gross Margin Turnaround Signals Fragile Ecosystem Scaling
Date : 2026-06-29
Reading : 187
HDIN Executive Takeaways
* Virtuix Holdings Inc. engineered a 3,100-basis-point gross margin expansion to 25% in FY2026, driven by a $900 ASP hike on Omni One units, despite absorbing a $(16,799,253) net loss and $(9,504,380) operating cash burn.
* The supply chain architecture remains acutely bottlenecked in Zhuhai, mainland China, forcing a defensive pivot to Taiwan, China assembly hubs to hedge against tariffs breaching a 30% materiality threshold.
* Institutional viability hinges on restructuring a $11,991,608 FY2027 debt maturity cliff and scaling consumer adoption amidst customer acquisition costs that surged 279% year-over-year.
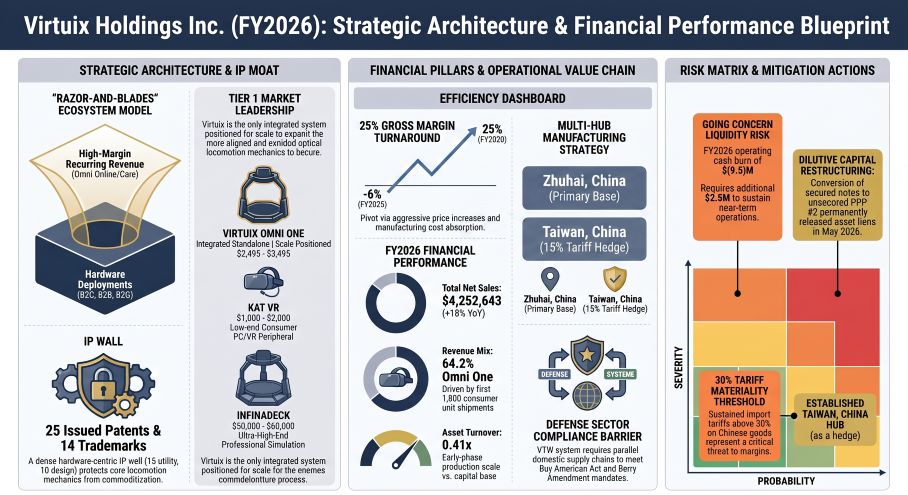
Figure Virtuix Holdings Inc: Strategic Architecture & Financial Performance Blueprint
 Segmental Realities and Margin Compression
Virtuix Holdings Inc. [NASDAQ: VRTX] reported total net sales of $4,252,643 for the fiscal year ended March 31, 2026, representing an 18% year-over-year expansion. The balance sheet reflects a highly levered profile, with $11,936,309 in current assets against $8,768,103 in current liabilities, yielding a 1.36x current ratio. While cash and cash equivalents stand at $9,471,288, management explicitly projects a $2,500,000 liquidity shortfall to fund operations over the next 12 months.
Gross profit reached $1.04 million as gross margins reversed from negative -6% in FY2025 to a positive 25% in FY2026. However, operating losses deepened to $(10,319,352), driven by a $10.5 million combined selling, general, and administrative expense drag. Asset turnover collapsed to 0.41x, generating revenue against average total assets of $10,268,196 ($14,761,370 in FY2026 versus $5,775,023 in FY2025).
The $7.29 million variance between the net loss and operating cash flow is attributable strictly to $6,354,643 in total other expenses, explicitly anchored by $2,923,059 in non-cash discount amortization on notes payable, $2,694,722 in warrant modification expenses, $1,235,009 in stock issued for services, and $441,951 in stock-based compensation.
FY2026 Revenue and Unit Economics Breakdown
* Omni One (B2C/Enterprise): Contributed $2,732,009 (64.2% of net sales). The company successfully shipped 1,800 units by September 2025, generating over $4 million in aggregate initial revenue. Base configurations retail between $2,495 and $2,995. Management executed an aggressive Average Selling Price (ASP) increase for the complete system from $2,595 to $3,495 (excluding shipping). Target gross margins are 40% for consumer and 70% for enterprise units.
* Omni Arena (B2B): Generated $653,491 in hardware sales (15.4% of net sales). The installed base sits at 80 out-of-home entertainment centers in the United States.
* Secondary Resales (B2B): Contributed $392,075, targeting a 40% gross margin threshold.
* Omni Care (Software/Service): Generated $175,333. The commercial maintenance contract carries an $8,000 initial fee, transitioning to $2,000 quarterly billings post-12 months.
* Omni Pro (Commercial Hardware): Generated $162,592. The legacy system maintains a historical installed base of over 4,000 units across 45 countries.
* Omniverse Credits (Software/Service): Generated $137,143, modeled on an estimated two-month consumption period.
Recurring software attachment rates establish the ecosystem baseline. Exactly 50% of Omni One buyers adopt the Omni Online subscription at checkout, priced at $14 per month or $140 annually. Commercial engagement is validated by a database of over 500,000 registered Omni Arena players, with power-users logging over 300 paid sessions. However, scaling this ecosystem required a 279% spike in advertising expenditures, escalating from $347,429 in FY2025 to $1,317,794 in FY2026, driving total selling expenses to $2,579,748 (up from $1,645,147).
Accounting policy implementations (ASC 606, ASC 842, ASC 330, ASC 718) triggered several balance sheet recalibrations. The deferred revenue balance contracted from $1,769,556 in FY2025 to $666,327 in FY2026, executing a high-efficiency conversion of $3,571,140 from the beginning balance. An estimated $449,635 in unreachable legacy Omni Pro preorders is slated for escheatment to the State of Texas. Furthermore, $226,445 in unfulfilled $200 Omni One preorders was reclassified into a $446,252 "Gift Card Liability." The company adopted ASU 2023-07, maintaining a single operating segment, and evaluates ASU 2023-09 and ASU 2024-03. Capitalized software and game design holding a gross historical cost of $2,578,050 is amortized over 3 to 5 years, while specialized machinery and equipment depreciates over 3 to 7 years, computer equipment over 5 years, and leasehold improvements over 3 to 5 years. Inventory valuation utilizes FIFO and weighted average methodologies.
The tax shield remains structurally massive but mathematically unrealizable. Virtuix Holdings Inc. carries $54,991,590 in federal Net Operating Loss (NOL) carryforwards. A legacy $12,561,963 tranche expires between 2034 and 2038, while a $42,429,627 post-2017 tranche holds indefinite carryforward status capped at offsetting 80% of taxable income. Management applied a full 100% valuation allowance of $(12,821,866) against net deferred tax assets, resulting in an effective income tax rate of exactly 0%.
Infrastructure Layout and Regional Moats
Virtuix Holdings Inc. operates a vertically integrated, highly concentrated physical supply chain anchored in Asia. Virtuix Manufacturing (Zhuhai) Co., Ltd. serves as the primary mainland China manufacturing base, exposing the company to acute tariff vulnerabilities. Virtuix Manufacturing Limited operates out of Hong Kong to execute USD-denominated international supplier transactions. To mitigate the specific risk of U.S. import tariffs breaching a 30% margin-crushing threshold, the company established Virtuix Manufacturing Taiwan, China Ltd. in January 2023. Leveraging a January 2026 trade agreement, goods sourced from this Taiwan, China hub benefit from a reduced 15% tariff, providing full assembly redundancy for the Omni One.
The off-balance sheet physical footprint is bounded by multi-year geographic lease commitments across the United States, mainland China, and Hong Kong, recording total Right-of-Use (ROU) assets of $779,514. Future undiscounted lease payments total $887,875, carrying an imputed interest deduction of $(108,361) at a 7.04% weighted-average discount rate over a 3.88-year term. The Austin, Texas headquarters lease dictates this schedule, expiring in November 2029. In parallel, the company initiated the dissolution of Heroix VR (Shanghai) Co., Ltd., a 49% equity-method joint venture, slated for closure by September 30, 2026, allowing the Zhuhai subsidiary to directly absorb the Chinese sales channel.
The competitive moat relies strictly on intellectual property and regulatory compliance architectures. The IP portfolio contains 25 issued patents (15 utility, 10 design), 5 pending applications, and 14 registered trademarks, providing global coverage across Australia, Brazil, mainland China, South Korea, Russia, Europe, and India. While inbound software licensing requires royalty payments of $1 to $8 per hardware unit, actual recorded expense dropped to $0 in FY2026 from $68 in FY2025.
Geographic and regulatory moats dictate the company's defense market penetration via the Virtual Terrain Walk (VTW) system. While Virtuix Holdings Inc. executed a proof-of-concept at I/ITSEC, secured a Phase 1 SBIR grant, and deployed test units to the U.S. Air Force Academy, YokoWERX, West Point, and the Marine Corps, meaningful revenue is delayed until at least FY2027. This delay is mandated by multi-year procurement cycles and the Federal Acquisition Regulation (FAR) and DFARS. Furthermore, the Buy American Act and the Berry Amendment force Virtuix Holdings Inc. to bypass its established Asian supply chain to secure domestic components for military deployments.
Direct hardware rivals remain segmented: KAT VR competes at the $1,000 to $2,000 low-end peripheral tier, Cyberith occupies the $8,000 to $10,000 mid-tier, and Infinadeck monopolizes the $50,000 to $60,000 ultra-high-end simulation sector. Virtuix Holdings Inc. mitigates broader stationary VR substitution through integration programs, including the "Made for Meta" initiative with Meta Platforms Inc.
HDIN Institutional Verdict
An audit of the capitalization table and post-balance-sheet footnotes reveals a precarious corporate governance structure masking a mathematically toxic debt profile. Virtuix Holdings Inc. operates with an accumulated deficit of $(79,291,843) and depressed Stockholders' Equity of $3,048,103 (averaging $1.12 million for the period, up from $(794,035) in FY2025). The debt maturity schedule outlines a catastrophic maturity cliff of $11,991,608 due in FY2027, followed by $2,682,310 in FY2028, composed of $6,086,943 in short-term notes and $2,428,835 in long-term notes (net of discounts).
To avert immediate insolvency, management executed aggressive, highly dilutive post-fiscal restructuring maneuvers with Streeterville Capital. On May 22, 2026, the company converted outstanding secured notes into a $3,471,923 Pre-Paid Purchase (PPP #2), permanently stripping all liens from the company’s assets. On June 1, 2026, Virtuix Holdings Inc. repriced outstanding Equity and Debt Financing Warrants from $6.00 to $4.00 per share, extending the exercise window to July 27, 2026, and triggering an immediate $424,403 financing penalty. Between April 10 and April 22, 2026, Streeterville exercised portions of these warrants, delivering $1,380,000 in cash for 230,000 shares. Between May 1 and May 27, 2026, an additional $284,500 of principal was extinguished for 93,333 Class A shares. These instruments mathematically penalize existing equity holders via 85% conversion discounts, 6% interest rates, and 8% to 10% Original Issue Discounts (OIDs).
Internal governance relies heavily on insider dominance and related-party liquidity. In August 2025, CEO Jan Goetgeluk exchanged 5.5 million Class A shares for Class B shares, securing absolute super-voting control via a 20-to-1 voting ratio. Under a Rule 10b5-1 trading plan, Goetgeluk liquidated 500,000 Class A shares between April 6 and May 6, 2026. The board history is characterized by high-yield internal borrowing: Director Ugo de Charette held a $100,000 note at an 18% interest rate, repaid at $130,723 in March 2026. An additional $217,678 at 18% was issued and repaid in May 2025, followed by late-2025 related-party notes totaling $225,000 (carrying 6% interest and a 10% OID), cleared in March 2026. While the company claims to have remediated material weaknesses in internal controls regarding related-party transactions prior to March 31, 2026, the equity compensation architecture remains aggressively dilutive. FY2026 saw the issuance of 2,179,992 Restricted Stock Units (RSUs) generating an unrecognized $3.43 million four-year expense overhang, trailing a massive FY2025 event where a newly appointed advisor received 2.75 million shares, booking a $4.7 million non-cash expense.
The sole disclosed legal contingency—a February 2024 Omni Arena personal injury lawsuit—was fully neutralized post-March 31, 2026, with a final release agreement entirely indemnified by the company's insurance provider, leaving $0 in accrued legal liabilities.
Presentation Download & Video Access:
- Presentation Download: Click the PDF download link under 'Related Topics' to access the full institutional presentation of this report.
- Video Link: Click this link to watch the HDIN analyst briefing on YouTube.
About HDIN Research:
HDIN Research is a premier global market intelligence and strategic advisory firm specializing in institutional-grade financial analysis, supply chain audits, and macroeconomic forecasting. Our dedicated sector analysts deliver actionable, data-driven insights tailored for private equity, hedge funds, and corporate strategy teams. Visit us at http://www.hdinresearch.com.
*2026 AI Transparency Footer:*
"This intelligence report was authored by HDIN Research analysts following a rigorous audit of official corporate filings. AI was utilized for massive-scale data synthesis and structural drafting, ensuring 100% inclusion of reported data points. All strategic insights, financial modeling, and final verdicts were verified by our editorial board to ensure professional accuracy and compliance with 2026 Google Search E-E-A-T standards."
* Virtuix Holdings Inc. engineered a 3,100-basis-point gross margin expansion to 25% in FY2026, driven by a $900 ASP hike on Omni One units, despite absorbing a $(16,799,253) net loss and $(9,504,380) operating cash burn.
* The supply chain architecture remains acutely bottlenecked in Zhuhai, mainland China, forcing a defensive pivot to Taiwan, China assembly hubs to hedge against tariffs breaching a 30% materiality threshold.
* Institutional viability hinges on restructuring a $11,991,608 FY2027 debt maturity cliff and scaling consumer adoption amidst customer acquisition costs that surged 279% year-over-year.
Figure Virtuix Holdings Inc: Strategic Architecture & Financial Performance Blueprint
Segmental Realities and Margin CompressionVirtuix Holdings Inc. [NASDAQ: VRTX] reported total net sales of $4,252,643 for the fiscal year ended March 31, 2026, representing an 18% year-over-year expansion. The balance sheet reflects a highly levered profile, with $11,936,309 in current assets against $8,768,103 in current liabilities, yielding a 1.36x current ratio. While cash and cash equivalents stand at $9,471,288, management explicitly projects a $2,500,000 liquidity shortfall to fund operations over the next 12 months.
Gross profit reached $1.04 million as gross margins reversed from negative -6% in FY2025 to a positive 25% in FY2026. However, operating losses deepened to $(10,319,352), driven by a $10.5 million combined selling, general, and administrative expense drag. Asset turnover collapsed to 0.41x, generating revenue against average total assets of $10,268,196 ($14,761,370 in FY2026 versus $5,775,023 in FY2025).
The $7.29 million variance between the net loss and operating cash flow is attributable strictly to $6,354,643 in total other expenses, explicitly anchored by $2,923,059 in non-cash discount amortization on notes payable, $2,694,722 in warrant modification expenses, $1,235,009 in stock issued for services, and $441,951 in stock-based compensation.
FY2026 Revenue and Unit Economics Breakdown
* Omni One (B2C/Enterprise): Contributed $2,732,009 (64.2% of net sales). The company successfully shipped 1,800 units by September 2025, generating over $4 million in aggregate initial revenue. Base configurations retail between $2,495 and $2,995. Management executed an aggressive Average Selling Price (ASP) increase for the complete system from $2,595 to $3,495 (excluding shipping). Target gross margins are 40% for consumer and 70% for enterprise units.
* Omni Arena (B2B): Generated $653,491 in hardware sales (15.4% of net sales). The installed base sits at 80 out-of-home entertainment centers in the United States.
* Secondary Resales (B2B): Contributed $392,075, targeting a 40% gross margin threshold.
* Omni Care (Software/Service): Generated $175,333. The commercial maintenance contract carries an $8,000 initial fee, transitioning to $2,000 quarterly billings post-12 months.
* Omni Pro (Commercial Hardware): Generated $162,592. The legacy system maintains a historical installed base of over 4,000 units across 45 countries.
* Omniverse Credits (Software/Service): Generated $137,143, modeled on an estimated two-month consumption period.
Recurring software attachment rates establish the ecosystem baseline. Exactly 50% of Omni One buyers adopt the Omni Online subscription at checkout, priced at $14 per month or $140 annually. Commercial engagement is validated by a database of over 500,000 registered Omni Arena players, with power-users logging over 300 paid sessions. However, scaling this ecosystem required a 279% spike in advertising expenditures, escalating from $347,429 in FY2025 to $1,317,794 in FY2026, driving total selling expenses to $2,579,748 (up from $1,645,147).
Accounting policy implementations (ASC 606, ASC 842, ASC 330, ASC 718) triggered several balance sheet recalibrations. The deferred revenue balance contracted from $1,769,556 in FY2025 to $666,327 in FY2026, executing a high-efficiency conversion of $3,571,140 from the beginning balance. An estimated $449,635 in unreachable legacy Omni Pro preorders is slated for escheatment to the State of Texas. Furthermore, $226,445 in unfulfilled $200 Omni One preorders was reclassified into a $446,252 "Gift Card Liability." The company adopted ASU 2023-07, maintaining a single operating segment, and evaluates ASU 2023-09 and ASU 2024-03. Capitalized software and game design holding a gross historical cost of $2,578,050 is amortized over 3 to 5 years, while specialized machinery and equipment depreciates over 3 to 7 years, computer equipment over 5 years, and leasehold improvements over 3 to 5 years. Inventory valuation utilizes FIFO and weighted average methodologies.
The tax shield remains structurally massive but mathematically unrealizable. Virtuix Holdings Inc. carries $54,991,590 in federal Net Operating Loss (NOL) carryforwards. A legacy $12,561,963 tranche expires between 2034 and 2038, while a $42,429,627 post-2017 tranche holds indefinite carryforward status capped at offsetting 80% of taxable income. Management applied a full 100% valuation allowance of $(12,821,866) against net deferred tax assets, resulting in an effective income tax rate of exactly 0%.
Infrastructure Layout and Regional Moats
Virtuix Holdings Inc. operates a vertically integrated, highly concentrated physical supply chain anchored in Asia. Virtuix Manufacturing (Zhuhai) Co., Ltd. serves as the primary mainland China manufacturing base, exposing the company to acute tariff vulnerabilities. Virtuix Manufacturing Limited operates out of Hong Kong to execute USD-denominated international supplier transactions. To mitigate the specific risk of U.S. import tariffs breaching a 30% margin-crushing threshold, the company established Virtuix Manufacturing Taiwan, China Ltd. in January 2023. Leveraging a January 2026 trade agreement, goods sourced from this Taiwan, China hub benefit from a reduced 15% tariff, providing full assembly redundancy for the Omni One.
The off-balance sheet physical footprint is bounded by multi-year geographic lease commitments across the United States, mainland China, and Hong Kong, recording total Right-of-Use (ROU) assets of $779,514. Future undiscounted lease payments total $887,875, carrying an imputed interest deduction of $(108,361) at a 7.04% weighted-average discount rate over a 3.88-year term. The Austin, Texas headquarters lease dictates this schedule, expiring in November 2029. In parallel, the company initiated the dissolution of Heroix VR (Shanghai) Co., Ltd., a 49% equity-method joint venture, slated for closure by September 30, 2026, allowing the Zhuhai subsidiary to directly absorb the Chinese sales channel.
The competitive moat relies strictly on intellectual property and regulatory compliance architectures. The IP portfolio contains 25 issued patents (15 utility, 10 design), 5 pending applications, and 14 registered trademarks, providing global coverage across Australia, Brazil, mainland China, South Korea, Russia, Europe, and India. While inbound software licensing requires royalty payments of $1 to $8 per hardware unit, actual recorded expense dropped to $0 in FY2026 from $68 in FY2025.
Geographic and regulatory moats dictate the company's defense market penetration via the Virtual Terrain Walk (VTW) system. While Virtuix Holdings Inc. executed a proof-of-concept at I/ITSEC, secured a Phase 1 SBIR grant, and deployed test units to the U.S. Air Force Academy, YokoWERX, West Point, and the Marine Corps, meaningful revenue is delayed until at least FY2027. This delay is mandated by multi-year procurement cycles and the Federal Acquisition Regulation (FAR) and DFARS. Furthermore, the Buy American Act and the Berry Amendment force Virtuix Holdings Inc. to bypass its established Asian supply chain to secure domestic components for military deployments.
Direct hardware rivals remain segmented: KAT VR competes at the $1,000 to $2,000 low-end peripheral tier, Cyberith occupies the $8,000 to $10,000 mid-tier, and Infinadeck monopolizes the $50,000 to $60,000 ultra-high-end simulation sector. Virtuix Holdings Inc. mitigates broader stationary VR substitution through integration programs, including the "Made for Meta" initiative with Meta Platforms Inc.
HDIN Institutional Verdict
An audit of the capitalization table and post-balance-sheet footnotes reveals a precarious corporate governance structure masking a mathematically toxic debt profile. Virtuix Holdings Inc. operates with an accumulated deficit of $(79,291,843) and depressed Stockholders' Equity of $3,048,103 (averaging $1.12 million for the period, up from $(794,035) in FY2025). The debt maturity schedule outlines a catastrophic maturity cliff of $11,991,608 due in FY2027, followed by $2,682,310 in FY2028, composed of $6,086,943 in short-term notes and $2,428,835 in long-term notes (net of discounts).
To avert immediate insolvency, management executed aggressive, highly dilutive post-fiscal restructuring maneuvers with Streeterville Capital. On May 22, 2026, the company converted outstanding secured notes into a $3,471,923 Pre-Paid Purchase (PPP #2), permanently stripping all liens from the company’s assets. On June 1, 2026, Virtuix Holdings Inc. repriced outstanding Equity and Debt Financing Warrants from $6.00 to $4.00 per share, extending the exercise window to July 27, 2026, and triggering an immediate $424,403 financing penalty. Between April 10 and April 22, 2026, Streeterville exercised portions of these warrants, delivering $1,380,000 in cash for 230,000 shares. Between May 1 and May 27, 2026, an additional $284,500 of principal was extinguished for 93,333 Class A shares. These instruments mathematically penalize existing equity holders via 85% conversion discounts, 6% interest rates, and 8% to 10% Original Issue Discounts (OIDs).
Internal governance relies heavily on insider dominance and related-party liquidity. In August 2025, CEO Jan Goetgeluk exchanged 5.5 million Class A shares for Class B shares, securing absolute super-voting control via a 20-to-1 voting ratio. Under a Rule 10b5-1 trading plan, Goetgeluk liquidated 500,000 Class A shares between April 6 and May 6, 2026. The board history is characterized by high-yield internal borrowing: Director Ugo de Charette held a $100,000 note at an 18% interest rate, repaid at $130,723 in March 2026. An additional $217,678 at 18% was issued and repaid in May 2025, followed by late-2025 related-party notes totaling $225,000 (carrying 6% interest and a 10% OID), cleared in March 2026. While the company claims to have remediated material weaknesses in internal controls regarding related-party transactions prior to March 31, 2026, the equity compensation architecture remains aggressively dilutive. FY2026 saw the issuance of 2,179,992 Restricted Stock Units (RSUs) generating an unrecognized $3.43 million four-year expense overhang, trailing a massive FY2025 event where a newly appointed advisor received 2.75 million shares, booking a $4.7 million non-cash expense.
The sole disclosed legal contingency—a February 2024 Omni Arena personal injury lawsuit—was fully neutralized post-March 31, 2026, with a final release agreement entirely indemnified by the company's insurance provider, leaving $0 in accrued legal liabilities.
Presentation Download & Video Access:
- Presentation Download: Click the PDF download link under 'Related Topics' to access the full institutional presentation of this report.
- Video Link: Click this link to watch the HDIN analyst briefing on YouTube.
About HDIN Research:
HDIN Research is a premier global market intelligence and strategic advisory firm specializing in institutional-grade financial analysis, supply chain audits, and macroeconomic forecasting. Our dedicated sector analysts deliver actionable, data-driven insights tailored for private equity, hedge funds, and corporate strategy teams. Visit us at http://www.hdinresearch.com.
*2026 AI Transparency Footer:*
"This intelligence report was authored by HDIN Research analysts following a rigorous audit of official corporate filings. AI was utilized for massive-scale data synthesis and structural drafting, ensuring 100% inclusion of reported data points. All strategic insights, financial modeling, and final verdicts were verified by our editorial board to ensure professional accuracy and compliance with 2026 Google Search E-E-A-T standards."