Yamaha Corporation: Sustained SaaS Pivot Near Kakegawa and Tenryu as $1,018.07 Million Inventory Bloat Signals Structural Margin Compression
Date : 2026-06-29
Reading : 178
HDIN Executive Takeaways
* Core operating profit contracted 13.2% year-over-year to $213.14 million (¥31.88 billion), while fixed-cost labor inflation drove total Selling, General, and Administrative (SG&A) expenses to $956.69 million, aggressively squeezing actual margins to 6.9% against a 13.5% management target.
* Persistent channel destocking pressures left $1,018.07 million in bloated inventory, heavily concentrated in legacy manufacturing nodes across China and Indonesia, pushing Days Sales of Inventory (DSI) to 191.4 days and cannibalizing capital efficiency.
* A 112% Total Return Ratio masks underlying volume contraction; reported top-line growth of $21.73 million is a mathematical illusion driven by a $120.08 million foreign exchange tailwind, hiding a 3.2% constant-currency revenue decline.
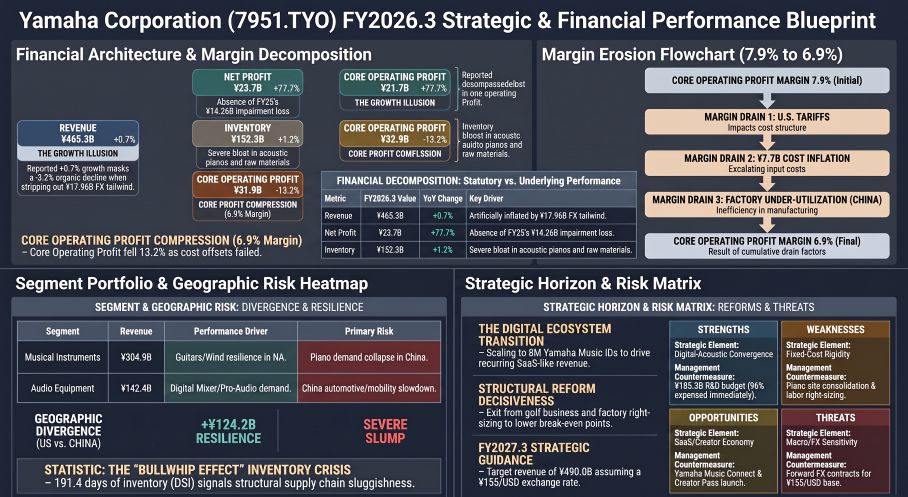
Figure Yamaha Corporation FY2026 Strategic & Financial Performance Blueprint
 Segmental Realities and Financial Deconstruction
In FY2026.3, Yamaha Corporation [TYO: 7951] reported consolidated revenue of $3,111.15 million (¥465.33 billion), nominally growing +0.7% (+$21.73 million / ¥3.25 billion) against a base exchange rate of 1 USD = 149.5686 JPY. However, the 77.7% surge in net profit attributable to owners of the parent—reaching $158.59 million—is an accounting distortion. The prior fiscal year (FY2025.3) was artificially depressed by a $95.36 million (¥14.26 billion) base-year impairment loss targeting telecommunications and audio assets. Stripping away these anomalies reveals a deteriorating core operating profit, reported variously at $213.14 million and $213.89 million (¥31.9 billion), heavily suppressed by a $51.48 million (¥7.7 billion) structural cost increase from raw material inflation and U.S. tariffs.
The firm's asset devaluation cycle is nearing completion, with aggregate impairment losses dropping to $22.30 million (¥3.34 billion) in FY2026.3, alongside minimal standard business restructuring expenses of $1.94 million (¥290 million).
FY2026.3 Segmental Architecture Matrix:
* Musical Instruments: Revenue reached $2,038.69 million (¥304.9 billion), up +3.0% YoY. However, core operating profit contracted -16.1% to $141.86 million (¥21,218 million / ¥21.2 billion) due to shifting product mixes away from high-margin acoustics.
* Audio Equipment (30.6% of Corporate Revenue): Revenue contracted -3.6% to $952.37 million (¥142.4 billion). Core operating profit fell -7.6% to $72.03 million (¥10,774 million / ¥10.8 billion), hampered by post-pandemic normalization in consumer audio and a slowdown in mobility audio integration for the Chinese automotive sector.
Table 1: 5-Year Operating Cash Flow & Capital Efficiency Trajectory
Infrastructure Layout and Supply Chain Architecture
Yamaha maintains high-value acoustic production and core R&D domestically at its Kakegawa and Tenryu factories in Japan, where flagship CFX concert grand pianos and precision manufacturing are anchored. However, its decentralized volume manufacturing base remains dangerously exposed to Asian macroeconomic cycles.
The firm's localized Chinese production nodes—including Hangzhou Yamaha Musical Instruments, Xiaoshan Yamaha, Tianjin Yamaha, and Suzhou Yamaha—suffered severe fixed-cost under-absorption as acoustic piano demand plummeted. To mitigate single-country reliance, Yamaha leverages a "China+1" diversification framework via ASEAN production baselines in Malaysia (Yamaha Electronics Manufacturing Sdn. Bhd.) and Indonesia (PT. Yamaha Musical Products Indonesia and PT. Yamaha Music Manufacturing Indonesia). Notably, the Indonesian hubs (YMPA and YI) absorbed $69.47 million (¥10.39 billion) of the prior year's $95.36 million impairment charge as management aggressively wrote down legacy manufacturing infrastructure. Emerging nodes in India (Yamaha Music India Pvt. Ltd.) and Taiwan, China serve localized distribution logic.
Working Capital Paralyzation and Golf Exit Execution:
* Inventory Bloat: Consolidated ending inventory expanded to $1,018.07 million (¥152.3 billion) from an already elevated $1,006.15 million (¥150.5 billion) in FY2025.3.
* Days Sales of Inventory (DSI): Based on Cost of Goods Sold scaling from $1,911.76 million (¥285.93 billion) in FY25.3 to $1,941.30 million (¥290.35 billion) in FY26.3, the DSI calculation remains stagnant at 191.4 days (versus 192.1 days in the prior year).
* Golf Divestiture Financials: Execution of the golf business exit generated a $14.03 million one-off restructuring expense. Within the broader portfolio, management recorded $13.37 million (¥2.0 billion) in structural reform expenses, which integrated specific write-downs of $13.06 million for the INPRES brand and $9.23 million for the RMX brand, culminating in an explicitly separated $8.05 million (¥1.20 billion) operational loss on the golf business exit.
Human Capital Dynamics and Cost Inflation
Despite executing systemic structural reforms that successfully downsized the global headcount by 1,063 Full-Time Equivalents (a 5.6% YoY workforce reduction), Yamaha failed to optimize aggregate human capital costs. Employee benefit expenses inflated from $417.23 million (¥62.40 billion) in FY25.3 to $427.75 million (¥63.98 billion) in FY26.3. Consequently, total SG&A expenses ballooned from $932.14 million (¥139.42 billion) to $956.69 million (¥143.09 billion), dragging the core operating margin down from 7.9% to 6.9%.
Table 2: 5-Year Headcount & Revenue Productivity (Per Employee)
*FY2026.3 Headcount Distribution:* The legacy Musical Instruments segment retains 12,694 employees (71.0%), Audio Equipment retains 4,374 (24.5%), and Corporate/Other retains 818 (4.5%).
R&D Capital Allocation and HDIN Institutional Verdict
Yamaha is executing a highly asymmetric Research and Development (R&D) strategy under its "Rebuild & Evolve" Mid-Term Management Plan. Despite accounting for only 30.6% of revenue, the Audio Equipment segment consumed 52.3% of the total R&D budget at $96.93 million (¥14.49 billion), heavily indexing toward Spatial Acoustics, ADECIA remote conferencing, and ViReal technologies. The Musical Instruments segment utilized 43.3% at $80.40 million (¥12.02 billion), focusing on SILENT instruments, TransAcoustic technologies, and AI partnerships like Boomy Corporation and SEQTRAK. The Corporate/Other division consumed the remaining 4.3% at $8.00 million (¥1.19 billion).
Total R&D expenditure expanded from $180.36 million (¥26.97 billion / 5.84% of $3,089.42 million / ¥462.08 billion revenue) in FY25.3 to $185.33 million (¥27.72 billion / 5.96% of revenue) in FY26.3. Critically, only $6.20 million (¥928 million) was capitalized as intangible assets, meaning over 96% of R&D was expensed through the P&L, acting as an acute short-term drag on core profitability while shielding the balance sheet from capitalization bloat.
HDIN Strategic Dashboard Execution:
* Yamaha Music ID & Ecosystem: The firm has reached 8 million IDs against a 10 million ID target, integrating properties like Steinberg, SYNCROOM, Riverside, LANDR, and Groover into the "Yamaha Creator Pass." Management projects Music Connect recurring revenues to hit $33.43 million (¥5 billion) by FY2028, scaling to $66.86 million (¥10 billion) long-term.
* Capital Allocation Targets: Yamaha deployed $76.22 million (¥11.4 billion) in strategic investments, tracking against a 3-year cumulative target of $401.15 million (¥60 billion), and launched 7 new business projects out of a targeted 20.
* Profitability & Governance: The firm missed its 5% CAGR revenue target (hitting 0.7%) and achieved a Return on Equity (ROE) of just 5.1% against a 10% target. However, management authorized aggressive share repurchases, delivering a Total Return Ratio of 112%, radically exceeding the "50% or more" target structure.
The FX Translation Illusion:
Yamaha generates 76% of its revenue overseas ($2,363.90 million). Regional breakdowns report North America at $830.40 million (¥124.2 billion), Japan at $747.29 million (¥111.8 billion), Europe at $699.92 million (¥104.7 billion), China plunging from $336.80 million (¥50.4 billion) to $288.66 million (¥43.2 billion), and Other Regions at $586.71 million (¥87.8 billion).
The positive foreign exchange impact artificially inflated revenue by $120.08 million (¥17.96 billion) and core operating profit by $35.57 million (¥5.32 billion). On a constant-currency basis, physical volume contraction drove a $98.35 million (¥14.71 billion), or -3.2%, organic revenue decline. Looking ahead to FY2027.3, management models baseline rates of ¥155/USD and ¥180/EUR (up from FY26.3 averages of ¥150/USD and ¥173/EUR). Sensitivity calculations indicate that for every 1 JPY depreciation against the USD, pre-tax profit expands by $2.49 million (¥373 million); against the EUR, it expands by $0.15 million (¥22 million). Moving to a ¥155/USD environment secures a $12.45 million mathematical tailwind, but exposes a catastrophic vulnerability: a sharp 20-Yen appreciation against the dollar would vaporize approximately $49.8 million in pre-tax profit, instantly revealing the structural demand elasticity hidden by favorable translation math.
Presentation Download & Video Access:
Presentation Download: Click the PDF download link under 'Related Topics' to access the full institutional presentation of this report.
Video Link: Click this link to watch the HDIN analyst briefing on YouTube.
About HDIN Research:
HDIN Research is a premier global market intelligence and strategic advisory firm specializing in institutional-grade financial analysis, supply chain audits, and macroeconomic forecasting. Our dedicated sector analysts deliver actionable, data-driven insights tailored for private equity, hedge funds, and corporate strategy teams. Visit us at http://www.hdinresearch.com.
2026 AI Transparency Footer:
"This intelligence report was authored by HDIN Research analysts following a rigorous audit of official corporate filings. AI was utilized for massive-scale data synthesis and structural drafting, ensuring 100% inclusion of reported data points. All strategic insights, financial modeling, and final verdicts were verified by our editorial board to ensure professional accuracy and compliance with 2026 Google Search E-E-A-T standards."
* Core operating profit contracted 13.2% year-over-year to $213.14 million (¥31.88 billion), while fixed-cost labor inflation drove total Selling, General, and Administrative (SG&A) expenses to $956.69 million, aggressively squeezing actual margins to 6.9% against a 13.5% management target.
* Persistent channel destocking pressures left $1,018.07 million in bloated inventory, heavily concentrated in legacy manufacturing nodes across China and Indonesia, pushing Days Sales of Inventory (DSI) to 191.4 days and cannibalizing capital efficiency.
* A 112% Total Return Ratio masks underlying volume contraction; reported top-line growth of $21.73 million is a mathematical illusion driven by a $120.08 million foreign exchange tailwind, hiding a 3.2% constant-currency revenue decline.
Figure Yamaha Corporation FY2026 Strategic & Financial Performance Blueprint
Segmental Realities and Financial DeconstructionIn FY2026.3, Yamaha Corporation [TYO: 7951] reported consolidated revenue of $3,111.15 million (¥465.33 billion), nominally growing +0.7% (+$21.73 million / ¥3.25 billion) against a base exchange rate of 1 USD = 149.5686 JPY. However, the 77.7% surge in net profit attributable to owners of the parent—reaching $158.59 million—is an accounting distortion. The prior fiscal year (FY2025.3) was artificially depressed by a $95.36 million (¥14.26 billion) base-year impairment loss targeting telecommunications and audio assets. Stripping away these anomalies reveals a deteriorating core operating profit, reported variously at $213.14 million and $213.89 million (¥31.9 billion), heavily suppressed by a $51.48 million (¥7.7 billion) structural cost increase from raw material inflation and U.S. tariffs.
The firm's asset devaluation cycle is nearing completion, with aggregate impairment losses dropping to $22.30 million (¥3.34 billion) in FY2026.3, alongside minimal standard business restructuring expenses of $1.94 million (¥290 million).
FY2026.3 Segmental Architecture Matrix:
* Musical Instruments: Revenue reached $2,038.69 million (¥304.9 billion), up +3.0% YoY. However, core operating profit contracted -16.1% to $141.86 million (¥21,218 million / ¥21.2 billion) due to shifting product mixes away from high-margin acoustics.
* Audio Equipment (30.6% of Corporate Revenue): Revenue contracted -3.6% to $952.37 million (¥142.4 billion). Core operating profit fell -7.6% to $72.03 million (¥10,774 million / ¥10.8 billion), hampered by post-pandemic normalization in consumer audio and a slowdown in mobility audio integration for the Chinese automotive sector.
Table 1: 5-Year Operating Cash Flow & Capital Efficiency Trajectory
| Fiscal Year | Operating Cash Flow (OCF) | Free Cash Flow (FCF) | Key Trend |
|---|---|---|---|
| FY2022.3 | $240.80 million | $(51.42) million | Negative FCF |
| FY2023.3 | $99.23 million | $(44.94) million | Negative FCF |
| FY2024.3 | $293.08 million | $186.76 million | Strong recovery; positive FCF |
| FY2025.3 | $369.60 million | $315.41 million | Peak operating cash generation |
| FY2026.3 | $306.06 million | $253.20 million | OCF declined 17.2% YoY; FCF remained strong |
Infrastructure Layout and Supply Chain Architecture
Yamaha maintains high-value acoustic production and core R&D domestically at its Kakegawa and Tenryu factories in Japan, where flagship CFX concert grand pianos and precision manufacturing are anchored. However, its decentralized volume manufacturing base remains dangerously exposed to Asian macroeconomic cycles.
The firm's localized Chinese production nodes—including Hangzhou Yamaha Musical Instruments, Xiaoshan Yamaha, Tianjin Yamaha, and Suzhou Yamaha—suffered severe fixed-cost under-absorption as acoustic piano demand plummeted. To mitigate single-country reliance, Yamaha leverages a "China+1" diversification framework via ASEAN production baselines in Malaysia (Yamaha Electronics Manufacturing Sdn. Bhd.) and Indonesia (PT. Yamaha Musical Products Indonesia and PT. Yamaha Music Manufacturing Indonesia). Notably, the Indonesian hubs (YMPA and YI) absorbed $69.47 million (¥10.39 billion) of the prior year's $95.36 million impairment charge as management aggressively wrote down legacy manufacturing infrastructure. Emerging nodes in India (Yamaha Music India Pvt. Ltd.) and Taiwan, China serve localized distribution logic.
Working Capital Paralyzation and Golf Exit Execution:
* Inventory Bloat: Consolidated ending inventory expanded to $1,018.07 million (¥152.3 billion) from an already elevated $1,006.15 million (¥150.5 billion) in FY2025.3.
* Days Sales of Inventory (DSI): Based on Cost of Goods Sold scaling from $1,911.76 million (¥285.93 billion) in FY25.3 to $1,941.30 million (¥290.35 billion) in FY26.3, the DSI calculation remains stagnant at 191.4 days (versus 192.1 days in the prior year).
* Golf Divestiture Financials: Execution of the golf business exit generated a $14.03 million one-off restructuring expense. Within the broader portfolio, management recorded $13.37 million (¥2.0 billion) in structural reform expenses, which integrated specific write-downs of $13.06 million for the INPRES brand and $9.23 million for the RMX brand, culminating in an explicitly separated $8.05 million (¥1.20 billion) operational loss on the golf business exit.
Human Capital Dynamics and Cost Inflation
Despite executing systemic structural reforms that successfully downsized the global headcount by 1,063 Full-Time Equivalents (a 5.6% YoY workforce reduction), Yamaha failed to optimize aggregate human capital costs. Employee benefit expenses inflated from $417.23 million (¥62.40 billion) in FY25.3 to $427.75 million (¥63.98 billion) in FY26.3. Consequently, total SG&A expenses ballooned from $932.14 million (¥139.42 billion) to $956.69 million (¥143.09 billion), dragging the core operating margin down from 7.9% to 6.9%.
Table 2: 5-Year Headcount & Revenue Productivity (Per Employee)
| Fiscal Year | Employees | Revenue per Employee (USD / JPY) |
|---|---|---|
| FY2022.3 | 19,895 | $137.18k (¥20.52 million) |
| FY2023.3 | 20,027 | $150.70k (¥22.54 million) |
| FY2024.3 | 19,644 | $157.54k (¥23.56 million) |
| FY2025.3 | 18,949 | $163.04k (¥24.39 million) |
| FY2026.3 | 17,886 | $173.94k (¥26.02 million) |
*FY2026.3 Headcount Distribution:* The legacy Musical Instruments segment retains 12,694 employees (71.0%), Audio Equipment retains 4,374 (24.5%), and Corporate/Other retains 818 (4.5%).
R&D Capital Allocation and HDIN Institutional Verdict
Yamaha is executing a highly asymmetric Research and Development (R&D) strategy under its "Rebuild & Evolve" Mid-Term Management Plan. Despite accounting for only 30.6% of revenue, the Audio Equipment segment consumed 52.3% of the total R&D budget at $96.93 million (¥14.49 billion), heavily indexing toward Spatial Acoustics, ADECIA remote conferencing, and ViReal technologies. The Musical Instruments segment utilized 43.3% at $80.40 million (¥12.02 billion), focusing on SILENT instruments, TransAcoustic technologies, and AI partnerships like Boomy Corporation and SEQTRAK. The Corporate/Other division consumed the remaining 4.3% at $8.00 million (¥1.19 billion).
Total R&D expenditure expanded from $180.36 million (¥26.97 billion / 5.84% of $3,089.42 million / ¥462.08 billion revenue) in FY25.3 to $185.33 million (¥27.72 billion / 5.96% of revenue) in FY26.3. Critically, only $6.20 million (¥928 million) was capitalized as intangible assets, meaning over 96% of R&D was expensed through the P&L, acting as an acute short-term drag on core profitability while shielding the balance sheet from capitalization bloat.
HDIN Strategic Dashboard Execution:
* Yamaha Music ID & Ecosystem: The firm has reached 8 million IDs against a 10 million ID target, integrating properties like Steinberg, SYNCROOM, Riverside, LANDR, and Groover into the "Yamaha Creator Pass." Management projects Music Connect recurring revenues to hit $33.43 million (¥5 billion) by FY2028, scaling to $66.86 million (¥10 billion) long-term.
* Capital Allocation Targets: Yamaha deployed $76.22 million (¥11.4 billion) in strategic investments, tracking against a 3-year cumulative target of $401.15 million (¥60 billion), and launched 7 new business projects out of a targeted 20.
* Profitability & Governance: The firm missed its 5% CAGR revenue target (hitting 0.7%) and achieved a Return on Equity (ROE) of just 5.1% against a 10% target. However, management authorized aggressive share repurchases, delivering a Total Return Ratio of 112%, radically exceeding the "50% or more" target structure.
The FX Translation Illusion:
Yamaha generates 76% of its revenue overseas ($2,363.90 million). Regional breakdowns report North America at $830.40 million (¥124.2 billion), Japan at $747.29 million (¥111.8 billion), Europe at $699.92 million (¥104.7 billion), China plunging from $336.80 million (¥50.4 billion) to $288.66 million (¥43.2 billion), and Other Regions at $586.71 million (¥87.8 billion).
The positive foreign exchange impact artificially inflated revenue by $120.08 million (¥17.96 billion) and core operating profit by $35.57 million (¥5.32 billion). On a constant-currency basis, physical volume contraction drove a $98.35 million (¥14.71 billion), or -3.2%, organic revenue decline. Looking ahead to FY2027.3, management models baseline rates of ¥155/USD and ¥180/EUR (up from FY26.3 averages of ¥150/USD and ¥173/EUR). Sensitivity calculations indicate that for every 1 JPY depreciation against the USD, pre-tax profit expands by $2.49 million (¥373 million); against the EUR, it expands by $0.15 million (¥22 million). Moving to a ¥155/USD environment secures a $12.45 million mathematical tailwind, but exposes a catastrophic vulnerability: a sharp 20-Yen appreciation against the dollar would vaporize approximately $49.8 million in pre-tax profit, instantly revealing the structural demand elasticity hidden by favorable translation math.
Presentation Download & Video Access:
Presentation Download: Click the PDF download link under 'Related Topics' to access the full institutional presentation of this report.
Video Link: Click this link to watch the HDIN analyst briefing on YouTube.
About HDIN Research:
HDIN Research is a premier global market intelligence and strategic advisory firm specializing in institutional-grade financial analysis, supply chain audits, and macroeconomic forecasting. Our dedicated sector analysts deliver actionable, data-driven insights tailored for private equity, hedge funds, and corporate strategy teams. Visit us at http://www.hdinresearch.com.
2026 AI Transparency Footer:
"This intelligence report was authored by HDIN Research analysts following a rigorous audit of official corporate filings. AI was utilized for massive-scale data synthesis and structural drafting, ensuring 100% inclusion of reported data points. All strategic insights, financial modeling, and final verdicts were verified by our editorial board to ensure professional accuracy and compliance with 2026 Google Search E-E-A-T standards."