Niterra: $986.1M Advanced Ceramics Vertical Integration Near Nagoya as 320-Basis-Point Margin Expansion Validates Non-ICE Pivot
Date : 2026-06-30
Reading : 116
HDIN Executive Takeaways
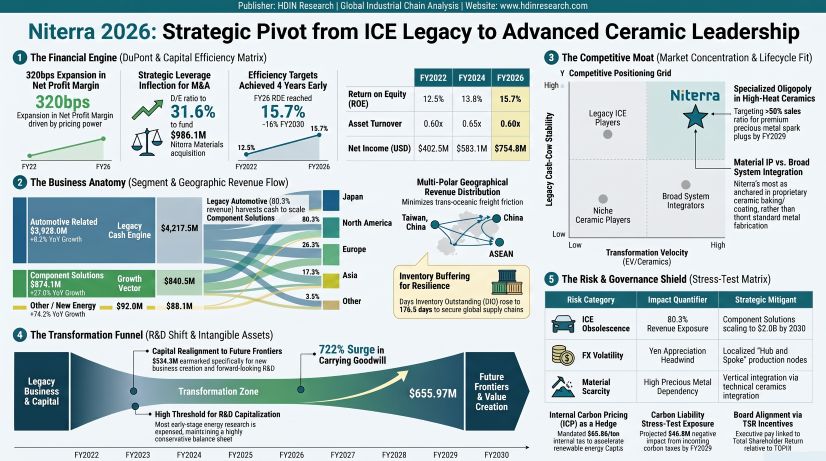
* Niterra Co. [TYO: 5334] executed a $986.1 million cash buyout of Niterra Materials, absorbing critical technical ceramics intellectual property and inflating goodwill carrying value to $655.97 million to insulate upstream supply chains against geopolitical friction.
* The global manufacturing footprint delegates high-margin downstream commercialization to the Americas and EMEA, directly offsetting centralized Japanese production risks mapped under stringent IPCC RCP8.5 physical climate scenarios.
* Relentless pricing power within the internal combustion engine aftermarket drove a 320-basis-point net profit margin expansion, funding a $2,139.5 million capital reallocation into solid-state battery electrolytes and medical respiratory technology.
Figure Niterra 2026: Strategic Pivot from lCE Legacy to Advanced Ceramic Leadership
 Segmental Realities and Financial Architecture
Niterra Co. operates a bifurcated internal combustion engine (ICE) cash generation and technical pivot model. Over the five-year evaluation period (FY22–FY26), total enterprise revenue expanded at a compound annual growth rate (CAGR) of 10.4%, scaling from $3,287.7 million to $4,888.8 million. Management engineered a 320-basis-point net profit margin expansion, increasing from 12.2% ($402.5 million net income on $3,287.7 million in sales) to 15.4% ($754.8 million net income on $4,888.8 million in sales).
All financial metrics converted at 1 USD = 149.5686 JPY
FY2026 Segmental Output & Revenue Mix
* Automotive Related Segment: Generated $3,928.0 million (80.3% of total sales), expanding 8.2% year-over-year from $3,629.1 million in FY25. Production output outpaced sales, scaling 14.9% to $4,217.5 million, indicating a strategic inventory buffering mandate.
* *Spark Plugs:* Generated $2,612.2 million.
* *Sensors:* Generated $1,315.8 million, growing 9.2% year-over-year.
* Component Solutions Segment: Reached $874.1 million (17.9% of total revenue), expanding 27.0% year-over-year. Production values scaled 25.1% to $840.5 million.
* Other / New Energy Ventures: Generated $92.0 million (1.8% of top-line revenue), expanding 74.2% year-over-year.
The balance sheet structure transition is marked by a deliberate levering up to fund inorganic acquisitions. The debt-to-equity ratio increased from 23.2% in FY25 to 31.6% in FY26 as total interest-bearing debt expanded from $1,047.6 million to $1,621.1 million, backed by $1.27 billion in consolidated corporate bonds. Total assets expanded 23.2% year-over-year to $8,164.2 million against an equity base of $5,130.9 million, settling the equity multiplier at 1.59x (ranging historically between 1.47x and 1.60x). The asset turnover ratio, after accelerating to 0.66x in FY25, reverted to 0.60x due to the denominator effect of M&A injections.
Working capital metrics point to supply chain fortification. The cash conversion cycle elongated from 199 days to 206 days. Days Sales Outstanding (DSO) extended from 82.5 to 85.9 days, while Days Inventory Outstanding (DIO) scaled from 170.0 to 176.5 days, reflecting a direct $290.4 million inventory expansion. Days Payable Outstanding (DPO) provided partial offset, increasing from 53.3 to 56.5 days. Current assets of $4,400.9 million effectively cover current liabilities of $1,698.8 million. Operating Cash Flow (OCF) contracted to $731.3 million in FY26, compressing the OCF-to-Net Income conversion ratio to 0.97x, down from 1.43x in FY24 and FY25.
Infrastructure Layout and Regional Moats
Niterra Co. relies on a highly integrated spatial distribution, placing intellectual property incubation and ceramic baking nodes centrally in Japan while decentralizing distribution nodes globally.
Regional Operating Footprint:
* Japan: The primary upstream hub, generating $778.7 million (15.9% of global sales). This region holds over $568.0 million in primary industrial Property, Plant, and Equipment (PPE), hosting wholly-owned subsidiaries WKS, NTK Ceramics, and the newly acquired Niterra Materials.
* Americas: Anchors over $95.0 million in localized PPE. Niterra North America, Inc. stands as the dominant regional cash entity, generating $967.47 million in standalone sales and $30.92 million in net profit, backed by a $761.08 million equity base. Sub-entities include CAIRE Inc., Wells Vehicle Electronics, and MGC Diagnostics Holdings, Inc.
* EMEA: Driven by stringent EURO7 emission standards, Niterra EMEA GmbH recorded $978.20 million in sales and $22.02 million in net profit.
* Asia-Pacific: Operations across Taiwan, China, alongside ASEAN hubs in Thailand, Malaysia, Vietnam, and Indonesia, function as the primary regional assembly channels adjacent to global semiconductor supply lines.
The capital expenditure footprint confirms a massive rotation. Routine PPE CapEx remains confined to $200.0 million to $245.0 million. However, net cash outflows from investing activities expanded from $229.0 million in FY25 to $1,106.7 million in FY26. This was driven primarily by the $986.07 million cash expenditure to acquire Niterra Materials, vertically integrating advanced substrates (such as LLZO for solid-state batteries, SOFC, and SOEC applications). This transaction forced total recognized goodwill to escalate from $90.8 million to $655.97 million, with Niterra Materials alone carrying a $588.33 million goodwill premium. Identifiable intangible assets expanded to $355.86 million. Not all M&A yielded instant results; strict IFRS impairment scrutiny was triggered for MGC Diagnostics Holdings, Inc. and Whocanfixmycar.com Ltd.
Under IFRS 16, Niterra Co. maintains a highly conservative off-balance sheet posture, recording $78.54 million in Right-of-Use assets against $133.46 million in total lease liabilities. The Japanese statutory tax rate of 30.6% was optimally compressed to an effective tax rate of 29.6%. This 100-basis-point operational tax shield was executed via R&D tax credits (-2.1%, up from -0.7% in FY25), equity method earnings (-1.7%), non-taxable dividends (-1.3%), and foreign rate differentials (-0.5%). Government subsidy income scaled 114.4% year-over-year, from $13.91 million to $29.84 million, though this represents merely 2.7% of the total $1,106.41 million operating profit. Deferred Tax Assets (DTAs) included $78.38 million for retirement liabilities and $47.92 million for inventory adjustments. Management registered deep pessimism regarding peripheral ventures, reporting $273.39 million in unrecognized DTAs (down from $294.25 million), of which $204.96 million expire beyond five years or lack an expiration date.
HDIN Institutional Verdict and Capital Returns
The executive management team at Niterra Co. successfully front-ran its own "2030 Long-Term Management Plan" capital efficiency goals, delivering a 15.7% Return on Equity (ROE) and a 12.7% Return on Invested Capital (ROIC) in FY26, beating the stated 12% ROIC target four years early. The board targets a 16% ROE by FY30.
Pricing inelasticity dictates the firm's forward cash projections. Management modeled extracting $5,549.3 million in operating cash inflows from legacy automotive units while driving an EBITDA target of $1,905.5 million by FY30, scaled from $1,170.0 million in FY25. The firm explicitly mandates driving a sales ratio of >50% for high-margin precious metal spark plugs and >50% for universal wide-band air-fuel sensors by FY29. Of the planned $6,685.9 million in mid-term capital deployment, ICE legacy operations are strictly capped at $2,273.2 million. The non-ICE transition forces $2,139.5 million into Component Solutions (targeting revenue to scale from $762.2 million to $2,005.8 million) and $334.3 million directly into new business R&D. Total consolidated R&D expenditures expanded from $229.9 million in FY25 to $234.8 million in FY26.
Shareholder returns operate on an aggressive mandate. Dividends per share expanded relentlessly from 102 JPY ($0.68) in FY22 to 205 JPY ($1.37) in FY26, keeping the payout ratio stable between 41.6% and 42.7%. The board earmarked $1,604.6 million for direct shareholder returns, executing a 7.2 million share repurchase authorization ($200.5 million maximum), successfully liquidating a $100.2 million tranche at a 50% execution rate. Concurrently, management modeled $1,136.6 million in cash generation via asset compression, actively liquidating 48 specific cross-shareholding issues valued at $86.86 million.
Corporate governance frameworks rely on structurally aligned compensation. Executive remuneration scaled marginally from $4.57 million to $4.69 million, tethered to TOPIX index relative returns and non-financial metrics, including maintaining an employee engagement score of 3.56+. The board mandates a majority outside director ratio (>50%) and >30% female/foreign board composition by FY29.
Environmental risk mapping enforces an aggressive Internal Carbon Pricing (ICP) mechanism set at $66.86 per ton (10,000 JPY/t-CO2). The firm quantified a $46.80 million financial exposure to incoming carbon taxes by FY29. Consequently, Niterra Co. targets a 46.0% Scope 1 and 2 emissions reduction by 2030 (71.4% by 2035) and a 30.0% Scope 3 reduction by 2030, baselined against 2018. Additionally, global revenue forecasts assume a rigid foreign exchange appreciation, modeling the JPY/USD rate moving from 153 to 135 by FY30, enforcing local production alignments to hedge against repatriation compression.
Presentation Download & Video Access:
- Presentation Download: Click the PDF download link under 'Related Topics' to access the full institutional presentation of this report.
- Video Link: Click this link to watch the HDIN analyst briefing on YouTube.
About HDIN Research:
HDIN Research is a premier global market intelligence and strategic advisory firm specializing in institutional-grade financial analysis, supply chain audits, and macroeconomic forecasting. Our dedicated sector analysts deliver actionable, data-driven insights tailored for private equity, hedge funds, and corporate strategy teams. Visit us at http://www.hdinresearch.com.
2026 AI Transparency Footer:
"This intelligence report was authored by HDIN Research analysts following a rigorous audit of official corporate filings. AI was utilized for massive-scale data synthesis and structural drafting, ensuring 100% inclusion of reported data points. All strategic insights, financial modeling, and final verdicts were verified by our editorial board to ensure professional accuracy and compliance with 2026 Google Search E-E-A-T standards."
* Niterra Co. [TYO: 5334] executed a $986.1 million cash buyout of Niterra Materials, absorbing critical technical ceramics intellectual property and inflating goodwill carrying value to $655.97 million to insulate upstream supply chains against geopolitical friction.
* The global manufacturing footprint delegates high-margin downstream commercialization to the Americas and EMEA, directly offsetting centralized Japanese production risks mapped under stringent IPCC RCP8.5 physical climate scenarios.
* Relentless pricing power within the internal combustion engine aftermarket drove a 320-basis-point net profit margin expansion, funding a $2,139.5 million capital reallocation into solid-state battery electrolytes and medical respiratory technology.
Figure Niterra 2026: Strategic Pivot from lCE Legacy to Advanced Ceramic Leadership
Segmental Realities and Financial ArchitectureNiterra Co. operates a bifurcated internal combustion engine (ICE) cash generation and technical pivot model. Over the five-year evaluation period (FY22–FY26), total enterprise revenue expanded at a compound annual growth rate (CAGR) of 10.4%, scaling from $3,287.7 million to $4,888.8 million. Management engineered a 320-basis-point net profit margin expansion, increasing from 12.2% ($402.5 million net income on $3,287.7 million in sales) to 15.4% ($754.8 million net income on $4,888.8 million in sales).
All financial metrics converted at 1 USD = 149.5686 JPY
FY2026 Segmental Output & Revenue Mix
* Automotive Related Segment: Generated $3,928.0 million (80.3% of total sales), expanding 8.2% year-over-year from $3,629.1 million in FY25. Production output outpaced sales, scaling 14.9% to $4,217.5 million, indicating a strategic inventory buffering mandate.
* *Spark Plugs:* Generated $2,612.2 million.
* *Sensors:* Generated $1,315.8 million, growing 9.2% year-over-year.
* Component Solutions Segment: Reached $874.1 million (17.9% of total revenue), expanding 27.0% year-over-year. Production values scaled 25.1% to $840.5 million.
* Other / New Energy Ventures: Generated $92.0 million (1.8% of top-line revenue), expanding 74.2% year-over-year.
The balance sheet structure transition is marked by a deliberate levering up to fund inorganic acquisitions. The debt-to-equity ratio increased from 23.2% in FY25 to 31.6% in FY26 as total interest-bearing debt expanded from $1,047.6 million to $1,621.1 million, backed by $1.27 billion in consolidated corporate bonds. Total assets expanded 23.2% year-over-year to $8,164.2 million against an equity base of $5,130.9 million, settling the equity multiplier at 1.59x (ranging historically between 1.47x and 1.60x). The asset turnover ratio, after accelerating to 0.66x in FY25, reverted to 0.60x due to the denominator effect of M&A injections.
Working capital metrics point to supply chain fortification. The cash conversion cycle elongated from 199 days to 206 days. Days Sales Outstanding (DSO) extended from 82.5 to 85.9 days, while Days Inventory Outstanding (DIO) scaled from 170.0 to 176.5 days, reflecting a direct $290.4 million inventory expansion. Days Payable Outstanding (DPO) provided partial offset, increasing from 53.3 to 56.5 days. Current assets of $4,400.9 million effectively cover current liabilities of $1,698.8 million. Operating Cash Flow (OCF) contracted to $731.3 million in FY26, compressing the OCF-to-Net Income conversion ratio to 0.97x, down from 1.43x in FY24 and FY25.
Infrastructure Layout and Regional Moats
Niterra Co. relies on a highly integrated spatial distribution, placing intellectual property incubation and ceramic baking nodes centrally in Japan while decentralizing distribution nodes globally.
Regional Operating Footprint:
* Japan: The primary upstream hub, generating $778.7 million (15.9% of global sales). This region holds over $568.0 million in primary industrial Property, Plant, and Equipment (PPE), hosting wholly-owned subsidiaries WKS, NTK Ceramics, and the newly acquired Niterra Materials.
* Americas: Anchors over $95.0 million in localized PPE. Niterra North America, Inc. stands as the dominant regional cash entity, generating $967.47 million in standalone sales and $30.92 million in net profit, backed by a $761.08 million equity base. Sub-entities include CAIRE Inc., Wells Vehicle Electronics, and MGC Diagnostics Holdings, Inc.
* EMEA: Driven by stringent EURO7 emission standards, Niterra EMEA GmbH recorded $978.20 million in sales and $22.02 million in net profit.
* Asia-Pacific: Operations across Taiwan, China, alongside ASEAN hubs in Thailand, Malaysia, Vietnam, and Indonesia, function as the primary regional assembly channels adjacent to global semiconductor supply lines.
The capital expenditure footprint confirms a massive rotation. Routine PPE CapEx remains confined to $200.0 million to $245.0 million. However, net cash outflows from investing activities expanded from $229.0 million in FY25 to $1,106.7 million in FY26. This was driven primarily by the $986.07 million cash expenditure to acquire Niterra Materials, vertically integrating advanced substrates (such as LLZO for solid-state batteries, SOFC, and SOEC applications). This transaction forced total recognized goodwill to escalate from $90.8 million to $655.97 million, with Niterra Materials alone carrying a $588.33 million goodwill premium. Identifiable intangible assets expanded to $355.86 million. Not all M&A yielded instant results; strict IFRS impairment scrutiny was triggered for MGC Diagnostics Holdings, Inc. and Whocanfixmycar.com Ltd.
Under IFRS 16, Niterra Co. maintains a highly conservative off-balance sheet posture, recording $78.54 million in Right-of-Use assets against $133.46 million in total lease liabilities. The Japanese statutory tax rate of 30.6% was optimally compressed to an effective tax rate of 29.6%. This 100-basis-point operational tax shield was executed via R&D tax credits (-2.1%, up from -0.7% in FY25), equity method earnings (-1.7%), non-taxable dividends (-1.3%), and foreign rate differentials (-0.5%). Government subsidy income scaled 114.4% year-over-year, from $13.91 million to $29.84 million, though this represents merely 2.7% of the total $1,106.41 million operating profit. Deferred Tax Assets (DTAs) included $78.38 million for retirement liabilities and $47.92 million for inventory adjustments. Management registered deep pessimism regarding peripheral ventures, reporting $273.39 million in unrecognized DTAs (down from $294.25 million), of which $204.96 million expire beyond five years or lack an expiration date.
HDIN Institutional Verdict and Capital Returns
The executive management team at Niterra Co. successfully front-ran its own "2030 Long-Term Management Plan" capital efficiency goals, delivering a 15.7% Return on Equity (ROE) and a 12.7% Return on Invested Capital (ROIC) in FY26, beating the stated 12% ROIC target four years early. The board targets a 16% ROE by FY30.
Pricing inelasticity dictates the firm's forward cash projections. Management modeled extracting $5,549.3 million in operating cash inflows from legacy automotive units while driving an EBITDA target of $1,905.5 million by FY30, scaled from $1,170.0 million in FY25. The firm explicitly mandates driving a sales ratio of >50% for high-margin precious metal spark plugs and >50% for universal wide-band air-fuel sensors by FY29. Of the planned $6,685.9 million in mid-term capital deployment, ICE legacy operations are strictly capped at $2,273.2 million. The non-ICE transition forces $2,139.5 million into Component Solutions (targeting revenue to scale from $762.2 million to $2,005.8 million) and $334.3 million directly into new business R&D. Total consolidated R&D expenditures expanded from $229.9 million in FY25 to $234.8 million in FY26.
Shareholder returns operate on an aggressive mandate. Dividends per share expanded relentlessly from 102 JPY ($0.68) in FY22 to 205 JPY ($1.37) in FY26, keeping the payout ratio stable between 41.6% and 42.7%. The board earmarked $1,604.6 million for direct shareholder returns, executing a 7.2 million share repurchase authorization ($200.5 million maximum), successfully liquidating a $100.2 million tranche at a 50% execution rate. Concurrently, management modeled $1,136.6 million in cash generation via asset compression, actively liquidating 48 specific cross-shareholding issues valued at $86.86 million.
Corporate governance frameworks rely on structurally aligned compensation. Executive remuneration scaled marginally from $4.57 million to $4.69 million, tethered to TOPIX index relative returns and non-financial metrics, including maintaining an employee engagement score of 3.56+. The board mandates a majority outside director ratio (>50%) and >30% female/foreign board composition by FY29.
Environmental risk mapping enforces an aggressive Internal Carbon Pricing (ICP) mechanism set at $66.86 per ton (10,000 JPY/t-CO2). The firm quantified a $46.80 million financial exposure to incoming carbon taxes by FY29. Consequently, Niterra Co. targets a 46.0% Scope 1 and 2 emissions reduction by 2030 (71.4% by 2035) and a 30.0% Scope 3 reduction by 2030, baselined against 2018. Additionally, global revenue forecasts assume a rigid foreign exchange appreciation, modeling the JPY/USD rate moving from 153 to 135 by FY30, enforcing local production alignments to hedge against repatriation compression.
Presentation Download & Video Access:
- Presentation Download: Click the PDF download link under 'Related Topics' to access the full institutional presentation of this report.
- Video Link: Click this link to watch the HDIN analyst briefing on YouTube.
About HDIN Research:
HDIN Research is a premier global market intelligence and strategic advisory firm specializing in institutional-grade financial analysis, supply chain audits, and macroeconomic forecasting. Our dedicated sector analysts deliver actionable, data-driven insights tailored for private equity, hedge funds, and corporate strategy teams. Visit us at http://www.hdinresearch.com.
2026 AI Transparency Footer:
"This intelligence report was authored by HDIN Research analysts following a rigorous audit of official corporate filings. AI was utilized for massive-scale data synthesis and structural drafting, ensuring 100% inclusion of reported data points. All strategic insights, financial modeling, and final verdicts were verified by our editorial board to ensure professional accuracy and compliance with 2026 Google Search E-E-A-T standards."