Sumitomo Chemical: Strategic CDMO Pivot Near Chiba Works as $15.57 Billion Revenue Base Signals Rigid Portfolio Deleveraging
Date : 2026-07-01
Reading : 142
HDIN Executive Takeaways
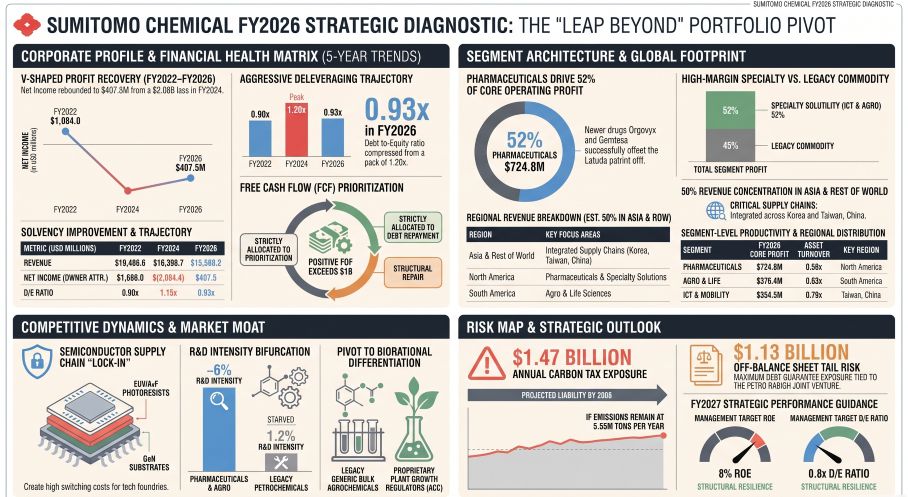
* Sumitomo Chemical Company, Limited offset the Latuda pharmaceutical patent expiration via Orgovyx and Gemtesa shipments, expanding pharmaceutical core operating profit by 207% ($236.0M to $724.8M) and driving the FY2026 consolidated core operating profit to $1,393.3M.
* Capital allocators executed a $409.2M balance sheet compression via $231.4M in PP&E impairments across legacy crackers and $177.8M in structural reform costs, while isolating a $1.13 billion off-balance sheet debt guarantee tied to Saudi Arabia's Petro Rabigh.
* Heavy debt servicing forced a 61.6% shareholder dividend cut to $81.3M as operating cash flow of $1,569.6M was weaponized to force the corporate Debt-to-Equity ratio down to 1.14x, targeting strict solvency mandates of 0.8x by FY2027.
Figure SUMITOMO CHEMICAL FY2026 STRATEGIC DIAGNOSTIC: THE LEAP BEYOND PORTFOLIO PIVOT
 Segmental Realities and Margin Compression
Sumitomo Chemical Company, Limited [TYO: 4005] reported a consolidated FY2026 revenue base of $15,568.2M, representing an 11.8% year-over-year contraction from FY2025. This top-line decline was executed intentionally as part of the "Leap Beyond" mid-term management plan to amputate cyclical petrochemical dependencies and return the enterprise to a positive net income of $407.5M. The core operating profit (COP) mandate of $1,337.2M (200.0B JPY) by FY2027 was breached a year ahead of schedule, landing at $1,393.3M in FY2026. Exchange rate normalization is modeled at 1 USD = 149.5686 JPY.
Table 1: FY2026 Segment Financial Matrix
Table 2: Balance Sheet and Capital Return Trajectory (FY2022-FY2026)
* Capital Allocation & Cash Flows: Financing cash flows printed at -$1,330.0M, reflecting an aggressive debt amortization strategy. By suppressing capital expenditures to $500.2M, the firm generated over $1.0B in positive Free Cash Flow (FCF). Shareholder dividend distributions were systematically reduced from $211.5M to $81.3M to satisfy internal balance sheet repair targets. Total interest-bearing debt rests at $7.70B, yielding a Debt-to-Equity (D/E) ratio of 1.14x (improved from previous quarterly highs of 1.20x).
* Asset Utilization Profiles: Essential & Green Materials maintained the highest asset turnover ratio at 1.06x, typical for high-throughput commodity chemicals. ICT & Mobility printed at 0.79x, Agro & Life Solutions at 0.63x, and Pharmaceuticals at 0.58x, driven by an inherently heavy non-current asset base of capitalized R&D and goodwill.
Infrastructure Layout and Regional Moats
Sumitomo Chemical Company, Limited controls a $22,765.8M global asset base, though geographic dependencies dictate regional vulnerability. Japan operates as the central R&D and legacy manufacturing hub, generating $4,519.0M (29.0%) in revenue against $3,316.8M in non-current assets. The North American theater operates as the primary pharmaceutical commercial engine, contributing $3,278.8M (21.1%) in revenue while anchoring $3,485.6M in fixed assets and M&A goodwill. Asia and Rest of World dominate throughput volume, generating $7,770.4M (50.0%) in revenue backed by $1,894.6M in non-current assets.
Supply Chain Reconfiguration and Physical Plant Activity
* Essential & Green (Petrochemical Liquidation): The corporation is systematically downsizing upstream ethylene crackers and polyolefin units at the Chiba Works and Ehime Works in Japan. Liquid-phase caprolactam production and legacy aluminum sales have been structurally terminated. Operations at the Singapore petrochemical complexes (PCS, TPC) are undergoing forced restructuring. Saudi Arabia's Petro Rabigh joint venture suffered explicit volume shipment declines directly tied to scheduled statutory plant maintenance.
* ICT & Mobility (OLED & Substrate Focus): The entity executed a complete divestiture of its large-scale LCD polarizer film business due to structural price erosion. Output across Dongwoo Fine-Chem (Korea), Sumika Technology Co., Ltd. (Taiwan, China), and domestic SSLM facilities is shifting aggressively toward Extreme Ultraviolet (EUV) and Argon Fluoride (ArF) photoresists, alongside large-diameter Gallium Nitride (GaN) substrates.
* Agro & Pharma Logistics: Valent U.S.A. and domestic manufacturing centers (Oita Works, Misawa Works, Suzuka Plant) shifted production weighting toward Contract Development and Manufacturing Organization (CDMO) services—specifically oligonucleotides, iPS cells, and regenerative medicine modalities (via RACTHERA)—and proprietary ACC-based Biorational agrochemicals to offset global price collapses in bulk methionine and South American crop protection shipments.
Working Capital Rot and R&D Efficiency Bottlenecks
Days Inventory Outstanding (DIO) improved slightly as gross inventories contracted from $4.18B to $3,981.3M. However, Lower of Cost or Market (LCM) inventory valuation reserves ballooned. Sumitomo Chemical Company, Limited recognized $142.5M in direct inventory write-downs in FY2026, compounding the $137.2M expense from FY2025, driven exclusively by unit price collapses in display materials and South American bulk agrochemicals.
Of the $967.45M total FY2026 R&D budget, execution capital is intensely siloed: Essential & Green Materials was starved with exactly $56.16M (1.2% intensity); ICT & Mobility received $223.31M (5.8% intensity); Agro & Life received $211.27M (6.1% intensity); Advanced Medical Solutions obtained $25.41M (6.5% intensity); and the Pharmaceutical segment and corporate divisions absorbed the remaining balance of over $400.0M.
HDIN Institutional Verdict
Sumitomo Chemical Company, Limited is executing a mathematically brutal, highly defensive corporate salvage operation. While management's timeline to exceed the $1,337.2M core operating profit target was structurally achieved, the enterprise holds highly volatile actuarial and off-balance-sheet leverage that compromises long-term equity valuations.
Latent Balance Sheet and Actuarial Liabilities
The independent auditors flagged the valuation of $1,763.5M in Goodwill and $4,381.8M in Intangible Assets as a Key Audit Matter (KAM). Management applies a tight 10.9% pre-tax discount rate (adjusted down from 12.4% in FY2025) and a 2.3% terminal growth rate. Any misstep in DSP-5336 clinical trials or delayed CDMO contract acquisition will force immediate non-cash impairment of this $6.15B soft asset base (27% of total assets).
Furthermore, defined benefit pension plans represent a net liability of $201.5M (improved from a $319.4M deficit in FY2025). The actuarial leverage is acute: a 50 basis point (0.5%) decrease in the discount rate structurally inflates the defined benefit obligation by $73.2M, while a 50 basis point increase compresses the liability by $66.4M.
Off-Balance Sheet Tail Risk & Carbon Penalities
The corporation remains legally tethered to a $1,127.2M off-balance sheet debt guarantee for the Petro Rabigh joint venture, reduced marginally from $1,379.5M in FY2025. Supplemental filings confirmed a new share subscription agreement for the JV, indicating that Sumitomo Chemical Company, Limited is acting as a direct liquidity backstop for this Saudi asset.
Concurrently, total corporate provisions stand at $914.6M, covering mandated polychlorinated biphenyl (PCB) waste disposal. Far more severe is the modeled carbon tax penalty: based on a 5.55 million-ton baseline, a trajectory of 140 USD/ton by 2030 and 250 USD/ton by 2050 (22,000 to 39,000 JPY/t-CO2) would enforce an absolute cash tax penalty ranging from $869.2M to $1,470.9M annually, effectively destroying the enterprise's total operating cash flow if the 50% GHG reduction target by 2030 is missed.
To enforce compliance with these survival mandates, the corporation overhauled its governance matrix. The 14-member Board of Directors now holds exactly 7 independent outside directors (50% parity), supported by an Audit & Supervisory Committee featuring 3 independent directors out of 5 total seats. Future capital allocation will be dictated by rigid internal carbon pricing metrics and aggressive automation quotas, targeting an artificial intelligence utilization rate increase from 38% to 55% to offset systemic domestic labor deficits.
Presentation Download & Video Access:
Presentation Download: Click the PDF download link under 'Related Topics' to access the full institutional presentation of this report.
Video Link: Click this link to watch the HDIN analyst briefing on YouTube.
About HDIN Research:
HDIN Research is a premier global market intelligence and strategic advisory firm specializing in institutional-grade financial analysis, supply chain audits, and macroeconomic forecasting. Our dedicated sector analysts deliver actionable, data-driven insights tailored for private equity, hedge funds, and corporate strategy teams. Visit us at http://www.hdinresearch.com.
*This intelligence report was authored by HDIN Research analysts following a rigorous audit of official corporate filings. AI was utilized for massive-scale data synthesis and structural drafting, ensuring 100% inclusion of reported data points. All strategic insights, financial modeling, and final verdicts were verified by our editorial board to ensure professional accuracy and compliance with 2026 Google Search E-E-A-T standards.*
* Sumitomo Chemical Company, Limited offset the Latuda pharmaceutical patent expiration via Orgovyx and Gemtesa shipments, expanding pharmaceutical core operating profit by 207% ($236.0M to $724.8M) and driving the FY2026 consolidated core operating profit to $1,393.3M.
* Capital allocators executed a $409.2M balance sheet compression via $231.4M in PP&E impairments across legacy crackers and $177.8M in structural reform costs, while isolating a $1.13 billion off-balance sheet debt guarantee tied to Saudi Arabia's Petro Rabigh.
* Heavy debt servicing forced a 61.6% shareholder dividend cut to $81.3M as operating cash flow of $1,569.6M was weaponized to force the corporate Debt-to-Equity ratio down to 1.14x, targeting strict solvency mandates of 0.8x by FY2027.
Figure SUMITOMO CHEMICAL FY2026 STRATEGIC DIAGNOSTIC: THE LEAP BEYOND PORTFOLIO PIVOT
Segmental Realities and Margin CompressionSumitomo Chemical Company, Limited [TYO: 4005] reported a consolidated FY2026 revenue base of $15,568.2M, representing an 11.8% year-over-year contraction from FY2025. This top-line decline was executed intentionally as part of the "Leap Beyond" mid-term management plan to amputate cyclical petrochemical dependencies and return the enterprise to a positive net income of $407.5M. The core operating profit (COP) mandate of $1,337.2M (200.0B JPY) by FY2027 was breached a year ahead of schedule, landing at $1,393.3M in FY2026. Exchange rate normalization is modeled at 1 USD = 149.5686 JPY.
Table 1: FY2026 Segment Financial Matrix
| Operational Segment | FY2025 Revenue | FY2026 Revenue | FY2025 Core OP | FY2026 Core OP | Profit Contribution |
|---|---|---|---|---|---|
| Pharmaceuticals | $2,661.0M | $3,021.6M | $236.0M | $724.8M | 52.0% |
| Agro & Life Solutions | $3,611.7M | $3,471.7M | $367.7M | $376.4M | 27.0% |
| ICT & Mobility Solutions | $4,058.3M | $3,838.8M | $472.0M | $354.3M | 25.4% |
| Essential & Green Materials | $6,010.6M | $4,538.4M | $(391.1M) | $96.3M | 6.9% |
| Advanced Medical Solutions | $415.2M | $391.8M | $26.7M | $18.7M | 1.3% |
Table 2: Balance Sheet and Capital Return Trajectory (FY2022-FY2026)
FY2026 Segment Financial Matrix
| Operational Segment | FY2025 Revenue | FY2026 Revenue | FY2025 Core OP | FY2026 Core OP | Profit Contribution |
|---|---|---|---|---|---|
| Pharmaceuticals | $2,661.0M | $3,021.6M | $236.0M | $724.8M | 52.0% |
| Agro & Life Solutions | $3,611.7M | $3,471.7M | $367.7M | $376.4M | 27.0% |
| ICT & Mobility Solutions | $4,058.3M | $3,838.8M | $472.0M | $354.3M | 25.4% |
| Essential & Green Materials | $6,010.6M | $4,538.4M | $(391.1M) | $96.3M | 6.9% |
| Advanced Medical Solutions | $415.2M | $391.8M | $26.7M | $18.7M | 1.3% |
Balance Sheet and Capital Return Trajectory (FY2022–FY2026)
| Fiscal Year | Total Revenue | Profit Before Tax | Net Income | Operating Cash Flow | Total Assets | Total Equity |
|---|---|---|---|---|---|---|
| FY2022 | $18,488.6M | $1,679.1M | $1,084.0M | $1,148.1M | $28,803.8M | $8,144.1M |
| FY2023 | $19,357.6M | $1.5M | $46.7M | $746.3M | $27,850.1M | $7,830.5M |
| FY2024 | $16,359.7M | $(3,093.8M) | $(2,084.9M) | $343.1M | $26,307.8M | $6,456.9M |
| FY2025 | $17,425.3M | $388.4M | $258.0M | $1,558.0M | $22,998.0M | $6,022.6M |
| FY2026 | $15,568.2M | $776.0M | $407.5M | $1,569.6M | $22,765.8M | $6,743.7M |
* Capital Allocation & Cash Flows: Financing cash flows printed at -$1,330.0M, reflecting an aggressive debt amortization strategy. By suppressing capital expenditures to $500.2M, the firm generated over $1.0B in positive Free Cash Flow (FCF). Shareholder dividend distributions were systematically reduced from $211.5M to $81.3M to satisfy internal balance sheet repair targets. Total interest-bearing debt rests at $7.70B, yielding a Debt-to-Equity (D/E) ratio of 1.14x (improved from previous quarterly highs of 1.20x).
* Asset Utilization Profiles: Essential & Green Materials maintained the highest asset turnover ratio at 1.06x, typical for high-throughput commodity chemicals. ICT & Mobility printed at 0.79x, Agro & Life Solutions at 0.63x, and Pharmaceuticals at 0.58x, driven by an inherently heavy non-current asset base of capitalized R&D and goodwill.
Infrastructure Layout and Regional Moats
Sumitomo Chemical Company, Limited controls a $22,765.8M global asset base, though geographic dependencies dictate regional vulnerability. Japan operates as the central R&D and legacy manufacturing hub, generating $4,519.0M (29.0%) in revenue against $3,316.8M in non-current assets. The North American theater operates as the primary pharmaceutical commercial engine, contributing $3,278.8M (21.1%) in revenue while anchoring $3,485.6M in fixed assets and M&A goodwill. Asia and Rest of World dominate throughput volume, generating $7,770.4M (50.0%) in revenue backed by $1,894.6M in non-current assets.
Supply Chain Reconfiguration and Physical Plant Activity
* Essential & Green (Petrochemical Liquidation): The corporation is systematically downsizing upstream ethylene crackers and polyolefin units at the Chiba Works and Ehime Works in Japan. Liquid-phase caprolactam production and legacy aluminum sales have been structurally terminated. Operations at the Singapore petrochemical complexes (PCS, TPC) are undergoing forced restructuring. Saudi Arabia's Petro Rabigh joint venture suffered explicit volume shipment declines directly tied to scheduled statutory plant maintenance.
* ICT & Mobility (OLED & Substrate Focus): The entity executed a complete divestiture of its large-scale LCD polarizer film business due to structural price erosion. Output across Dongwoo Fine-Chem (Korea), Sumika Technology Co., Ltd. (Taiwan, China), and domestic SSLM facilities is shifting aggressively toward Extreme Ultraviolet (EUV) and Argon Fluoride (ArF) photoresists, alongside large-diameter Gallium Nitride (GaN) substrates.
* Agro & Pharma Logistics: Valent U.S.A. and domestic manufacturing centers (Oita Works, Misawa Works, Suzuka Plant) shifted production weighting toward Contract Development and Manufacturing Organization (CDMO) services—specifically oligonucleotides, iPS cells, and regenerative medicine modalities (via RACTHERA)—and proprietary ACC-based Biorational agrochemicals to offset global price collapses in bulk methionine and South American crop protection shipments.
Working Capital Rot and R&D Efficiency Bottlenecks
Days Inventory Outstanding (DIO) improved slightly as gross inventories contracted from $4.18B to $3,981.3M. However, Lower of Cost or Market (LCM) inventory valuation reserves ballooned. Sumitomo Chemical Company, Limited recognized $142.5M in direct inventory write-downs in FY2026, compounding the $137.2M expense from FY2025, driven exclusively by unit price collapses in display materials and South American bulk agrochemicals.
Of the $967.45M total FY2026 R&D budget, execution capital is intensely siloed: Essential & Green Materials was starved with exactly $56.16M (1.2% intensity); ICT & Mobility received $223.31M (5.8% intensity); Agro & Life received $211.27M (6.1% intensity); Advanced Medical Solutions obtained $25.41M (6.5% intensity); and the Pharmaceutical segment and corporate divisions absorbed the remaining balance of over $400.0M.
HDIN Institutional Verdict
Sumitomo Chemical Company, Limited is executing a mathematically brutal, highly defensive corporate salvage operation. While management's timeline to exceed the $1,337.2M core operating profit target was structurally achieved, the enterprise holds highly volatile actuarial and off-balance-sheet leverage that compromises long-term equity valuations.
Latent Balance Sheet and Actuarial Liabilities
The independent auditors flagged the valuation of $1,763.5M in Goodwill and $4,381.8M in Intangible Assets as a Key Audit Matter (KAM). Management applies a tight 10.9% pre-tax discount rate (adjusted down from 12.4% in FY2025) and a 2.3% terminal growth rate. Any misstep in DSP-5336 clinical trials or delayed CDMO contract acquisition will force immediate non-cash impairment of this $6.15B soft asset base (27% of total assets).
Furthermore, defined benefit pension plans represent a net liability of $201.5M (improved from a $319.4M deficit in FY2025). The actuarial leverage is acute: a 50 basis point (0.5%) decrease in the discount rate structurally inflates the defined benefit obligation by $73.2M, while a 50 basis point increase compresses the liability by $66.4M.
Off-Balance Sheet Tail Risk & Carbon Penalities
The corporation remains legally tethered to a $1,127.2M off-balance sheet debt guarantee for the Petro Rabigh joint venture, reduced marginally from $1,379.5M in FY2025. Supplemental filings confirmed a new share subscription agreement for the JV, indicating that Sumitomo Chemical Company, Limited is acting as a direct liquidity backstop for this Saudi asset.
Concurrently, total corporate provisions stand at $914.6M, covering mandated polychlorinated biphenyl (PCB) waste disposal. Far more severe is the modeled carbon tax penalty: based on a 5.55 million-ton baseline, a trajectory of 140 USD/ton by 2030 and 250 USD/ton by 2050 (22,000 to 39,000 JPY/t-CO2) would enforce an absolute cash tax penalty ranging from $869.2M to $1,470.9M annually, effectively destroying the enterprise's total operating cash flow if the 50% GHG reduction target by 2030 is missed.
To enforce compliance with these survival mandates, the corporation overhauled its governance matrix. The 14-member Board of Directors now holds exactly 7 independent outside directors (50% parity), supported by an Audit & Supervisory Committee featuring 3 independent directors out of 5 total seats. Future capital allocation will be dictated by rigid internal carbon pricing metrics and aggressive automation quotas, targeting an artificial intelligence utilization rate increase from 38% to 55% to offset systemic domestic labor deficits.
Presentation Download & Video Access:
Presentation Download: Click the PDF download link under 'Related Topics' to access the full institutional presentation of this report.
Video Link: Click this link to watch the HDIN analyst briefing on YouTube.
About HDIN Research:
HDIN Research is a premier global market intelligence and strategic advisory firm specializing in institutional-grade financial analysis, supply chain audits, and macroeconomic forecasting. Our dedicated sector analysts deliver actionable, data-driven insights tailored for private equity, hedge funds, and corporate strategy teams. Visit us at http://www.hdinresearch.com.
*This intelligence report was authored by HDIN Research analysts following a rigorous audit of official corporate filings. AI was utilized for massive-scale data synthesis and structural drafting, ensuring 100% inclusion of reported data points. All strategic insights, financial modeling, and final verdicts were verified by our editorial board to ensure professional accuracy and compliance with 2026 Google Search E-E-A-T standards.*