DroneShield Limited: Decentralized Manufacturing Pivot Near Sydney, US, and Europe as 276% Revenue Growth Signals Sovereign Defense Dominance
Date : 2026-06-30
Reading : 449
HDIN Executive Takeaways
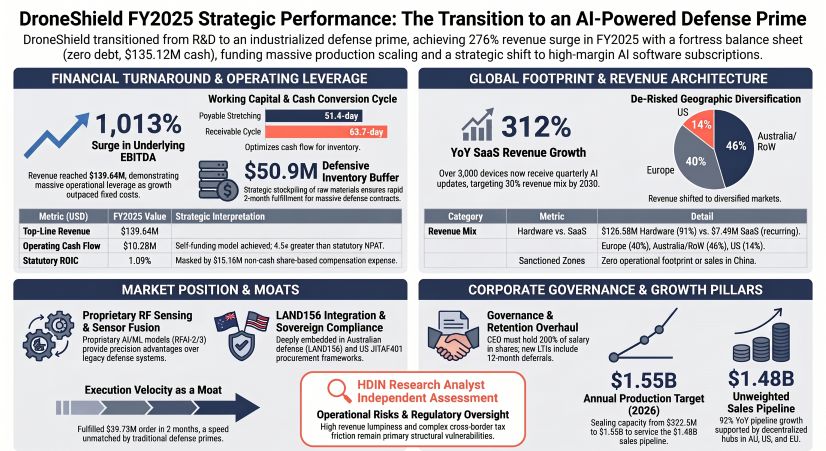
* FY2025 revenue reached $139.64 million USD ($216.5 million AUD), generating $23.55 million USD in Underlying EBITDA (1,013% year-over-year growth) with an Operating Cash Flow-to-NPAT conversion ratio of 4.5x.
* Capitalizing on US and European sovereign mandates, management expanded localized assembly hubs, pushing run-rate capacity to $322.5 million USD and buffering $50.92 million USD in strategic inventory to execute rapid two-month delivery cycles.
* The corporate transition from an early-stage hardware entity to a high-margin recurring SaaS platform (targeting a 30% revenue share) provides institutional-grade operational leverage without requiring external dilutive financing.
Figure DroneShield FY2025 Strategic Performance: The Transition to an Al-Powered Defense Prime
 Segmental Realities and Margin Compression
DroneShield Limited [ASX: DRO] executed a structural shift in its earnings profile in FY2025, operating within a validated $63 billion USD Total Addressable Market (TAM). Consolidated top-line revenue reached $139.64 million USD ($216.5 million AUD), representing a 276% year-over-year (YoY) increase from $37.09 million USD in FY2024. This growth drastically outpaced fixed operating costs, specifically the $38.54 million USD ($59.76 million AUD) allocated to employee benefits, engineering a turnaround in statutory Net Profit After Tax (NPAT) to $2.27 million USD ($3.5 million AUD)—a 367% improvement from the $0.85 million USD loss recorded in FY2024.
The quality of these earnings is highlighted by the Operating Cash Flow (OCF), which reversed from a $40.12 million USD outflow in FY2024 to a $10.28 million USD inflow. Cash receipts totaled $130.01 million USD ($201.6 million AUD), up 256% YoY, validating efficient credit risk execution aligned with standard 30-day payment terms for Tier-1 defense clients.
* Segmental Revenue Architecture (Converted at 1 AUD = 0.645 USD):
* Hardware & Shipping: $126.58 million USD ($196.25 million AUD). Mix: RfPatrol (43%), DroneSentry (38%), and DroneGun (19%), driven by the Mk4 transition.
* Software-as-a-Service (SaaS): $7.49 million USD ($11.6 million AUD), representing a 312% YoY increase from $1.82 million USD.
* Ancillary Services & Warranty: $5.60 million USD total, comprising $4.04 million USD ($6.27 million AUD) in Electronic Warfare R&D and $1.56 million USD ($2.42 million AUD) in warranties.
* Indirect vs. Direct Channels: Distributors generated $115.75 million USD ($179.46 million AUD) across 70+ countries (83% of total revenue), while direct sales accounted for $23.92 million USD ($37.09 million AUD).
* Margin Profiling & Cost Drivers:
* Core Inventory COGS & Impairment: Inventory expenses reached $54.63 million USD ($84.7 million AUD) (also recorded as $54.64 million USD COGS), which included a $6.65 million USD ($10.3 million AUD) non-cash impairment specifically targeting legacy DroneGun assets.
* EBITDA Bridge: Statutory EBITDA stood at $2.90 million USD ($4.5 million AUD). Stripping out the legacy write-down and a $15.16 million USD ($23.5 million AUD) non-cash share-based payment expense yields an Underlying EBITDA of $23.55 million USD ($36.5 million AUD).
* R&D Capitalization & Amortization: The firm capitalized $10.32 million USD ($16.00 million AUD) in intangible assets, with Work In Progress (WIP) at $10.31 million USD ($15.99 million AUD). Amortization of previously capitalized development hit $1.47 million USD ($2.27 million AUD), while total D&A stood at $6.82 million USD ($10.58 million AUD). The firm offset R&D burn via a $7.55 million USD ($11.7 million AUD) ADF Electronic Warfare contract, receiving $3.74 million USD ($5.8 million AUD) in FY2025.
* Asset Efficiency Metrics:
* Working Capital Cycle: Receivable Days measured 63.7 against an average trade receivable base of $24.39 million USD ($37.81 million AUD). Payable Days stretched to 51.4 against average payables of $7.69 million USD ($11.92 million AUD).
* Return on Invested Capital (ROIC): Statutory ROIC sat at 1.09%, artificially depressed by the $15.16 million USD equity payout. Underlying Pre-Tax ROIC mathematically adjusts to 10.26%. Asset Turnover Ratio registered 0.56x against an average total asset base of $247.70 million USD ($384.03 million AUD).
Supply Chain Architecture and Geographic Footprint
DroneShield Limited has fundamentally shifted from a centralized production model to a multi-hub global manufacturing architecture. This strategic decentralization neutralizes supply chain vulnerabilities and ensures compliance with sovereign defense procurement mandates, including the US JITAF401 framework, the US Safer Skies Act, and Australia's Defence Amendment Regulations 2025.
To execute against an unweighted sales pipeline of $1.48 billion USD ($2.3 billion AUD)—comprising 300 discrete project opportunities—management scaled manufacturing capacity from an FY2025 run-rate of $322.5 million USD ($500 million AUD) toward an FY2026 target of $1.55 billion USD ($2.4 billion AUD) per annum. The operational efficacy of this footprint was validated when DroneShield Limited delivered its largest order to date, valued at $39.73 million USD ($61.6 million AUD), within a two-month timeframe. The firm enters FY2026 with a secured revenue backlog of $66.76 million USD ($103.5 million AUD), of which $14.32 million USD ($22.2 million AUD) is SaaS-derived.
* Geographic Revenue Distribution:
* Europe: Accelerated to 40% of total revenue.
* United States: Dropped to 14% relative concentration, recording segment revenues of $19.17 million USD ($29.73 million AUD).
* Australia & Rest of World: Generated $125.77 million USD ($194.99 million AUD) (excluding China due to geopolitical parameters).
* Subsidiary Matrix and Capital Expenditure:
* Physical Hubs: Production was localized via DroneShield Group Pty Ltd (Sydney relocation), DroneShield LLC and DroneShield Defense Services LLC (United States), alongside newly established European entities DroneShield B.V. (Netherlands) and DroneShield Belgium B.V.
* Capital Outlays: FY2025 CapEx included $3.68 million USD ($5.7 million AUD) in right-of-use assets and $3.48 million USD ($5.4 million AUD) in PP&E additions. Off-balance sheet lease commitments for these facilities equal an undiscounted $10.95 million USD ($16.97 million AUD), partially offset by $0.37 million USD ($0.575 million AUD) in fit-out incentives.
* Inventory Buffering Strategy: Total inventory stockpiled to $50.92 million USD ($78.9 million AUD). This comprises $34.39 million USD ($53.31 million AUD) in raw materials and $16.53 million USD ($25.63 million AUD) in finished goods.
* Supply Commitments: Subsidiary-level binding contractual agreements demand $25.40 million USD ($39.38 million AUD) to be paid to suppliers for ongoing raw material accumulation.
HDIN Institutional Verdict
The institutional audit of DroneShield Limited uncovers a highly de-risked balance sheet characterized by zero debt, zero explicit contingent liabilities, and $135.12 million USD ($209.5 million AUD) in cash and term deposits (a 4% decrease from $141.57 million USD in FY2024). Total current assets equal $215.99 million USD ($334.88 million AUD).
Despite operational excellence in defense integration—such as inclusion in Australia's LAND156 LoE2 and LoE3 panels and targeting the $1.5 billion USD Department of Homeland Security allocation—corporate governance friction presented the primary FY2025 risk vector. The FY2025 Long-Term Incentive (LTI) framework utilized a $129 million USD ($200 million AUD) single-trigger hurdle. Rapid achievement of this metric forced full "cliff vesting," generating the $15.16 million USD non-cash expense and triggering executive sell-offs post-ASX 200 inclusion. CEO Oleg Vornik exercised 15,000,000 options and sold 14,806,833 shares (retaining 193,167 shares); Chairman Peter James exercised 3,000,000 and sold 3,685,345 shares; and NED Jethro Marks liquidated 1,460,000 shares. In the Short-Term Incentive (STI) scheme, the $139.64 million USD revenue vastly exceeded the $69 million USD target, resulting in 100% payouts for the CEO ($548,250 USD) and CFO ($145,125 USD).
The Board's remediation strategy instituted a binding Minimum Shareholding Policy (MSP) demanding the CEO hold 200% of their base salary in equity, with CFO/Executives at 50% and NEDs at 100%. FY2026 LTI structures now enforce deferred 12-month vesting conditions attached to graduated milestones of $193.5 million USD, $258 million USD, and $322.5 million USD.
Operationally, human capital doubled from 250 to 500 employees, containing over 350 hardware and software engineers. This workforce drives the SaaS ecosystem—currently pushing software iterations to over 3,000 active devices globally. Upcoming catalysts include the launch of RFAI-2 (April 2026), RFAI-3 (mid-2026), and RFAI-ATK (electronic defeat model, mid-2026) integrating SFAI and DroneOptID systems, alongside SentryCiv for commercial deployment.
Lastly, institutional investors must price in cross-border tax friction. FY2025 internal structuring cleared an intercompany debt, shifting the group's foreign currency reserve from a $1.46 million USD surplus to a $0.22 million USD deficit. However, the dual-tax residency status—where the Australian parent is treated as a US Corporation and the Delaware LLC alongside European entities are treated as Australian tax residents—will demand continuous legal capital output until formal treaty relief is finalized upon full European operationalization.
Presentation Download & Video Access:
- Presentation Download: Click the PDF download link under 'Related Topics' to access the full institutional presentation of this report.
- Video Link: Click this link to watch the HDIN analyst briefing on YouTube.
About HDIN Research:
HDIN Research is a premier global market intelligence and strategic advisory firm specializing in institutional-grade financial analysis, supply chain audits, and macroeconomic forecasting. Our dedicated sector analysts deliver actionable, data-driven insights tailored for private equity, hedge funds, and corporate strategy teams. Visit us at http://www.hdinresearch.com.
2026 AI Transparency Footer:
"This intelligence report was authored by HDIN Research analysts following a rigorous audit of official corporate filings. AI was utilized for massive-scale data synthesis and structural drafting, ensuring 100% inclusion of reported data points. All strategic insights, financial modeling, and final verdicts were verified by our editorial board to ensure professional accuracy and compliance with 2026 Google Search E-E-A-T standards."
* FY2025 revenue reached $139.64 million USD ($216.5 million AUD), generating $23.55 million USD in Underlying EBITDA (1,013% year-over-year growth) with an Operating Cash Flow-to-NPAT conversion ratio of 4.5x.
* Capitalizing on US and European sovereign mandates, management expanded localized assembly hubs, pushing run-rate capacity to $322.5 million USD and buffering $50.92 million USD in strategic inventory to execute rapid two-month delivery cycles.
* The corporate transition from an early-stage hardware entity to a high-margin recurring SaaS platform (targeting a 30% revenue share) provides institutional-grade operational leverage without requiring external dilutive financing.
Figure DroneShield FY2025 Strategic Performance: The Transition to an Al-Powered Defense Prime
Segmental Realities and Margin CompressionDroneShield Limited [ASX: DRO] executed a structural shift in its earnings profile in FY2025, operating within a validated $63 billion USD Total Addressable Market (TAM). Consolidated top-line revenue reached $139.64 million USD ($216.5 million AUD), representing a 276% year-over-year (YoY) increase from $37.09 million USD in FY2024. This growth drastically outpaced fixed operating costs, specifically the $38.54 million USD ($59.76 million AUD) allocated to employee benefits, engineering a turnaround in statutory Net Profit After Tax (NPAT) to $2.27 million USD ($3.5 million AUD)—a 367% improvement from the $0.85 million USD loss recorded in FY2024.
The quality of these earnings is highlighted by the Operating Cash Flow (OCF), which reversed from a $40.12 million USD outflow in FY2024 to a $10.28 million USD inflow. Cash receipts totaled $130.01 million USD ($201.6 million AUD), up 256% YoY, validating efficient credit risk execution aligned with standard 30-day payment terms for Tier-1 defense clients.
* Segmental Revenue Architecture (Converted at 1 AUD = 0.645 USD):
* Hardware & Shipping: $126.58 million USD ($196.25 million AUD). Mix: RfPatrol (43%), DroneSentry (38%), and DroneGun (19%), driven by the Mk4 transition.
* Software-as-a-Service (SaaS): $7.49 million USD ($11.6 million AUD), representing a 312% YoY increase from $1.82 million USD.
* Ancillary Services & Warranty: $5.60 million USD total, comprising $4.04 million USD ($6.27 million AUD) in Electronic Warfare R&D and $1.56 million USD ($2.42 million AUD) in warranties.
* Indirect vs. Direct Channels: Distributors generated $115.75 million USD ($179.46 million AUD) across 70+ countries (83% of total revenue), while direct sales accounted for $23.92 million USD ($37.09 million AUD).
* Margin Profiling & Cost Drivers:
* Core Inventory COGS & Impairment: Inventory expenses reached $54.63 million USD ($84.7 million AUD) (also recorded as $54.64 million USD COGS), which included a $6.65 million USD ($10.3 million AUD) non-cash impairment specifically targeting legacy DroneGun assets.
* EBITDA Bridge: Statutory EBITDA stood at $2.90 million USD ($4.5 million AUD). Stripping out the legacy write-down and a $15.16 million USD ($23.5 million AUD) non-cash share-based payment expense yields an Underlying EBITDA of $23.55 million USD ($36.5 million AUD).
* R&D Capitalization & Amortization: The firm capitalized $10.32 million USD ($16.00 million AUD) in intangible assets, with Work In Progress (WIP) at $10.31 million USD ($15.99 million AUD). Amortization of previously capitalized development hit $1.47 million USD ($2.27 million AUD), while total D&A stood at $6.82 million USD ($10.58 million AUD). The firm offset R&D burn via a $7.55 million USD ($11.7 million AUD) ADF Electronic Warfare contract, receiving $3.74 million USD ($5.8 million AUD) in FY2025.
* Asset Efficiency Metrics:
* Working Capital Cycle: Receivable Days measured 63.7 against an average trade receivable base of $24.39 million USD ($37.81 million AUD). Payable Days stretched to 51.4 against average payables of $7.69 million USD ($11.92 million AUD).
* Return on Invested Capital (ROIC): Statutory ROIC sat at 1.09%, artificially depressed by the $15.16 million USD equity payout. Underlying Pre-Tax ROIC mathematically adjusts to 10.26%. Asset Turnover Ratio registered 0.56x against an average total asset base of $247.70 million USD ($384.03 million AUD).
Supply Chain Architecture and Geographic Footprint
DroneShield Limited has fundamentally shifted from a centralized production model to a multi-hub global manufacturing architecture. This strategic decentralization neutralizes supply chain vulnerabilities and ensures compliance with sovereign defense procurement mandates, including the US JITAF401 framework, the US Safer Skies Act, and Australia's Defence Amendment Regulations 2025.
To execute against an unweighted sales pipeline of $1.48 billion USD ($2.3 billion AUD)—comprising 300 discrete project opportunities—management scaled manufacturing capacity from an FY2025 run-rate of $322.5 million USD ($500 million AUD) toward an FY2026 target of $1.55 billion USD ($2.4 billion AUD) per annum. The operational efficacy of this footprint was validated when DroneShield Limited delivered its largest order to date, valued at $39.73 million USD ($61.6 million AUD), within a two-month timeframe. The firm enters FY2026 with a secured revenue backlog of $66.76 million USD ($103.5 million AUD), of which $14.32 million USD ($22.2 million AUD) is SaaS-derived.
* Geographic Revenue Distribution:
* Europe: Accelerated to 40% of total revenue.
* United States: Dropped to 14% relative concentration, recording segment revenues of $19.17 million USD ($29.73 million AUD).
* Australia & Rest of World: Generated $125.77 million USD ($194.99 million AUD) (excluding China due to geopolitical parameters).
* Subsidiary Matrix and Capital Expenditure:
* Physical Hubs: Production was localized via DroneShield Group Pty Ltd (Sydney relocation), DroneShield LLC and DroneShield Defense Services LLC (United States), alongside newly established European entities DroneShield B.V. (Netherlands) and DroneShield Belgium B.V.
* Capital Outlays: FY2025 CapEx included $3.68 million USD ($5.7 million AUD) in right-of-use assets and $3.48 million USD ($5.4 million AUD) in PP&E additions. Off-balance sheet lease commitments for these facilities equal an undiscounted $10.95 million USD ($16.97 million AUD), partially offset by $0.37 million USD ($0.575 million AUD) in fit-out incentives.
* Inventory Buffering Strategy: Total inventory stockpiled to $50.92 million USD ($78.9 million AUD). This comprises $34.39 million USD ($53.31 million AUD) in raw materials and $16.53 million USD ($25.63 million AUD) in finished goods.
* Supply Commitments: Subsidiary-level binding contractual agreements demand $25.40 million USD ($39.38 million AUD) to be paid to suppliers for ongoing raw material accumulation.
HDIN Institutional Verdict
The institutional audit of DroneShield Limited uncovers a highly de-risked balance sheet characterized by zero debt, zero explicit contingent liabilities, and $135.12 million USD ($209.5 million AUD) in cash and term deposits (a 4% decrease from $141.57 million USD in FY2024). Total current assets equal $215.99 million USD ($334.88 million AUD).
Despite operational excellence in defense integration—such as inclusion in Australia's LAND156 LoE2 and LoE3 panels and targeting the $1.5 billion USD Department of Homeland Security allocation—corporate governance friction presented the primary FY2025 risk vector. The FY2025 Long-Term Incentive (LTI) framework utilized a $129 million USD ($200 million AUD) single-trigger hurdle. Rapid achievement of this metric forced full "cliff vesting," generating the $15.16 million USD non-cash expense and triggering executive sell-offs post-ASX 200 inclusion. CEO Oleg Vornik exercised 15,000,000 options and sold 14,806,833 shares (retaining 193,167 shares); Chairman Peter James exercised 3,000,000 and sold 3,685,345 shares; and NED Jethro Marks liquidated 1,460,000 shares. In the Short-Term Incentive (STI) scheme, the $139.64 million USD revenue vastly exceeded the $69 million USD target, resulting in 100% payouts for the CEO ($548,250 USD) and CFO ($145,125 USD).
The Board's remediation strategy instituted a binding Minimum Shareholding Policy (MSP) demanding the CEO hold 200% of their base salary in equity, with CFO/Executives at 50% and NEDs at 100%. FY2026 LTI structures now enforce deferred 12-month vesting conditions attached to graduated milestones of $193.5 million USD, $258 million USD, and $322.5 million USD.
Operationally, human capital doubled from 250 to 500 employees, containing over 350 hardware and software engineers. This workforce drives the SaaS ecosystem—currently pushing software iterations to over 3,000 active devices globally. Upcoming catalysts include the launch of RFAI-2 (April 2026), RFAI-3 (mid-2026), and RFAI-ATK (electronic defeat model, mid-2026) integrating SFAI and DroneOptID systems, alongside SentryCiv for commercial deployment.
Lastly, institutional investors must price in cross-border tax friction. FY2025 internal structuring cleared an intercompany debt, shifting the group's foreign currency reserve from a $1.46 million USD surplus to a $0.22 million USD deficit. However, the dual-tax residency status—where the Australian parent is treated as a US Corporation and the Delaware LLC alongside European entities are treated as Australian tax residents—will demand continuous legal capital output until formal treaty relief is finalized upon full European operationalization.
Presentation Download & Video Access:
- Presentation Download: Click the PDF download link under 'Related Topics' to access the full institutional presentation of this report.
- Video Link: Click this link to watch the HDIN analyst briefing on YouTube.
About HDIN Research:
HDIN Research is a premier global market intelligence and strategic advisory firm specializing in institutional-grade financial analysis, supply chain audits, and macroeconomic forecasting. Our dedicated sector analysts deliver actionable, data-driven insights tailored for private equity, hedge funds, and corporate strategy teams. Visit us at http://www.hdinresearch.com.
2026 AI Transparency Footer:
"This intelligence report was authored by HDIN Research analysts following a rigorous audit of official corporate filings. AI was utilized for massive-scale data synthesis and structural drafting, ensuring 100% inclusion of reported data points. All strategic insights, financial modeling, and final verdicts were verified by our editorial board to ensure professional accuracy and compliance with 2026 Google Search E-E-A-T standards."