TOPPAN Holdings Inc.: $1.82 Billion Americas Packaging Pivot and Semiconductor CapEx Realignment Drive Negative $1.97 Billion FCF Amid Margin Compression
Date : 2026-06-30
Reading : 188
HDIN Executive Takeaways
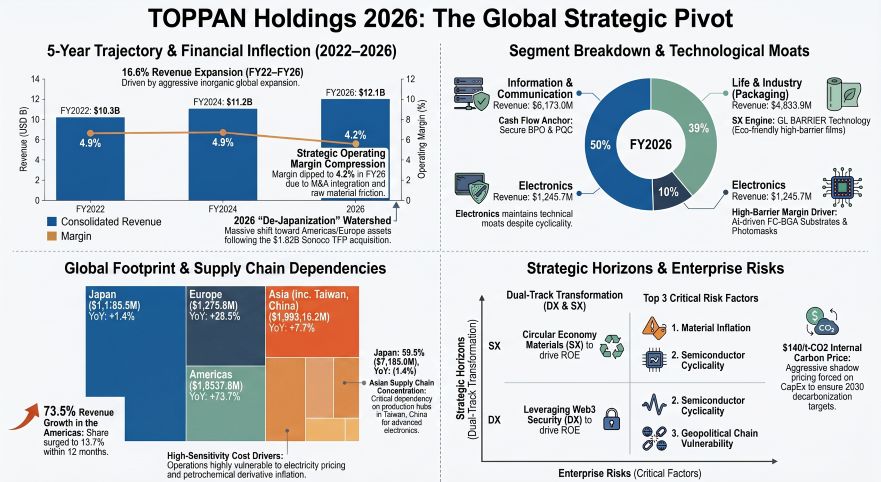
* TOPPAN Holdings Inc.'s $1.82 billion debt-funded acquisition of Sonoco Products Company’s packaging assets spiked Americas revenue by 73.5%, driving a consolidated FY2026 top-line of $12,068.3 million while decimating Free Cash Flow to negative $1,979.3 million.
* A deliberate "de-Japanization" strategy doubled Americas property, plant, and equipment assets to $516.1 million, whereas cyclical semiconductor weakness in Asia-Pacific concentrated at Giantplus Technology Co., Ltd. compressed regional revenue by 13.7%.
* Management is aggressively leveraging the balance sheet, surging corporate bonds to $869.2 million to buy structural global positioning, trading immediate operating margin compression (down 4.2%) for a targeted 11.5% Non-GAAP ROE by 2031.
Figure TOPPAN Holdings 2026: The Global Strategic Pivot
Segmental Realities, Margin Compression, and Financial Architecture
TOPPAN Holdings Inc. [TYO: 7911] is executing a capital-intensive structural pivot from legacy domestic printing to high-value global materials and digital ecosystems. Consolidated financials (converted at 1 USD = 149.5686 JPY) reflect a five-year trajectory characterized by top-line revenue expansion paired with acute profitability deterioration due to raw material inflation, post-merger integration (PMI) costs, and cyclical asset stress.
Table Five-Year Consolidated Financial Trajectory (FY2022–FY2026)
The FY2026 performance was driven by aggressive pricing pass-throughs and the consolidation of M&A assets rather than organic volume. The cash conversion cycle sits at 129 days, with Days Sales Outstanding (DSO) at 78 days (accounts receivable dropping from $2,630 million to $2,546 million), Days Inventory Outstanding (DIO) at 87 days (inventory flat at $2,214 million), and Days Payable Outstanding (DPO) at 36 days (accounts payable at $955 million).
Operating cash flow increased to $575.8 million, but total FCF plummeted entirely due to $2,550 million in investing cash outflows. To fund the $1.82 billion (273 billion JPY) Sonoco Thermoformed and Flexible Packaging (TFP) acquisition, corporate bonds expanded from $334.3 million to $869.2 million, and long-term borrowings expanded from $519.3 million to $1,457.8 million.
Segment Disaggregation and Production Output
* Information & Communication (The Cash Anchor): Revenue fell marginally from $6,188.0 million to $6,173.0 million, generating an operating profit (OP) of $300.9 million (down from $304.2 million). Production volumes measured $6,021.5 million (down 0.7% YoY).
* Life & Industry (The Growth Engine): Revenue surged 31.4% from $3,678.0 million to $4,833.9 million, driven directly by the Sonoco TFP acquisition. OP contracted from $223.4 million to $221.0 million due to amortization drag. Production output reached $4,808.6 million (up 32.4% YoY).
* Electronics (The Cyclical Deep-Tech Play): Revenue contracted 34.2% from $1,894.5 million to $1,245.7 million, with OP falling 36.5% from $354.8 million to $225.3 million. Production output measured $1,255.9 million (down 32.6% YoY). Incoming orders measured $957.7 million against $1,255.9 million in sales, indicating backlog contraction.
Repeated Cash-Generating Unit (CGU) stress triggered heavy asset write-downs. FY2025 recorded $448.0 million in impairments ($244.9 million in Info & Comm; $179.5 million in Life & Industry). FY2026 registered $93.6 million in impairments ($32.7 million in Info & Comm; $20.6 million in Life & Industry; $11.6 million in Electronics). The balance sheet now carries $694.3 million in goodwill. The Life & Industry segment holds 80.9% of this premium ($561.6 million), with the Sonoco TFP deal alone representing $515.1 million. The Information & Communication segment carries $132.7 million in goodwill, while Electronics carries $0.0 million.
Infrastructure Layout, Regional Moats, and Capital Allocation
TOPPAN Holdings Inc. maintains a highly decentralized operational footprint designed to bypass geopolitical supply chain bottlenecks and extract regional demand. Tangible fixed assets (PPE) expanded 5.3% globally, rising from $4,151.9 million in FY2025 to $4,371.0 million in FY2026.
Geographic Revenue and PPE Repartition (FY2025 vs. FY2026)
* Japan: Revenue contracted 1.4% from $7,286.9 million to $7,185.0 million (59.5% of total). PPE dropped 1.4% from $2,820.8 million to $2,781.1 million (63.6% of total). Operations anchor TOPPAN Inc., handling core semiconductor components and advanced Business Process Outsourcing (BPO).
* Asia: Revenue dropped 13.7% from $2,263.2 million to $1,953.5 million (16.2% of total). PPE contracted 22.4% from $787.1 million to $611.0 million (14.0% of total). Assets include Giantplus Technology Co., Ltd. (Taiwan, China) for displays, alongside PT. TOPPAN Flexible Packaging Indonesia and Toppan Speciality Films Private Limited (India, formerly Max Speciality Films Limited).
* Americas: Revenue surged 73.5% from $953.3 million to $1,653.9 million (13.7% of total). PPE expanded 99.9% from $258.1 million to $516.1 million (11.8% of total). Infrastructure is routed through Toppan Packaging Americas Holdings Inc., Toppan Thermoformed Packaging Holdings Inc., and InterFlex Investment Holdings, Inc.
* Europe: Revenue expanded 28.5% from $993.2 million to $1,275.8 million (10.6% of total). PPE grew 61.9% from $285.9 million to $462.8 million (10.6% of total). Key bases include INTERPRINT GmbH (Germany), Toppan Packaging Czech s.r.o., and Irplast S.p.A.
Capital Expenditure vs. Depreciation & Amortization (FY2026)
Consolidated FY2026 CapEx measured $800.9 million (down from $1,128.1 million in FY2025) against total D&A of $529.7 million (up from $521.5 million), yielding an expansionary 1.51x ratio.
* Information & Communication: CapEx of $171.2 million vs. D&A of $175.4 million (0.98x ratio, maintenance phase).
* Life & Industry: CapEx of $310.1 million vs. D&A of $216.6 million (1.43x ratio, expansion phase).
* Electronics: CapEx of $225.7 million vs. D&A of $88.9 million (2.54x ratio, hyper-expansion phase).
* Corporate: CapEx of $93.9 million vs. D&A of $48.7 million.
R&D Execution and Technological Hard Entities
Total R&D expenditure measured $179.1 million in FY2026 (1.48% intensity), slightly down from $179.9 million (1.56% intensity) in FY2025. Human capital allocation features 1,197 R&D personnel: 463 in Life & Industry, 337 in Electronics, 256 in Information & Communication, and 140 in Corporate Basic Research.
The R&D pipeline targets specific technological moats. Electronics focuses on AI-driven Flip Chip-Ball Grid Array (FC-BGA) substrates, photomasks, and next-generation Redistribution Layer (RDL) technology in partnership with NEDO. Packaging scales GL BARRIER vapor-deposited films, SMARTS™, and Fapex® mono-materials. Digital Transformation (DX) utilizes Con:tegration® (AI/LLM workflows), LiveTra® and Edge Safe® (Post-Quantum Cryptography/IoT security), and vLEI digital authentication developed alongside GLEIF. Basic research commercializes invivoid® (3D cell culture), DATuM IDEA®, and QSCI-AFQMC quantum algorithms in collaboration with QIQB and OOYOO.
To mitigate supply chain shocks and carbon taxes, management implemented an Internal Carbon Pricing (ICP) mechanism at $140 USD/t-CO2. The company reduced Scope 1 and 2 emissions by 42.5%, tracking ahead of its 54.6% reduction target for 2030. Additionally, 7 manufacturing nodes currently operate in zones exceeding 40% water stress.
HDIN Institutional Verdict and Structural Risk Architecture
TOPPAN Holdings Inc. is unwinding historical conglomerate friction through rigid capital allocation and an aggressive clearing of off-balance sheet and non-core liabilities. Unexpired operating lease obligations expanded 370% from $17.7 million to $83.0 million due to the Sonoco TFP acquisition, while credit guarantees contracted from $381.6 million to $347.2 million.
Cross-Shareholdings and Capital Rotation
The Board of Directors is systematically liquidating inefficient strategic equity to fund high-margin M&A and FC-BGA cleanroom CapEx. In FY2026, the company liquidated $352.1 million in "Other Securities." The remaining portfolio consists of 85 unlisted issues valued at $114.7 million and 22 listed issues valued at $387.3 million, highly concentrated in legacy partners like Tokyo Broadcasting System (TBS), Mitsubishi UFJ Financial Group (MUFG), MS&AD Insurance, and SCREEN Holdings.
Actuarial Pension Risk Dynamics
A forensic review of the pension structure reveals high sensitivity to Japanese macroeconomic yield curves. Total projected retirement benefit obligations shrank 19% from $839.6 million to $679.9 million year-over-year. This was driven entirely by an actuarial shift, as management abruptly hiked the discount rate from a 0.1%-1.6% band to 2.3%. The funded plans hold $528.0 million in ring-fenced assets, creating a mathematical surplus of $54.2 million against a $473.8 million funded obligation. Unfunded lump-sum plans total $206.1 million. On the balance sheet, this reconciles to a net liability of $276.9 million and a net asset of $125.0 million.
Management Execution and KPI Linkage
Management acknowledges previous underperformance, where the FY2025 Non-GAAP ROE closed at 5.4% alongside $629.1 million in Non-GAAP Operating Profit. The "True Value Transformation" mandates a Phase 1 (2028) Non-GAAP ROE of 9.0% and OP of $969.5 million, scaling to a Phase 2 (2031) Non-GAAP ROE of 11.5% and OP of $1,404.0 million.
To enforce these targets, executive compensation relies heavily on at-risk metrics. The maximum payout matrix weights 34% in fixed base, 36% in performance bonuses (indexed 40% on Non-GAAP OP, 40% on Non-GAAP ROE, 20% on ESG), and 30% in stock compensation (indexed 40% on Non-GAAP ROE, 40% on relative Total Shareholder Return against the TOPIX, 20% on ESG). Operationally, human capital targets were successfully executed, with "Erhoeht-X" (DX/SX specialized personnel) reaching 6,241 against a 6,000 target, and female management representation hitting 15.3% against a 14.7% target.
Presentation Download & Video Access:
Presentation Download: Click the PDF download link under 'Related Topics' to access the full institutional presentation of this report.
Video Link: Click this link to watch the HDIN analyst briefing on YouTube.
About HDIN Research:
HDIN Research is a premier global market intelligence and strategic advisory firm specializing in institutional-grade financial analysis, supply chain audits, and macroeconomic forecasting. Our dedicated sector analysts deliver actionable, data-driven insights tailored for private equity, hedge funds, and corporate strategy teams. Visit us at http://www.hdinresearch.com.
2026 AI Transparency Footer:
"This intelligence report was authored by HDIN Research analysts following a rigorous audit of official corporate filings. AI was utilized for massive-scale data synthesis and structural drafting, ensuring 100% inclusion of reported data points. All strategic insights, financial modeling, and final verdicts were verified by our editorial board to ensure professional accuracy and compliance with 2026 Google Search E-E-A-T standards."
* TOPPAN Holdings Inc.'s $1.82 billion debt-funded acquisition of Sonoco Products Company’s packaging assets spiked Americas revenue by 73.5%, driving a consolidated FY2026 top-line of $12,068.3 million while decimating Free Cash Flow to negative $1,979.3 million.
* A deliberate "de-Japanization" strategy doubled Americas property, plant, and equipment assets to $516.1 million, whereas cyclical semiconductor weakness in Asia-Pacific concentrated at Giantplus Technology Co., Ltd. compressed regional revenue by 13.7%.
* Management is aggressively leveraging the balance sheet, surging corporate bonds to $869.2 million to buy structural global positioning, trading immediate operating margin compression (down 4.2%) for a targeted 11.5% Non-GAAP ROE by 2031.
Figure TOPPAN Holdings 2026: The Global Strategic Pivot
Segmental Realities, Margin Compression, and Financial Architecture
TOPPAN Holdings Inc. [TYO: 7911] is executing a capital-intensive structural pivot from legacy domestic printing to high-value global materials and digital ecosystems. Consolidated financials (converted at 1 USD = 149.5686 JPY) reflect a five-year trajectory characterized by top-line revenue expansion paired with acute profitability deterioration due to raw material inflation, post-merger integration (PMI) costs, and cyclical asset stress.
Table Five-Year Consolidated Financial Trajectory (FY2022–FY2026)
| Metric | FY2022 | FY2023 | FY2024 | FY2025 | FY2026 |
|---|---|---|---|---|---|
| Revenue (USD m) | 10,346.6 | 10,957.1 | 11,220.6 | 11,496.5 | 12,068.3 |
| Operating Income (USD m) | 510.3 | 542.7 | 551.6 | 598.9 | 506.3 |
| Net Income (USD m) | 823.6 | 407.0 | 496.1 | 602.7 | 433.3 |
| Gross Margin (%) | N/A | N/A | N/A | 24.0% | 23.5% |
| Operating Margin (%) | 4.9% | 5.0% | 4.9% | 5.2% | 4.2% |
| ROE (%) | 9.2% | 4.5% | 5.4% | 6.7% | 4.9% |
| Free Cash Flow (USD m) | 213.6 | 499.2 | 995.2 | 136.8 | (1,979.3) |
The FY2026 performance was driven by aggressive pricing pass-throughs and the consolidation of M&A assets rather than organic volume. The cash conversion cycle sits at 129 days, with Days Sales Outstanding (DSO) at 78 days (accounts receivable dropping from $2,630 million to $2,546 million), Days Inventory Outstanding (DIO) at 87 days (inventory flat at $2,214 million), and Days Payable Outstanding (DPO) at 36 days (accounts payable at $955 million).
Operating cash flow increased to $575.8 million, but total FCF plummeted entirely due to $2,550 million in investing cash outflows. To fund the $1.82 billion (273 billion JPY) Sonoco Thermoformed and Flexible Packaging (TFP) acquisition, corporate bonds expanded from $334.3 million to $869.2 million, and long-term borrowings expanded from $519.3 million to $1,457.8 million.
Segment Disaggregation and Production Output
* Information & Communication (The Cash Anchor): Revenue fell marginally from $6,188.0 million to $6,173.0 million, generating an operating profit (OP) of $300.9 million (down from $304.2 million). Production volumes measured $6,021.5 million (down 0.7% YoY).
* Life & Industry (The Growth Engine): Revenue surged 31.4% from $3,678.0 million to $4,833.9 million, driven directly by the Sonoco TFP acquisition. OP contracted from $223.4 million to $221.0 million due to amortization drag. Production output reached $4,808.6 million (up 32.4% YoY).
* Electronics (The Cyclical Deep-Tech Play): Revenue contracted 34.2% from $1,894.5 million to $1,245.7 million, with OP falling 36.5% from $354.8 million to $225.3 million. Production output measured $1,255.9 million (down 32.6% YoY). Incoming orders measured $957.7 million against $1,255.9 million in sales, indicating backlog contraction.
Repeated Cash-Generating Unit (CGU) stress triggered heavy asset write-downs. FY2025 recorded $448.0 million in impairments ($244.9 million in Info & Comm; $179.5 million in Life & Industry). FY2026 registered $93.6 million in impairments ($32.7 million in Info & Comm; $20.6 million in Life & Industry; $11.6 million in Electronics). The balance sheet now carries $694.3 million in goodwill. The Life & Industry segment holds 80.9% of this premium ($561.6 million), with the Sonoco TFP deal alone representing $515.1 million. The Information & Communication segment carries $132.7 million in goodwill, while Electronics carries $0.0 million.
Infrastructure Layout, Regional Moats, and Capital Allocation
TOPPAN Holdings Inc. maintains a highly decentralized operational footprint designed to bypass geopolitical supply chain bottlenecks and extract regional demand. Tangible fixed assets (PPE) expanded 5.3% globally, rising from $4,151.9 million in FY2025 to $4,371.0 million in FY2026.
Geographic Revenue and PPE Repartition (FY2025 vs. FY2026)
* Japan: Revenue contracted 1.4% from $7,286.9 million to $7,185.0 million (59.5% of total). PPE dropped 1.4% from $2,820.8 million to $2,781.1 million (63.6% of total). Operations anchor TOPPAN Inc., handling core semiconductor components and advanced Business Process Outsourcing (BPO).
* Asia: Revenue dropped 13.7% from $2,263.2 million to $1,953.5 million (16.2% of total). PPE contracted 22.4% from $787.1 million to $611.0 million (14.0% of total). Assets include Giantplus Technology Co., Ltd. (Taiwan, China) for displays, alongside PT. TOPPAN Flexible Packaging Indonesia and Toppan Speciality Films Private Limited (India, formerly Max Speciality Films Limited).
* Americas: Revenue surged 73.5% from $953.3 million to $1,653.9 million (13.7% of total). PPE expanded 99.9% from $258.1 million to $516.1 million (11.8% of total). Infrastructure is routed through Toppan Packaging Americas Holdings Inc., Toppan Thermoformed Packaging Holdings Inc., and InterFlex Investment Holdings, Inc.
* Europe: Revenue expanded 28.5% from $993.2 million to $1,275.8 million (10.6% of total). PPE grew 61.9% from $285.9 million to $462.8 million (10.6% of total). Key bases include INTERPRINT GmbH (Germany), Toppan Packaging Czech s.r.o., and Irplast S.p.A.
Capital Expenditure vs. Depreciation & Amortization (FY2026)
Consolidated FY2026 CapEx measured $800.9 million (down from $1,128.1 million in FY2025) against total D&A of $529.7 million (up from $521.5 million), yielding an expansionary 1.51x ratio.
* Information & Communication: CapEx of $171.2 million vs. D&A of $175.4 million (0.98x ratio, maintenance phase).
* Life & Industry: CapEx of $310.1 million vs. D&A of $216.6 million (1.43x ratio, expansion phase).
* Electronics: CapEx of $225.7 million vs. D&A of $88.9 million (2.54x ratio, hyper-expansion phase).
* Corporate: CapEx of $93.9 million vs. D&A of $48.7 million.
R&D Execution and Technological Hard Entities
Total R&D expenditure measured $179.1 million in FY2026 (1.48% intensity), slightly down from $179.9 million (1.56% intensity) in FY2025. Human capital allocation features 1,197 R&D personnel: 463 in Life & Industry, 337 in Electronics, 256 in Information & Communication, and 140 in Corporate Basic Research.
The R&D pipeline targets specific technological moats. Electronics focuses on AI-driven Flip Chip-Ball Grid Array (FC-BGA) substrates, photomasks, and next-generation Redistribution Layer (RDL) technology in partnership with NEDO. Packaging scales GL BARRIER vapor-deposited films, SMARTS™, and Fapex® mono-materials. Digital Transformation (DX) utilizes Con:tegration® (AI/LLM workflows), LiveTra® and Edge Safe® (Post-Quantum Cryptography/IoT security), and vLEI digital authentication developed alongside GLEIF. Basic research commercializes invivoid® (3D cell culture), DATuM IDEA®, and QSCI-AFQMC quantum algorithms in collaboration with QIQB and OOYOO.
To mitigate supply chain shocks and carbon taxes, management implemented an Internal Carbon Pricing (ICP) mechanism at $140 USD/t-CO2. The company reduced Scope 1 and 2 emissions by 42.5%, tracking ahead of its 54.6% reduction target for 2030. Additionally, 7 manufacturing nodes currently operate in zones exceeding 40% water stress.
HDIN Institutional Verdict and Structural Risk Architecture
TOPPAN Holdings Inc. is unwinding historical conglomerate friction through rigid capital allocation and an aggressive clearing of off-balance sheet and non-core liabilities. Unexpired operating lease obligations expanded 370% from $17.7 million to $83.0 million due to the Sonoco TFP acquisition, while credit guarantees contracted from $381.6 million to $347.2 million.
Cross-Shareholdings and Capital Rotation
The Board of Directors is systematically liquidating inefficient strategic equity to fund high-margin M&A and FC-BGA cleanroom CapEx. In FY2026, the company liquidated $352.1 million in "Other Securities." The remaining portfolio consists of 85 unlisted issues valued at $114.7 million and 22 listed issues valued at $387.3 million, highly concentrated in legacy partners like Tokyo Broadcasting System (TBS), Mitsubishi UFJ Financial Group (MUFG), MS&AD Insurance, and SCREEN Holdings.
Actuarial Pension Risk Dynamics
A forensic review of the pension structure reveals high sensitivity to Japanese macroeconomic yield curves. Total projected retirement benefit obligations shrank 19% from $839.6 million to $679.9 million year-over-year. This was driven entirely by an actuarial shift, as management abruptly hiked the discount rate from a 0.1%-1.6% band to 2.3%. The funded plans hold $528.0 million in ring-fenced assets, creating a mathematical surplus of $54.2 million against a $473.8 million funded obligation. Unfunded lump-sum plans total $206.1 million. On the balance sheet, this reconciles to a net liability of $276.9 million and a net asset of $125.0 million.
Management Execution and KPI Linkage
Management acknowledges previous underperformance, where the FY2025 Non-GAAP ROE closed at 5.4% alongside $629.1 million in Non-GAAP Operating Profit. The "True Value Transformation" mandates a Phase 1 (2028) Non-GAAP ROE of 9.0% and OP of $969.5 million, scaling to a Phase 2 (2031) Non-GAAP ROE of 11.5% and OP of $1,404.0 million.
To enforce these targets, executive compensation relies heavily on at-risk metrics. The maximum payout matrix weights 34% in fixed base, 36% in performance bonuses (indexed 40% on Non-GAAP OP, 40% on Non-GAAP ROE, 20% on ESG), and 30% in stock compensation (indexed 40% on Non-GAAP ROE, 40% on relative Total Shareholder Return against the TOPIX, 20% on ESG). Operationally, human capital targets were successfully executed, with "Erhoeht-X" (DX/SX specialized personnel) reaching 6,241 against a 6,000 target, and female management representation hitting 15.3% against a 14.7% target.
Presentation Download & Video Access:
Presentation Download: Click the PDF download link under 'Related Topics' to access the full institutional presentation of this report.
Video Link: Click this link to watch the HDIN analyst briefing on YouTube.
About HDIN Research:
HDIN Research is a premier global market intelligence and strategic advisory firm specializing in institutional-grade financial analysis, supply chain audits, and macroeconomic forecasting. Our dedicated sector analysts deliver actionable, data-driven insights tailored for private equity, hedge funds, and corporate strategy teams. Visit us at http://www.hdinresearch.com.
2026 AI Transparency Footer:
"This intelligence report was authored by HDIN Research analysts following a rigorous audit of official corporate filings. AI was utilized for massive-scale data synthesis and structural drafting, ensuring 100% inclusion of reported data points. All strategic insights, financial modeling, and final verdicts were verified by our editorial board to ensure professional accuracy and compliance with 2026 Google Search E-E-A-T standards."