Mitsui Chemicals: Advanced Materials Pivot Near Chiba as 23.1% OpCF CAGR Neutralizes Commodity Deflation
Date : 2026-07-01
Reading : 132
HDIN Executive Takeaways
* FY2026 Operating Cash Flows scaled to $1.42 billion (23.1% CAGR), effortlessly absorbing $901 million in strategic CapEx to yield $523 million in free cash flow.
* Basic Materials capacity consolidation near Chiba/Sodegaura mitigates geopolitical logistics risks, while inorganic M&A accelerates the high-margin EMEA/Americas healthcare footprint.
* Capital leverage remains highly disciplined; management stabilized the Net D/E ratio at 0.70x while embedding clawback provisions strictly tied to $1.67 billion core earnings targets.
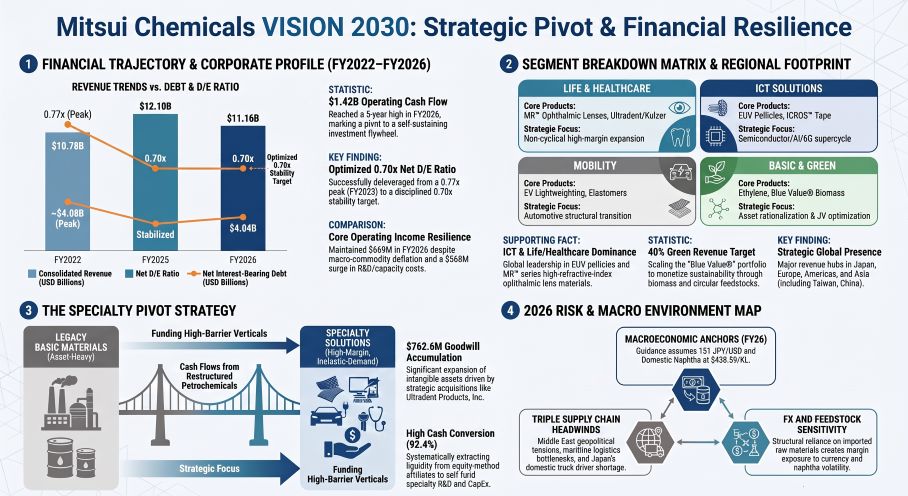
Figure Mitsui Chemicals VISlON 2030: Strategic Pivot & Financial Resilience
 Segmental Realities and Margin Compression
Mitsui Chemicals, Inc. [TSE: 4183] is executing a rigorous financial realignment, transitioning its capital structure to absorb upstream commodity deflation through downstream pricing power in specialized, high-barrier sectors. The consolidated top-line trajectory highlights severe exposure to global raw material volatility, contrasting with underlying gross margin durability engineered within the Life & Healthcare (L&HC) and ICT Solutions divisions.
Consolidated enterprise revenue printed at $11.16 billion in FY2026, representing a marginal 5-year CAGR of +0.86% from a FY2022 base of $10.78 billion. The year-over-year contraction from FY2025’s $12.10 billion top-line was dictated by raw material deflation rather than structural volume degradation. Domestic standard naphtha prices contracted from $493.4/KL (73,800 JPY) in FY2025 to $436.6/KL (65,300 JPY) in FY2026, compressing formula-linked revenue realization in the Basic & Green Materials sector.
Statutory Operating Income absorbed the brunt of this cyclicality, declining at a -16.5% CAGR from $945 million in FY2022 to $459 million in FY2026. Conversely, Core Operating Income exhibited structural resilience, shifting downward by a mere $6.7 million from $675 million in FY2025 to $669 million in FY2026.
*Core Operating Income Value Bridge (FY2025 to FY2026):*
* Volume Expansion: Generated +$67 million in positive yield.
* Pricing & Transaction Terms: Captured +$381 million in operational upside, dictated by quasi-monopolistic pricing power in the ICT and L&HC product lines.
* Fixed Cost Escalation: Incurred a -$568 million margin dilution entirely attributed to capacity expansions and an escalating R&D budget, which rose from $285.01 million (42,629 million JPY) in FY2025 to $313.64 million (46,910 million JPY) in FY2026.
To optimize balance sheet liquidity, the parent company maintains a highly efficient equity-method affiliate structure. In FY2026, the firm recognized $124.45 million (18.61 billion JPY) in Equity in Earnings of Affiliates, alongside $115.04 million (17.21 billion JPY) in actual cash dividends received. This 92.4% cash conversion ratio confirms systematic liquidity extraction from joint ventures to fund parent-level strategic outlays.
Looking forward, management’s FY2026 guidance projects revenue at $12.70 billion (1.90 trillion JPY) and Core Operating Income at $702.0 million (105.0 billion JPY). The forecast embeds Statutory Operating Income at $554.9 million (83.0 billion JPY) and Net Income Attributable to Owners at $300.9 million (45.0 billion JPY). This forward modeling utilizes internal macroeconomic assumptions of 151 JPY/USD and a domestic standard naphtha price of $436.59/KL (65,300 JPY/KL), converted at the standardized 2025 average rate of 149.5686 JPY/USD. Planned capital expenditures for the upcoming cycle are strictly capped at $895.9 million (134.0 billion JPY).
Infrastructure Layout and Regional Moats
The enterprise’s geographic footprint is undergoing aggressive restructuring to eliminate legacy commodity drag and centralize high-margin advanced materials infrastructure. Under the corporate “VISION 2030” mandate, the firm is initiating rigorous capacity rationalizations at heavy industrial complexes, most notably the Chiba/Sodegaura hub, physically reducing exposure to volatile ethylene and polyolefin spot markets.
Basic Materials production is increasingly localized via strategic joint ventures. Prime Polymer Co., Ltd. governs consolidated polyolefin output, while overseas operational risks are ring-fenced through entities such as Nghi Son Refinery & Petrochemical LLC in Asia, where the company maintains a recognized investment exposure of $98.72 million (14.76 billion JPY). Further regional synergies are captured in the nonwovens supply chain through Asahi Kasei Spunbond (Thailand) Co., Ltd.
Simultaneously, the firm is embedding proprietary technologies within global technology hardware and healthcare OEM supply chains. High-refractive-index lens materials (the MR™ series, including MR-8™, MR-10™, and MR-174™), RAV7™, and the biomass-derived Do Green™ series dictate the vision care market. The dental materials portfolio expanded globally via European subsidiary Kulzer GmbH and the strategic acquisition of US-based Ultradent Products, Inc. governed by Mitsui Chemicals America, Inc. (MCA). Precision coatings capabilities were further fortified through SDC Technologies, Inc.
The ICT Solutions segment operates at the vanguard of the semiconductor supercycle. Next-generation EUV pellicles, ICROS™ packaging tapes, SP-PET™, and AR/VR waveguide components (Diffar®) are engineered and scaled via the Mitsui Chemicals Singapore R&D Centre and domestic hubs. Following internal segment reorganizations to consolidate advanced materials logic, M.A. Life Materials Co., Ltd. (MAL) was reclassified into the ICT division, triggering an auditor-scrutinized fixed asset impairment of $9.40 million (1.40 billion JPY).
HDIN Institutional Verdict
Mitsui Chemicals has engineered a self-sustaining cash generation cycle that entirely insulates its deleveraging trajectory from the capital-consumptive nature of its strategic pivot. The financial audit demonstrates that FY2024 served as the critical inflection point; after recording negative Free Cash Flows of -$753 million on $1.37 billion CapEx in FY2022, and -$34 million FCF on $711 million CapEx in FY2023, the firm printed $250 million in positive FCF in FY2024. By FY2026, Operating Cash Flows of $1.42 billion systematically funded $901 million in CapEx, retaining $523 million in excess FCF without external syndication.
Management’s balance sheet execution is strictly controlled. Total equity expanded linearly from $4.76 billion in FY2022 to $5.78 billion in FY2026 against a total asset base of $14.39 billion. After peak utilization drove net interest-bearing debt to $4.08 billion in FY2023 (a Net D/E ratio of 0.77x), aggressive stabilization strategies compressed the Net D/E ratio to 0.70x through FY2025 and FY2026, operating safely below the 0.80x corporate ceiling.
Shareholder return metrics are supported by a 2-for-1 stock split effective January 1, 2026, structurally expanding outstanding shares from 200,843,815 to 401,687,630 to drive institutional liquidity. Share repurchases totaled $200.58 million (30.0 billion JPY) in FY2025 to sustain a targeted total shareholder return ratio above 40%.
Corporate governance dictates absolute accountability regarding these financial deployments. A lean Board of Directors consisting of eight members (three Outside Directors, 37.5% independence ratio) and an Audit & Supervisory Board of five members (three Outside Members, 60% independence ratio) mandate strict oversight. Executive compensation integrates malus and clawback provisions tethered to Total Shareholder Return (TSR), Return on Equity targets (10% by FY2028, 13% by FY2030), and scaled core operating income milestones ranging from $936 million (140 billion JPY) up to $1.67 billion (250 billion JPY), with net income targets stretching from $668.5 million to $1.00 billion.
On the environmental and risk reporting vector, Scope 1 and 2 GHG emissions have been compressed from a 6.15 million ton FY2013 baseline to 4.43 million tons in FY2024, aiming for 3.75 million tons by FY2030 and absolute carbon neutrality by 2050. The Blue Value® product ratio targets 40% of revenue by 2030.
Audit Notice:
The aggressive inorganic expansion roadmap has driven consolidated enterprise Goodwill from $699.51 million (104.62 billion JPY) in FY2025 to $762.65 million (114.07 billion JPY) in FY2026. Independent auditors flagged severe recoverability testing parameters surrounding gross Deferred Tax Asset (DTA) balances of $763.05 million (114.12 billion JPY) and $580.37 million (86.80 billion JPY), rendering balance sheet integrity strictly contingent upon M&A post-merger integration yields. Off-balance-sheet contingent liabilities linked to financial guarantees also expanded from $1.32 billion (197.42 billion JPY) in FY2025 to $1.35 billion (201.95 billion JPY) in FY2026. Note that highly granular operational ESG data—specifically the mathematical sensitivity per 1-yen FX fluctuation, exact logistics countermeasures for the Japan "2024 Problem," ISCC PLUS certification metrics, joint frameworks with Tosoh and Orbray, exact Sony BRAVIA material adoption rates, and isolated human capital ROI percentages—remain excluded from the consolidated fiscal disclosures.
Presentation Download & Video Access:
- Presentation Download: Click the PDF download link under 'Related Topics' to access the full institutional presentation of this report.
- Video Link: Click this link to watch the HDIN analyst briefing on YouTube.
About HDIN Research:
HDIN Research is a premier global market intelligence and strategic advisory firm specializing in institutional-grade financial analysis, supply chain audits, and macroeconomic forecasting. Our dedicated sector analysts deliver actionable, data-driven insights tailored for private equity, hedge funds, and corporate strategy teams. Visit us at http://www.hdinresearch.com.
*2026 AI Transparency Footer:*
"This intelligence report was authored by HDIN Research analysts following a rigorous audit of official corporate filings. AI was utilized for massive-scale data synthesis and structural drafting, ensuring 100% inclusion of reported data points. All strategic insights, financial modeling, and final verdicts were verified by our editorial board to ensure professional accuracy and compliance with 2026 Google Search E-E-A-T standards."
* FY2026 Operating Cash Flows scaled to $1.42 billion (23.1% CAGR), effortlessly absorbing $901 million in strategic CapEx to yield $523 million in free cash flow.
* Basic Materials capacity consolidation near Chiba/Sodegaura mitigates geopolitical logistics risks, while inorganic M&A accelerates the high-margin EMEA/Americas healthcare footprint.
* Capital leverage remains highly disciplined; management stabilized the Net D/E ratio at 0.70x while embedding clawback provisions strictly tied to $1.67 billion core earnings targets.
Figure Mitsui Chemicals VISlON 2030: Strategic Pivot & Financial Resilience
Segmental Realities and Margin CompressionMitsui Chemicals, Inc. [TSE: 4183] is executing a rigorous financial realignment, transitioning its capital structure to absorb upstream commodity deflation through downstream pricing power in specialized, high-barrier sectors. The consolidated top-line trajectory highlights severe exposure to global raw material volatility, contrasting with underlying gross margin durability engineered within the Life & Healthcare (L&HC) and ICT Solutions divisions.
Consolidated enterprise revenue printed at $11.16 billion in FY2026, representing a marginal 5-year CAGR of +0.86% from a FY2022 base of $10.78 billion. The year-over-year contraction from FY2025’s $12.10 billion top-line was dictated by raw material deflation rather than structural volume degradation. Domestic standard naphtha prices contracted from $493.4/KL (73,800 JPY) in FY2025 to $436.6/KL (65,300 JPY) in FY2026, compressing formula-linked revenue realization in the Basic & Green Materials sector.
Statutory Operating Income absorbed the brunt of this cyclicality, declining at a -16.5% CAGR from $945 million in FY2022 to $459 million in FY2026. Conversely, Core Operating Income exhibited structural resilience, shifting downward by a mere $6.7 million from $675 million in FY2025 to $669 million in FY2026.
*Core Operating Income Value Bridge (FY2025 to FY2026):*
* Volume Expansion: Generated +$67 million in positive yield.
* Pricing & Transaction Terms: Captured +$381 million in operational upside, dictated by quasi-monopolistic pricing power in the ICT and L&HC product lines.
* Fixed Cost Escalation: Incurred a -$568 million margin dilution entirely attributed to capacity expansions and an escalating R&D budget, which rose from $285.01 million (42,629 million JPY) in FY2025 to $313.64 million (46,910 million JPY) in FY2026.
To optimize balance sheet liquidity, the parent company maintains a highly efficient equity-method affiliate structure. In FY2026, the firm recognized $124.45 million (18.61 billion JPY) in Equity in Earnings of Affiliates, alongside $115.04 million (17.21 billion JPY) in actual cash dividends received. This 92.4% cash conversion ratio confirms systematic liquidity extraction from joint ventures to fund parent-level strategic outlays.
Looking forward, management’s FY2026 guidance projects revenue at $12.70 billion (1.90 trillion JPY) and Core Operating Income at $702.0 million (105.0 billion JPY). The forecast embeds Statutory Operating Income at $554.9 million (83.0 billion JPY) and Net Income Attributable to Owners at $300.9 million (45.0 billion JPY). This forward modeling utilizes internal macroeconomic assumptions of 151 JPY/USD and a domestic standard naphtha price of $436.59/KL (65,300 JPY/KL), converted at the standardized 2025 average rate of 149.5686 JPY/USD. Planned capital expenditures for the upcoming cycle are strictly capped at $895.9 million (134.0 billion JPY).
Infrastructure Layout and Regional Moats
The enterprise’s geographic footprint is undergoing aggressive restructuring to eliminate legacy commodity drag and centralize high-margin advanced materials infrastructure. Under the corporate “VISION 2030” mandate, the firm is initiating rigorous capacity rationalizations at heavy industrial complexes, most notably the Chiba/Sodegaura hub, physically reducing exposure to volatile ethylene and polyolefin spot markets.
Basic Materials production is increasingly localized via strategic joint ventures. Prime Polymer Co., Ltd. governs consolidated polyolefin output, while overseas operational risks are ring-fenced through entities such as Nghi Son Refinery & Petrochemical LLC in Asia, where the company maintains a recognized investment exposure of $98.72 million (14.76 billion JPY). Further regional synergies are captured in the nonwovens supply chain through Asahi Kasei Spunbond (Thailand) Co., Ltd.
Simultaneously, the firm is embedding proprietary technologies within global technology hardware and healthcare OEM supply chains. High-refractive-index lens materials (the MR™ series, including MR-8™, MR-10™, and MR-174™), RAV7™, and the biomass-derived Do Green™ series dictate the vision care market. The dental materials portfolio expanded globally via European subsidiary Kulzer GmbH and the strategic acquisition of US-based Ultradent Products, Inc. governed by Mitsui Chemicals America, Inc. (MCA). Precision coatings capabilities were further fortified through SDC Technologies, Inc.
The ICT Solutions segment operates at the vanguard of the semiconductor supercycle. Next-generation EUV pellicles, ICROS™ packaging tapes, SP-PET™, and AR/VR waveguide components (Diffar®) are engineered and scaled via the Mitsui Chemicals Singapore R&D Centre and domestic hubs. Following internal segment reorganizations to consolidate advanced materials logic, M.A. Life Materials Co., Ltd. (MAL) was reclassified into the ICT division, triggering an auditor-scrutinized fixed asset impairment of $9.40 million (1.40 billion JPY).
HDIN Institutional Verdict
Mitsui Chemicals has engineered a self-sustaining cash generation cycle that entirely insulates its deleveraging trajectory from the capital-consumptive nature of its strategic pivot. The financial audit demonstrates that FY2024 served as the critical inflection point; after recording negative Free Cash Flows of -$753 million on $1.37 billion CapEx in FY2022, and -$34 million FCF on $711 million CapEx in FY2023, the firm printed $250 million in positive FCF in FY2024. By FY2026, Operating Cash Flows of $1.42 billion systematically funded $901 million in CapEx, retaining $523 million in excess FCF without external syndication.
Management’s balance sheet execution is strictly controlled. Total equity expanded linearly from $4.76 billion in FY2022 to $5.78 billion in FY2026 against a total asset base of $14.39 billion. After peak utilization drove net interest-bearing debt to $4.08 billion in FY2023 (a Net D/E ratio of 0.77x), aggressive stabilization strategies compressed the Net D/E ratio to 0.70x through FY2025 and FY2026, operating safely below the 0.80x corporate ceiling.
Shareholder return metrics are supported by a 2-for-1 stock split effective January 1, 2026, structurally expanding outstanding shares from 200,843,815 to 401,687,630 to drive institutional liquidity. Share repurchases totaled $200.58 million (30.0 billion JPY) in FY2025 to sustain a targeted total shareholder return ratio above 40%.
Corporate governance dictates absolute accountability regarding these financial deployments. A lean Board of Directors consisting of eight members (three Outside Directors, 37.5% independence ratio) and an Audit & Supervisory Board of five members (three Outside Members, 60% independence ratio) mandate strict oversight. Executive compensation integrates malus and clawback provisions tethered to Total Shareholder Return (TSR), Return on Equity targets (10% by FY2028, 13% by FY2030), and scaled core operating income milestones ranging from $936 million (140 billion JPY) up to $1.67 billion (250 billion JPY), with net income targets stretching from $668.5 million to $1.00 billion.
On the environmental and risk reporting vector, Scope 1 and 2 GHG emissions have been compressed from a 6.15 million ton FY2013 baseline to 4.43 million tons in FY2024, aiming for 3.75 million tons by FY2030 and absolute carbon neutrality by 2050. The Blue Value® product ratio targets 40% of revenue by 2030.
Audit Notice:
The aggressive inorganic expansion roadmap has driven consolidated enterprise Goodwill from $699.51 million (104.62 billion JPY) in FY2025 to $762.65 million (114.07 billion JPY) in FY2026. Independent auditors flagged severe recoverability testing parameters surrounding gross Deferred Tax Asset (DTA) balances of $763.05 million (114.12 billion JPY) and $580.37 million (86.80 billion JPY), rendering balance sheet integrity strictly contingent upon M&A post-merger integration yields. Off-balance-sheet contingent liabilities linked to financial guarantees also expanded from $1.32 billion (197.42 billion JPY) in FY2025 to $1.35 billion (201.95 billion JPY) in FY2026. Note that highly granular operational ESG data—specifically the mathematical sensitivity per 1-yen FX fluctuation, exact logistics countermeasures for the Japan "2024 Problem," ISCC PLUS certification metrics, joint frameworks with Tosoh and Orbray, exact Sony BRAVIA material adoption rates, and isolated human capital ROI percentages—remain excluded from the consolidated fiscal disclosures.
Presentation Download & Video Access:
- Presentation Download: Click the PDF download link under 'Related Topics' to access the full institutional presentation of this report.
- Video Link: Click this link to watch the HDIN analyst briefing on YouTube.
About HDIN Research:
HDIN Research is a premier global market intelligence and strategic advisory firm specializing in institutional-grade financial analysis, supply chain audits, and macroeconomic forecasting. Our dedicated sector analysts deliver actionable, data-driven insights tailored for private equity, hedge funds, and corporate strategy teams. Visit us at http://www.hdinresearch.com.
*2026 AI Transparency Footer:*
"This intelligence report was authored by HDIN Research analysts following a rigorous audit of official corporate filings. AI was utilized for massive-scale data synthesis and structural drafting, ensuring 100% inclusion of reported data points. All strategic insights, financial modeling, and final verdicts were verified by our editorial board to ensure professional accuracy and compliance with 2026 Google Search E-E-A-T standards."