OMRON Corporation: $5.3 Billion R&D Realignment Near India and Japan as 10.2% Headcount Contraction Signals
Date : 2026-07-04
Reading : 173
HDIN Executive Takeaways
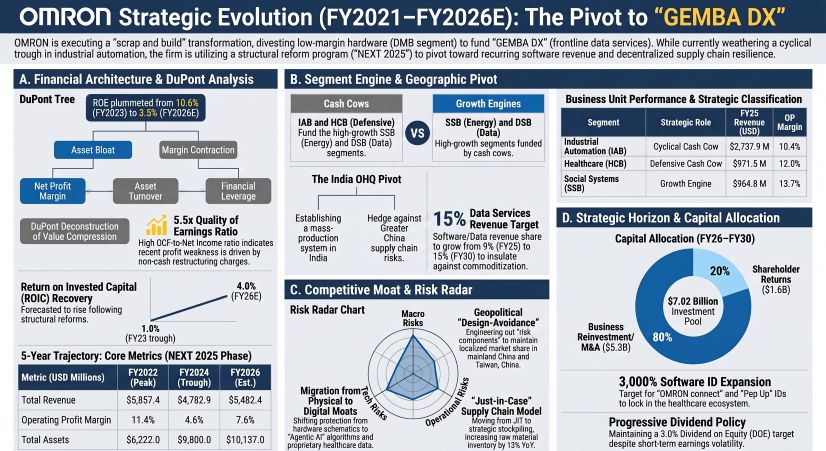
* OMRON Corporation targets a 15% revenue share from Data Services by FY2030, supported by a $5,348.7 million reinvestment allocation to transition from hardware toward a "GEMBA DX" software ecosystem.
* The supply chain is actively migrating toward India (OHQ) from Greater China nodes, deliberately inflating FY2025 raw material inventory by 13.0% to $814.9 million to buffer against geopolitical fragmentation.
* A 62% asset base expansion to $10,137 million, following the JMDC consolidation and $247.26 million in FY2025 restructuring charges, has deeply compressed FY2026 projected ROE to 3.5%.
Figure Omron Strategic Evolution (FY2021-FY2026E): The Pivot to GEMBA DX
 Segmental Realities and Margin Compression
OMRON Corporation [TSE: 6645] is executing a "NEXT 2025" and "SF 2nd Stage" (FY2026–FY2030) structural reform framework following severe operational deleverage across its "SF 1st Stage". The corporate portfolio is bifurcated into legacy hardware divisions acting as cash flow generators and software-integrated segments designated as growth engines.
The Industrial Automation Business (IAB), representing 53% of FY2025 revenue, experienced a violent margin contraction from a peak of 17.7% in FY2022 to 10.4% in FY2025. Conversely, the Data Solution Business (DSB), currently generating 7% of segment revenue (with broader Data Services capturing 9%), is targeted to reach 15% of total corporate revenue by FY2030.
Table Core 5-Year Consolidated Financial Trajectory (1 USD = 149.5686 JPY)
Segmental Breakdown & Target Architecture
* IAB (Industrial Automation): Revenue peaked at $3,247.3 million (¥485.7B) in FY2022, contracting to $2,438.3 million in FY2024, and recovering to $2,737.9 million (¥409.5B) in FY2025. Operating profit dropped from $573.6 million in FY2022 to $143.7 million (5.5%) in FY2023, settling at $286.2 million in FY2025.
* HCB (Healthcare): Revenue scaled from $888.6 million in FY2021 to $971.5 million in FY2025, with an FY2026 target of $1,002.9 million. Operating profit remained stable between $103.0 million and $123.7 million (10.6%–14.0% margin). Device volume reached 25.61 million (often aggregated to 25.6 million) global blood pressure monitors in FY2025, targeting 31.72 million by FY2030.
* SSB (Social Systems): Revenue expanded from $586.4 million in FY2021 to $964.8 million in FY2025, targeting over $1 billion by FY2026 and 125,000 energy storage unit shipments by FY2030. Operating profit expanded from $43.5 million (7.4%) in FY2021 to $131.7 million (13.7%) in FY2025.
* DSB & Data Services: Segment revenue grew from $116.3 million in FY2023 to $342.3 million in FY2025, generating $24.1 million in operating profit (7.1%). Total Data Services revenue reached $477.4 million (¥71.4B) in FY2025, with internal guidance projecting an expansion to $603.0 million (¥90.2B, or 11% of total revenue) in FY2026. Management targets a +3,000% expansion in "OMRON connect" and "Pep Up" linked software IDs against FY2024 baselines.
Human Capital Contraction & Labor Productivity Dynamics
Management is actively reducing legacy overhead while targeting an influx of over 1,000 Systems Engineers (SE) and DX specialists to secure Agentic AI and Edge Control capabilities. The firm targets an internal generation of 100 management talents and aims to raise its "VOICE" employee engagement score from 67 in FY2025 to 70 by FY2030.
* Headcount: 29,020 (FY2022) → 26,614 (FY2025) → 26,050 (FY2026E), representing a 10.2% workforce contraction.
* Revenue per Employee: $175,770 / ¥26.29M (FY2022) → $208,938 / ¥31.25M (FY2023) → $192,413 / ¥28.77M (FY2024) → $179,715 / ¥26.88M (FY2025) → $196,945 / ¥29.45M (FY2026E).
* Operating Profit per Employee: $19,977 (FY2022) → $23,469 (FY2023) → $8,323 (FY2025) → $13,492 (FY2026E).
Infrastructure Layout and Regional Moats
OMRON Corporation is dismantling its legacy "Just-in-Time" procurement framework in favor of a "Just-in-Case" localized architecture to defend against East Asian geopolitical fragmentation, technology embargoes, and semiconductor shortages. Total assets surged 62% from $6,222 million to $10,137 million during the five-year window.
Global Manufacturing Grid & Supply Chain Audits
The core physical layout relies on R&D hubs in Japan (Omron Kansai) and heavy manufacturing scale in Greater China, anchored by OMRON (SHANGHAI) CO., LTD., OMRON DALIAN CO., LTD., and OMRON TAIWAN ELECTRONICS INC. located in Taiwan, China. To hedge this concentration risk, OMRON Corporation completed a mass production system in India (OHQ) to execute dual-tracking of procurement.
* Inventory Bloat: Total inventory grew from $1,676.0 million (¥250.68B) in FY2024 to $1,832.3 million (¥274.05B) in FY2025. This was driven by a 13.0% YoY inflation in Raw Materials to $814.9 million and a 16.9% YoY inflation in Work-in-Process (WIP) to $157.2 million. Finished Goods grew by 5.6% YoY to $843.3 million.
* Working Capital Velocity: Days Inventory Outstanding (DIO) stands at 133.4 days in FY2025 (Inventory of $941.2 million / Cost of Sales of $2,574.6 million × 365), projected at 135.2 days in FY2026. Days Sales Outstanding (DSO) remains stable at 80.5 days in FY2025 (Trade Receivables of $1,054.5 million / Revenue of $4,782.9 million × 365), projected at 80.7 days in FY2026.
* Purchase Commitments: Off-balance-sheet unconditional purchase commitments expanded by 89.4% YoY, rising from $116.3 million (¥17.38B) in FY2024 to $220.3 million (¥32.95B) in FY2025.
* Property, Plant, and Equipment (PP&E): Net book value increased from $882.2 million (¥131.95B) in FY2024 to $1,113.5 million (¥166.54B) in FY2025.
* ESG Compliance Vectors: Across its 20 primary global production bases, OMRON Corporation enforces strict zero-emissions mandates via solar Power Purchase Agreements (PPA), aligned with TCFD transition risk mitigation and UNGP/RBA human rights audits. Corporate targets dictate a 68% reduction in Scope 1 and 2 emissions and a 35% reduction in Scope 3 emissions by FY2030 against an FY2016 baseline.
HDIN Institutional Verdict
The financial anatomy of OMRON Corporation currently exhibits high cash generation quality severely masked by heavy M&A integration drags and inflexible dividend mandates. Operating Cash Flow ranges structurally between $300 million and $450 million annually, logging $373.0 million against a Net Income of $108.8 million in FY2025. This drove the Quality of Earnings ratio from 1.1x in FY2022 to 5.5x in FY2024, maintaining a 3.4x multiple in FY2025.
Capital Reallocation & The Carlyle Discontinuation
The total available investment pool for the FY2026–FY2030 trajectory is strictly capped at $7,020.2 million (¥1,050 billion), funded via $5,683.0 million (¥850 billion) in operational cash and $1,337.2 million (¥200 billion) in debt utilization. Exactly 80% ($5,348.7 million / ¥800 billion) is prioritized for business reinvestment and M&A. Within this tranche, 70% is fenced for "Focus Businesses", and 50% of the total reinvestment capital is exclusively directed toward the IAB control equipment sector. R&D expenditure is projected to migrate from a 40% software allocation in FY2024 to a 60% software allocation by FY2030. Internal disclosures present a dual track for R&D reporting, logging $267.2 million (5.6% of revenue) versus $373.0 million for FY2025, and $305.3 million (6.0% of revenue) versus $407.3 million for FY2026.
To surgically artificially enhance ROIC toward the 8% to 10% target and achieve a 20% EPS growth target, the firm is utilizing inorganic levers. OMRON Corporation consolidated the JMDC health database in October 2023 and formed a capital alliance with AliveCor for AI-driven ECG IP (tracked via VALUENEX Radar). Furthermore, the Device & Module Solutions (DMB) hardware segment is being carved out to a Special Purpose Company managed by The Carlyle Group by March 2026. This shifted Net Income from Discontinued Operations from $14.86 million (¥2.22B) in FY2024 to $38.14 million (¥5.70B) in FY2025.
Forensic Audit Adjustments (IFRS 16 & Non-Cash Provisions)
Underlying operating profit has been directly cannibalized by "NEXT 2025" clearance events. "Other Operating Expenses" surged from $114.30 million (¥17.09B) in FY2024 to $247.26 million (¥36.98B) in FY2025. Netting against "Other Operating Income" (which declined from $102.67 million to $90.03 million), extraordinary items generated a $157.23 million (¥23.51B) drag on FY2025 Operating Profit.
Latent balance sheet risks are actively crystallizing. Current Provisions spiked from $180.79 million (¥27.04B) in FY2024 to $207.99 million (¥31.11B) in FY2025, while Non-Current Provisions simultaneously collapsed from $62.92 million (¥9.41B) to zero. Non-current Retirement Benefit liabilities remain an inflexible dead-weight, recorded at $467.77 million (¥69.96B) in FY2024 and $471.34 million (¥70.49B) in FY2025 (with variant internal reporting citing $471.3 million / ¥70.50B for FY2026).
Despite an estimated 5.5% ROE, management retains a rigidly defensive 3.0% Dividend on Equity (DOE) target, holding the dividend flat at ¥104 ($0.70). This forced the payout ratio to 253.3% in FY2023, 126.2% in FY2024, and 72.1% in FY2025, absorbing the 20% capital allocation pool slice ($1,671.5 million) dedicated to shareholder returns. Governance oversight of this transition relies on a 12-member board featuring 5 outside directors (41.7%) and 2 female directors (16.7%), with formal 2027 targets mandating over 50% outside and over 20% female representation. The CSIRT and PSIRT structures (mapped to NIST-CSF) safeguard the data expansion, while executive compensation leverages a 1.0 : 1.0 : 1.7 (Base : Short-term : Long-term) structure, penalizing executives via a rigid ROIC modifier on the short-term OP/NI split, and tying the Board Incentive Plan trust to an 80% TSR and 20% ESG weighting.
Presentation Download & Video Access:
- Presentation Download: Click the PDF download link under 'Related Topics' to access the full institutional presentation of this report.
- Video Link: Click this link to watch the HDIN analyst briefing on YouTube.
About HDIN Research:
HDIN Research is a premier global market intelligence and strategic advisory firm specializing in institutional-grade financial analysis, supply chain audits, and macroeconomic forecasting. Our dedicated sector analysts deliver actionable, data-driven insights tailored for private equity, hedge funds, and corporate strategy teams. Visit us at http://www.hdinresearch.com.
*2026 AI Transparency Footer:*
"This intelligence report was authored by HDIN Research analysts following a rigorous audit of official corporate filings. AI was utilized for massive-scale data synthesis and structural drafting, ensuring 100% inclusion of reported data points. All strategic insights, financial modeling, and final verdicts were verified by our editorial board to ensure professional accuracy and compliance with 2026 Google Search E-E-A-T standards."
* OMRON Corporation targets a 15% revenue share from Data Services by FY2030, supported by a $5,348.7 million reinvestment allocation to transition from hardware toward a "GEMBA DX" software ecosystem.
* The supply chain is actively migrating toward India (OHQ) from Greater China nodes, deliberately inflating FY2025 raw material inventory by 13.0% to $814.9 million to buffer against geopolitical fragmentation.
* A 62% asset base expansion to $10,137 million, following the JMDC consolidation and $247.26 million in FY2025 restructuring charges, has deeply compressed FY2026 projected ROE to 3.5%.
Figure Omron Strategic Evolution (FY2021-FY2026E): The Pivot to GEMBA DX
Segmental Realities and Margin CompressionOMRON Corporation [TSE: 6645] is executing a "NEXT 2025" and "SF 2nd Stage" (FY2026–FY2030) structural reform framework following severe operational deleverage across its "SF 1st Stage". The corporate portfolio is bifurcated into legacy hardware divisions acting as cash flow generators and software-integrated segments designated as growth engines.
The Industrial Automation Business (IAB), representing 53% of FY2025 revenue, experienced a violent margin contraction from a peak of 17.7% in FY2022 to 10.4% in FY2025. Conversely, the Data Solution Business (DSB), currently generating 7% of segment revenue (with broader Data Services capturing 9%), is targeted to reach 15% of total corporate revenue by FY2030.
Table Core 5-Year Consolidated Financial Trajectory (1 USD = 149.5686 JPY)
| Metric | FY2022 Actual | FY2023 Actual | FY2024 Actual | FY2025 Actual | FY2026 Estimates (Guidance Discrepancies Noted) |
|---|---|---|---|---|---|
| Top-Line Revenue | $4,586.4M | $5,857.4M (¥876.1B) | — | $4,782.9M (¥715.4B) | $5,130.4M (¥767.4B) / Alt. Target: $5,482.4M (¥820.0B) |
| Gross Profit Margin | 45.0%–46.6% | 45.0%–46.6% | 45.0%–46.6% | 45.0%–46.6% | — |
| Operating Profit (OP) | — | — | — | — | $414.5M (¥62.0B) |
| Operating Margin (OPM) | 11.4% | — | — | 4.6% | 6.9% / Alt. Target: 7.6% |
| Net Profit Margin (NPM) | 8.0% | 8.4% | 1.0% | 2.3% | 3.7% |
| Return on Equity (ROE) | 9.7% | 10.6% | — | — | 3.5% / Alt. Target: 5.5% (FY2030 Target: 10%–12%) |
| ROIC | 10.4% | 1.0% | — | 3.9% | 4.0% (FY2030 Target: 8%–10%) |
| Asset Turnover | 0.82× | — | — | — | 0.51× |
| Equity Multiplier | 1.40× (71.5% equity ratio) | — | — | — | 1.81× (55.1% equity ratio) |
Segmental Breakdown & Target Architecture
* IAB (Industrial Automation): Revenue peaked at $3,247.3 million (¥485.7B) in FY2022, contracting to $2,438.3 million in FY2024, and recovering to $2,737.9 million (¥409.5B) in FY2025. Operating profit dropped from $573.6 million in FY2022 to $143.7 million (5.5%) in FY2023, settling at $286.2 million in FY2025.
* HCB (Healthcare): Revenue scaled from $888.6 million in FY2021 to $971.5 million in FY2025, with an FY2026 target of $1,002.9 million. Operating profit remained stable between $103.0 million and $123.7 million (10.6%–14.0% margin). Device volume reached 25.61 million (often aggregated to 25.6 million) global blood pressure monitors in FY2025, targeting 31.72 million by FY2030.
* SSB (Social Systems): Revenue expanded from $586.4 million in FY2021 to $964.8 million in FY2025, targeting over $1 billion by FY2026 and 125,000 energy storage unit shipments by FY2030. Operating profit expanded from $43.5 million (7.4%) in FY2021 to $131.7 million (13.7%) in FY2025.
* DSB & Data Services: Segment revenue grew from $116.3 million in FY2023 to $342.3 million in FY2025, generating $24.1 million in operating profit (7.1%). Total Data Services revenue reached $477.4 million (¥71.4B) in FY2025, with internal guidance projecting an expansion to $603.0 million (¥90.2B, or 11% of total revenue) in FY2026. Management targets a +3,000% expansion in "OMRON connect" and "Pep Up" linked software IDs against FY2024 baselines.
Human Capital Contraction & Labor Productivity Dynamics
Management is actively reducing legacy overhead while targeting an influx of over 1,000 Systems Engineers (SE) and DX specialists to secure Agentic AI and Edge Control capabilities. The firm targets an internal generation of 100 management talents and aims to raise its "VOICE" employee engagement score from 67 in FY2025 to 70 by FY2030.
* Headcount: 29,020 (FY2022) → 26,614 (FY2025) → 26,050 (FY2026E), representing a 10.2% workforce contraction.
* Revenue per Employee: $175,770 / ¥26.29M (FY2022) → $208,938 / ¥31.25M (FY2023) → $192,413 / ¥28.77M (FY2024) → $179,715 / ¥26.88M (FY2025) → $196,945 / ¥29.45M (FY2026E).
* Operating Profit per Employee: $19,977 (FY2022) → $23,469 (FY2023) → $8,323 (FY2025) → $13,492 (FY2026E).
Infrastructure Layout and Regional Moats
OMRON Corporation is dismantling its legacy "Just-in-Time" procurement framework in favor of a "Just-in-Case" localized architecture to defend against East Asian geopolitical fragmentation, technology embargoes, and semiconductor shortages. Total assets surged 62% from $6,222 million to $10,137 million during the five-year window.
Global Manufacturing Grid & Supply Chain Audits
The core physical layout relies on R&D hubs in Japan (Omron Kansai) and heavy manufacturing scale in Greater China, anchored by OMRON (SHANGHAI) CO., LTD., OMRON DALIAN CO., LTD., and OMRON TAIWAN ELECTRONICS INC. located in Taiwan, China. To hedge this concentration risk, OMRON Corporation completed a mass production system in India (OHQ) to execute dual-tracking of procurement.
* Inventory Bloat: Total inventory grew from $1,676.0 million (¥250.68B) in FY2024 to $1,832.3 million (¥274.05B) in FY2025. This was driven by a 13.0% YoY inflation in Raw Materials to $814.9 million and a 16.9% YoY inflation in Work-in-Process (WIP) to $157.2 million. Finished Goods grew by 5.6% YoY to $843.3 million.
* Working Capital Velocity: Days Inventory Outstanding (DIO) stands at 133.4 days in FY2025 (Inventory of $941.2 million / Cost of Sales of $2,574.6 million × 365), projected at 135.2 days in FY2026. Days Sales Outstanding (DSO) remains stable at 80.5 days in FY2025 (Trade Receivables of $1,054.5 million / Revenue of $4,782.9 million × 365), projected at 80.7 days in FY2026.
* Purchase Commitments: Off-balance-sheet unconditional purchase commitments expanded by 89.4% YoY, rising from $116.3 million (¥17.38B) in FY2024 to $220.3 million (¥32.95B) in FY2025.
* Property, Plant, and Equipment (PP&E): Net book value increased from $882.2 million (¥131.95B) in FY2024 to $1,113.5 million (¥166.54B) in FY2025.
* ESG Compliance Vectors: Across its 20 primary global production bases, OMRON Corporation enforces strict zero-emissions mandates via solar Power Purchase Agreements (PPA), aligned with TCFD transition risk mitigation and UNGP/RBA human rights audits. Corporate targets dictate a 68% reduction in Scope 1 and 2 emissions and a 35% reduction in Scope 3 emissions by FY2030 against an FY2016 baseline.
HDIN Institutional Verdict
The financial anatomy of OMRON Corporation currently exhibits high cash generation quality severely masked by heavy M&A integration drags and inflexible dividend mandates. Operating Cash Flow ranges structurally between $300 million and $450 million annually, logging $373.0 million against a Net Income of $108.8 million in FY2025. This drove the Quality of Earnings ratio from 1.1x in FY2022 to 5.5x in FY2024, maintaining a 3.4x multiple in FY2025.
Capital Reallocation & The Carlyle Discontinuation
The total available investment pool for the FY2026–FY2030 trajectory is strictly capped at $7,020.2 million (¥1,050 billion), funded via $5,683.0 million (¥850 billion) in operational cash and $1,337.2 million (¥200 billion) in debt utilization. Exactly 80% ($5,348.7 million / ¥800 billion) is prioritized for business reinvestment and M&A. Within this tranche, 70% is fenced for "Focus Businesses", and 50% of the total reinvestment capital is exclusively directed toward the IAB control equipment sector. R&D expenditure is projected to migrate from a 40% software allocation in FY2024 to a 60% software allocation by FY2030. Internal disclosures present a dual track for R&D reporting, logging $267.2 million (5.6% of revenue) versus $373.0 million for FY2025, and $305.3 million (6.0% of revenue) versus $407.3 million for FY2026.
To surgically artificially enhance ROIC toward the 8% to 10% target and achieve a 20% EPS growth target, the firm is utilizing inorganic levers. OMRON Corporation consolidated the JMDC health database in October 2023 and formed a capital alliance with AliveCor for AI-driven ECG IP (tracked via VALUENEX Radar). Furthermore, the Device & Module Solutions (DMB) hardware segment is being carved out to a Special Purpose Company managed by The Carlyle Group by March 2026. This shifted Net Income from Discontinued Operations from $14.86 million (¥2.22B) in FY2024 to $38.14 million (¥5.70B) in FY2025.
Forensic Audit Adjustments (IFRS 16 & Non-Cash Provisions)
Underlying operating profit has been directly cannibalized by "NEXT 2025" clearance events. "Other Operating Expenses" surged from $114.30 million (¥17.09B) in FY2024 to $247.26 million (¥36.98B) in FY2025. Netting against "Other Operating Income" (which declined from $102.67 million to $90.03 million), extraordinary items generated a $157.23 million (¥23.51B) drag on FY2025 Operating Profit.
Latent balance sheet risks are actively crystallizing. Current Provisions spiked from $180.79 million (¥27.04B) in FY2024 to $207.99 million (¥31.11B) in FY2025, while Non-Current Provisions simultaneously collapsed from $62.92 million (¥9.41B) to zero. Non-current Retirement Benefit liabilities remain an inflexible dead-weight, recorded at $467.77 million (¥69.96B) in FY2024 and $471.34 million (¥70.49B) in FY2025 (with variant internal reporting citing $471.3 million / ¥70.50B for FY2026).
Despite an estimated 5.5% ROE, management retains a rigidly defensive 3.0% Dividend on Equity (DOE) target, holding the dividend flat at ¥104 ($0.70). This forced the payout ratio to 253.3% in FY2023, 126.2% in FY2024, and 72.1% in FY2025, absorbing the 20% capital allocation pool slice ($1,671.5 million) dedicated to shareholder returns. Governance oversight of this transition relies on a 12-member board featuring 5 outside directors (41.7%) and 2 female directors (16.7%), with formal 2027 targets mandating over 50% outside and over 20% female representation. The CSIRT and PSIRT structures (mapped to NIST-CSF) safeguard the data expansion, while executive compensation leverages a 1.0 : 1.0 : 1.7 (Base : Short-term : Long-term) structure, penalizing executives via a rigid ROIC modifier on the short-term OP/NI split, and tying the Board Incentive Plan trust to an 80% TSR and 20% ESG weighting.
Presentation Download & Video Access:
- Presentation Download: Click the PDF download link under 'Related Topics' to access the full institutional presentation of this report.
- Video Link: Click this link to watch the HDIN analyst briefing on YouTube.
About HDIN Research:
HDIN Research is a premier global market intelligence and strategic advisory firm specializing in institutional-grade financial analysis, supply chain audits, and macroeconomic forecasting. Our dedicated sector analysts deliver actionable, data-driven insights tailored for private equity, hedge funds, and corporate strategy teams. Visit us at http://www.hdinresearch.com.
*2026 AI Transparency Footer:*
"This intelligence report was authored by HDIN Research analysts following a rigorous audit of official corporate filings. AI was utilized for massive-scale data synthesis and structural drafting, ensuring 100% inclusion of reported data points. All strategic insights, financial modeling, and final verdicts were verified by our editorial board to ensure professional accuracy and compliance with 2026 Google Search E-E-A-T standards."