Seiko Epson Corporation: 2026 Capex Realignment Near Greater China and Southeast Asia Hubs as 154.4-Day Cash Conversion Cycle Signals Severe Working Capital Friction
Date : 2026-07-04
Reading : 137
HDIN Executive Takeaways
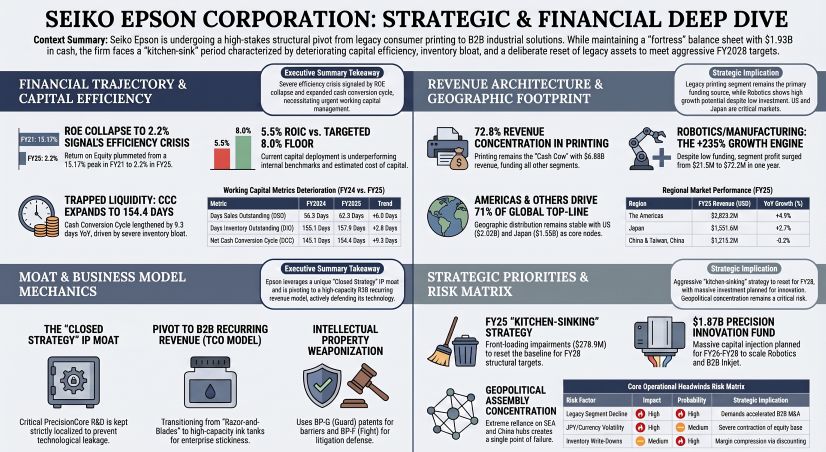
* Seiko Epson Corporation [TYO: 6724] experienced a 67.0% year-over-year contraction in FY25 Net Income to $121.7M, obscured by a 157.9-day inventory holding period that artificially bloats the balance sheet with $2,639.1M in working capital.
* Geopolitical vulnerability is heavily concentrated across Southeast Asian and Greater China megahubs—including Tianjin Epson Co., Ltd. and Epson Precision (Philippines), Inc.—which manage 100% of the firm's non-domestic final assembly throughput.
* A massive 120% expansion in Other Operating Expenses to $278.9M indicates deliberate "kitchen-sinking" of legacy assets, mathematically suppressing the current 2.20% Return on Equity (ROE) to clear the runway for a $668.6M external M&A deployment strategy.
Figure SEIKO EPSON CORPORATION: STRATEGIC & FINANCIAL DEEP DIVE
 Segmental Realities and Margin Compression
Seiko Epson’s operational architecture is executing a high-friction transition from its legacy B2C printing matrix toward industrial B2B automation. Against an aggregate top-line expansion of 3.7% to $9,448.9M (converted at the mandated rate of 1 USD = 149.5686 JPY), Gross Profit compressed to $3,348.0M, driving a Gross Margin contraction from 36.2% in FY24 to 35.4% in FY25. Selling, General, and Administrative (SG&A) expenses absorbed $2,787.8M of this yield. Total Operating Cash Flow (OCF), which peaked in FY23 at $1,107.0M (against Net Income of $351.8M), degraded from $923.1M in FY24 to $751.3M in FY25. Despite this, the OCF-to-Net Income ratio spiked from historical averages of 2.5x–3.1x to 6.2x in FY25, exposing extreme non-cash profitability drags.
The underlying structural decay is most visible in the Return on Equity (ROE), which collapsed sequentially from 15.17% (FY21), to 6.83% (FY24), landing at 2.20% in FY25. Return on Invested Capital (ROIC) printed at 5.5%, failing to clear standard technology hardware WACC assumptions of 7% to 9%. Return on Sales (ROS) degraded to 5.9%. Management’s "Epson 25 Renewed" strategy explicitly targeted 8.0% ROE, 7.0% ROIC, and 7.0% ROS, undershooting all primary metrics ahead of their revised FY28 "Transform" targets of 10.0% ROE, 8.0% ROIC, and 8.0% ROS.
Table Consolidated Segment Performance (FY24 to FY25)
The reported 34.0% contraction in consolidated Operating Profit—from $502.2M (¥75,108M) to $331.3M (¥49,558M)—is heavily distorted by accounting treatments. Management isolated core metrics via a structural "Business Profit" line. Other Operating Income injected $50.1M (¥7,486M) in FY25 versus $30.0M (¥4,494M) in FY24. Conversely, Other Operating Expenses absorbed $278.9M (¥41,717M) in FY25, up from $126.9M (¥18,975M) in FY24. This generated a net one-off distortion of $228.9M (¥34,230M) in FY25 and $96.8M (¥14,481M) in FY24. Adding back these non-recurring items yields an Adjusted Operating Profit of $599.0M (¥89,589M) in FY24 and $560.2M (¥83,788M) in FY25, representing a manageable 6.5% true underlying contraction. Adjusted Profit Before Tax (PBT) shifted from $620.9M (¥92,876M) to $563.3M (¥84,253M). Applying Japan’s normalized 30.5% statutory tax rate against the artificially inflated 63.6% effective tax rate uncovers an Adjusted Net Income of $431.6M in FY24 and $391.5M in FY25, sharply contrasting the reported $368.9M and $121.7M.
Infrastructure Layout and Regional Moats
Geographically, the Americas division advanced 4.9% from $1,927.8M to $2,023.2M. The domestic Japanese baseline scaled 2.7% from $1,510.5M to $1,551.6M. The China segment contracted 0.2% from $1,218.0M to $1,215.2M, while Other Regions expanded 4.5% to $4,658.8M.
To fulfill this demand, Seiko Epson relies strictly on an internally controlled, asset-heavy supply chain architecture. Under an explicit "Closed Strategy," ultra-fine precision machining and 3rd-generation "PrecisionCore" and "Micro Piezo" printhead engineering are isolated within Japanese domestic hubs including Tohoku Epson, Akita Epson, and Miyazaki Epson. High-volume, non-proprietary assembly is routed through Southeast Asian megahubs, specifically P.T. Indonesia Epson Industry, Epson Precision (Philippines), Inc., and Singapore Epson Industrial. Greater China operations are heavily dependent on Epson Engineering (Shenzhen) Ltd. and Tianjin Epson Co., Ltd., while Taiwan, China operates as a trading node via Epson Taiwan Technology & Trading Ltd.
This vertical integration introduces severe Cash Conversion Cycle (CCC) bottlenecks. Between FY24 and FY25, the firm's CCC extended by 9.3 days, deteriorating from 145.1 days to 154.4 days.
* Trade Receivables: Expanded 14.7% from $1,404.6M (¥210,091M) to $1,611.5M (¥241,037M). Days Sales Outstanding (DSO) lengthened 6 days from 56.3 to 62.3.
* Inventory: Accumulated 6.8% ($166.8M buildup) from $2,472.3M (¥369,781M) to $2,639.1M (¥394,733M). Against a Cost of Goods Sold (COGS) base that shifted from $5,816.1M to $6,100.9M, Days Inventory Outstanding (DIO) expanded from 155.1 to 157.9.
* Trade Payables: Scaled marginally from $1,056.9M to $1,099.7M, pulling Days Payable Outstanding (DPO) down from 66.3 to 65.8.
The firm's capital commitments dictate rigid operational expenditures, reporting $166.6M (¥24,923M) in fixed purchase obligations in FY25, down from $211.6M (¥31,650M) in FY24. In response to carbon regulations, these localized hubs are bound to stringent ESG mandates, targeting a 90% reduction in absolute Scope 1 and 2 GHG emissions by 2030 against a 2017 baseline.
HDIN Institutional Verdict
Seiko Epson is leveraging its fortress balance sheet—boasting an Equity Ratio of 55.6%, a Total Equity base of $5,706.4M, Total Assets of $10,262.0M (Asset Turnover: 0.92x), and $1,929.4M (¥288,582M) in Cash and Cash Equivalents—to mask structural inefficiencies. The firm benefited from $561.3M (¥83,949M) in favorable foreign currency translation adjustments while total recognized provisions climbed from $215.5M (¥32,236M) to $225.5M (¥33,730M), alongside defined pension liabilities rising from $135.4M (¥20,254M) to $147.1M (¥22,005M).
Audited by Ernst & Young, the firm’s capital deployment reveals a stark misalignment between management's B2B rhetoric and actual R&D allocations. Out of a highly conservative $313.2M (¥46.8B) total FY25 R&D budget (a mere 3.3% of sales), the legacy Printing Solutions segment absorbed $152.1M (¥22.7B). The stagnating Visual Communications segment consumed $49.5M (¥7.3B). The designated industrial "Growth Engine" was allocated only $31.9M (¥4.7B). Core expensed R&D classified under SG&A contracted from $326.0M (¥48.7B) in FY24 to $300.8M (¥44.9B) in FY25, while capitalized intangible asset purchases rose 19.8% from $80.2M (¥11,990M) to $96.1M (¥14,376M). Depreciation and Amortization (D&A) added a 7.3% operational drag, expanding from $482.3M (¥72,142M) to $517.6M (¥77,417M). Asset impairments recorded $113.6M (¥16,985M) in FY24, shifting to $1.1M (¥165M) in direct impairments and $17.0M (¥2,546M) in improvement expenses in FY25.
To enforce competitive moats, Seiko Epson monetizes its 9,726 peak domestic patent filings (FY2006) using a "C-Curve" strategy and the Royalty Relief method. Patents are classified as either "BP-F (Fight)" or "BP-G (Guard)". Furthermore, cross-holdings are maintained in HP Inc., Xerox Corporation, Eastman Kodak Company, International Business Machines (IBM) Corporation, and Microsoft Corporation. The December 2024 acquisition of Fiery, LLC inserts unquantified goodwill integration risks into the upcoming IFRS 18 reporting transition.
Governance frameworks mathematically penalize this underperformance. The Audit & Supervisory Committee mandates CEO compensation at a 45% Base, 30% Bonus, and 25% Restricted Stock (RS) split. Short-term bonuses face a 0% to 200% multiplier linked to the 2.20% ROE print, while RS vesting demands 50% ROIC and 50% sustainability KPI achievement. Moving into the "Phase 1 Transform" and "Phase 2 Full-Scale Growth" windows, management projects $3,744.1M (¥560B) in OCF for FY26-FY28. This capital is rigidly bucketed: $1,337.2M (¥200B) to CapEx, $1,872.0M (¥280B) to growth (including $668.6M / ¥100B for open innovation/M&A), and $1,069.7M (¥160B) to shareholder returns. Payouts will split equally into $534.9M (¥80B) for dividends and $534.9M (¥80B) for share buybacks, building upon historical buybacks of $66.9M (¥10B) in FY19, $200.6M (¥30B) in FY22, and $200.6M (¥30B) in FY24, and sustaining a dividend structure that evolved from ¥62/share to ¥74/share (34% to 75% payout ratio, >3% DOE).
Presentation Download & Video Access:
- Presentation Download: Click the PDF download link under 'Related Topics' to access the full institutional presentation of this report.
- Video Link: Click this link to watch the HDIN analyst briefing on YouTube.
About HDIN Research:
HDIN Research is a premier global market intelligence and strategic advisory firm specializing in institutional-grade financial analysis, supply chain audits, and macroeconomic forecasting. Our dedicated sector analysts deliver actionable, data-driven insights tailored for private equity, hedge funds, and corporate strategy teams. Visit us at http://www.hdinresearch.com.
2026 AI Transparency Footer:
"This intelligence report was authored by HDIN Research analysts following a rigorous audit of official corporate filings. AI was utilized for massive-scale data synthesis and structural drafting, ensuring 100% inclusion of reported data points. All strategic insights, financial modeling, and final verdicts were verified by our editorial board to ensure professional accuracy and compliance with 2026 Google Search E-E-A-T standards."
* Seiko Epson Corporation [TYO: 6724] experienced a 67.0% year-over-year contraction in FY25 Net Income to $121.7M, obscured by a 157.9-day inventory holding period that artificially bloats the balance sheet with $2,639.1M in working capital.
* Geopolitical vulnerability is heavily concentrated across Southeast Asian and Greater China megahubs—including Tianjin Epson Co., Ltd. and Epson Precision (Philippines), Inc.—which manage 100% of the firm's non-domestic final assembly throughput.
* A massive 120% expansion in Other Operating Expenses to $278.9M indicates deliberate "kitchen-sinking" of legacy assets, mathematically suppressing the current 2.20% Return on Equity (ROE) to clear the runway for a $668.6M external M&A deployment strategy.
Figure SEIKO EPSON CORPORATION: STRATEGIC & FINANCIAL DEEP DIVE
Segmental Realities and Margin CompressionSeiko Epson’s operational architecture is executing a high-friction transition from its legacy B2C printing matrix toward industrial B2B automation. Against an aggregate top-line expansion of 3.7% to $9,448.9M (converted at the mandated rate of 1 USD = 149.5686 JPY), Gross Profit compressed to $3,348.0M, driving a Gross Margin contraction from 36.2% in FY24 to 35.4% in FY25. Selling, General, and Administrative (SG&A) expenses absorbed $2,787.8M of this yield. Total Operating Cash Flow (OCF), which peaked in FY23 at $1,107.0M (against Net Income of $351.8M), degraded from $923.1M in FY24 to $751.3M in FY25. Despite this, the OCF-to-Net Income ratio spiked from historical averages of 2.5x–3.1x to 6.2x in FY25, exposing extreme non-cash profitability drags.
The underlying structural decay is most visible in the Return on Equity (ROE), which collapsed sequentially from 15.17% (FY21), to 6.83% (FY24), landing at 2.20% in FY25. Return on Invested Capital (ROIC) printed at 5.5%, failing to clear standard technology hardware WACC assumptions of 7% to 9%. Return on Sales (ROS) degraded to 5.9%. Management’s "Epson 25 Renewed" strategy explicitly targeted 8.0% ROE, 7.0% ROIC, and 7.0% ROS, undershooting all primary metrics ahead of their revised FY28 "Transform" targets of 10.0% ROE, 8.0% ROIC, and 8.0% ROS.
Table Consolidated Segment Performance (FY24 to FY25)
| Segment | FY2024 Revenue | FY2025 Revenue | Revenue Growth | Operating Profit (FY2024 → FY2025) | OP Margin (FY2024 → FY2025) | Production Value Output | Key Takeaway |
|---|---|---|---|---|---|---|---|
| Printing Solutions (“Earnings Base”) | $6,552.7M | $6,883.0M | +5.0% | $834.7M → $806.1M | 12.7% → 11.7% | $6,883.0M (105.0% YoY) | Stable growth but margin compression |
| Visual Communications | $1,362.5M | $1,212.7M | -11.0% | $194.0M → $81.9M | 14.2% → 6.8% | $1,212.7M (89.0% YoY) | Sharp profitability deterioration |
| Manufacturing-Related & Wearables (“Growth Engine”) | $1,151.4M | $1,316.2M | +14.3% | $21.5M → $72.2M | 1.9% → 5.5% | $1,316.2M (114.3% YoY) | Strong growth and margin expansion |
The reported 34.0% contraction in consolidated Operating Profit—from $502.2M (¥75,108M) to $331.3M (¥49,558M)—is heavily distorted by accounting treatments. Management isolated core metrics via a structural "Business Profit" line. Other Operating Income injected $50.1M (¥7,486M) in FY25 versus $30.0M (¥4,494M) in FY24. Conversely, Other Operating Expenses absorbed $278.9M (¥41,717M) in FY25, up from $126.9M (¥18,975M) in FY24. This generated a net one-off distortion of $228.9M (¥34,230M) in FY25 and $96.8M (¥14,481M) in FY24. Adding back these non-recurring items yields an Adjusted Operating Profit of $599.0M (¥89,589M) in FY24 and $560.2M (¥83,788M) in FY25, representing a manageable 6.5% true underlying contraction. Adjusted Profit Before Tax (PBT) shifted from $620.9M (¥92,876M) to $563.3M (¥84,253M). Applying Japan’s normalized 30.5% statutory tax rate against the artificially inflated 63.6% effective tax rate uncovers an Adjusted Net Income of $431.6M in FY24 and $391.5M in FY25, sharply contrasting the reported $368.9M and $121.7M.
Infrastructure Layout and Regional Moats
Geographically, the Americas division advanced 4.9% from $1,927.8M to $2,023.2M. The domestic Japanese baseline scaled 2.7% from $1,510.5M to $1,551.6M. The China segment contracted 0.2% from $1,218.0M to $1,215.2M, while Other Regions expanded 4.5% to $4,658.8M.
To fulfill this demand, Seiko Epson relies strictly on an internally controlled, asset-heavy supply chain architecture. Under an explicit "Closed Strategy," ultra-fine precision machining and 3rd-generation "PrecisionCore" and "Micro Piezo" printhead engineering are isolated within Japanese domestic hubs including Tohoku Epson, Akita Epson, and Miyazaki Epson. High-volume, non-proprietary assembly is routed through Southeast Asian megahubs, specifically P.T. Indonesia Epson Industry, Epson Precision (Philippines), Inc., and Singapore Epson Industrial. Greater China operations are heavily dependent on Epson Engineering (Shenzhen) Ltd. and Tianjin Epson Co., Ltd., while Taiwan, China operates as a trading node via Epson Taiwan Technology & Trading Ltd.
This vertical integration introduces severe Cash Conversion Cycle (CCC) bottlenecks. Between FY24 and FY25, the firm's CCC extended by 9.3 days, deteriorating from 145.1 days to 154.4 days.
* Trade Receivables: Expanded 14.7% from $1,404.6M (¥210,091M) to $1,611.5M (¥241,037M). Days Sales Outstanding (DSO) lengthened 6 days from 56.3 to 62.3.
* Inventory: Accumulated 6.8% ($166.8M buildup) from $2,472.3M (¥369,781M) to $2,639.1M (¥394,733M). Against a Cost of Goods Sold (COGS) base that shifted from $5,816.1M to $6,100.9M, Days Inventory Outstanding (DIO) expanded from 155.1 to 157.9.
* Trade Payables: Scaled marginally from $1,056.9M to $1,099.7M, pulling Days Payable Outstanding (DPO) down from 66.3 to 65.8.
The firm's capital commitments dictate rigid operational expenditures, reporting $166.6M (¥24,923M) in fixed purchase obligations in FY25, down from $211.6M (¥31,650M) in FY24. In response to carbon regulations, these localized hubs are bound to stringent ESG mandates, targeting a 90% reduction in absolute Scope 1 and 2 GHG emissions by 2030 against a 2017 baseline.
HDIN Institutional Verdict
Seiko Epson is leveraging its fortress balance sheet—boasting an Equity Ratio of 55.6%, a Total Equity base of $5,706.4M, Total Assets of $10,262.0M (Asset Turnover: 0.92x), and $1,929.4M (¥288,582M) in Cash and Cash Equivalents—to mask structural inefficiencies. The firm benefited from $561.3M (¥83,949M) in favorable foreign currency translation adjustments while total recognized provisions climbed from $215.5M (¥32,236M) to $225.5M (¥33,730M), alongside defined pension liabilities rising from $135.4M (¥20,254M) to $147.1M (¥22,005M).
Audited by Ernst & Young, the firm’s capital deployment reveals a stark misalignment between management's B2B rhetoric and actual R&D allocations. Out of a highly conservative $313.2M (¥46.8B) total FY25 R&D budget (a mere 3.3% of sales), the legacy Printing Solutions segment absorbed $152.1M (¥22.7B). The stagnating Visual Communications segment consumed $49.5M (¥7.3B). The designated industrial "Growth Engine" was allocated only $31.9M (¥4.7B). Core expensed R&D classified under SG&A contracted from $326.0M (¥48.7B) in FY24 to $300.8M (¥44.9B) in FY25, while capitalized intangible asset purchases rose 19.8% from $80.2M (¥11,990M) to $96.1M (¥14,376M). Depreciation and Amortization (D&A) added a 7.3% operational drag, expanding from $482.3M (¥72,142M) to $517.6M (¥77,417M). Asset impairments recorded $113.6M (¥16,985M) in FY24, shifting to $1.1M (¥165M) in direct impairments and $17.0M (¥2,546M) in improvement expenses in FY25.
To enforce competitive moats, Seiko Epson monetizes its 9,726 peak domestic patent filings (FY2006) using a "C-Curve" strategy and the Royalty Relief method. Patents are classified as either "BP-F (Fight)" or "BP-G (Guard)". Furthermore, cross-holdings are maintained in HP Inc., Xerox Corporation, Eastman Kodak Company, International Business Machines (IBM) Corporation, and Microsoft Corporation. The December 2024 acquisition of Fiery, LLC inserts unquantified goodwill integration risks into the upcoming IFRS 18 reporting transition.
Governance frameworks mathematically penalize this underperformance. The Audit & Supervisory Committee mandates CEO compensation at a 45% Base, 30% Bonus, and 25% Restricted Stock (RS) split. Short-term bonuses face a 0% to 200% multiplier linked to the 2.20% ROE print, while RS vesting demands 50% ROIC and 50% sustainability KPI achievement. Moving into the "Phase 1 Transform" and "Phase 2 Full-Scale Growth" windows, management projects $3,744.1M (¥560B) in OCF for FY26-FY28. This capital is rigidly bucketed: $1,337.2M (¥200B) to CapEx, $1,872.0M (¥280B) to growth (including $668.6M / ¥100B for open innovation/M&A), and $1,069.7M (¥160B) to shareholder returns. Payouts will split equally into $534.9M (¥80B) for dividends and $534.9M (¥80B) for share buybacks, building upon historical buybacks of $66.9M (¥10B) in FY19, $200.6M (¥30B) in FY22, and $200.6M (¥30B) in FY24, and sustaining a dividend structure that evolved from ¥62/share to ¥74/share (34% to 75% payout ratio, >3% DOE).
Presentation Download & Video Access:
- Presentation Download: Click the PDF download link under 'Related Topics' to access the full institutional presentation of this report.
- Video Link: Click this link to watch the HDIN analyst briefing on YouTube.
About HDIN Research:
HDIN Research is a premier global market intelligence and strategic advisory firm specializing in institutional-grade financial analysis, supply chain audits, and macroeconomic forecasting. Our dedicated sector analysts deliver actionable, data-driven insights tailored for private equity, hedge funds, and corporate strategy teams. Visit us at http://www.hdinresearch.com.
2026 AI Transparency Footer:
"This intelligence report was authored by HDIN Research analysts following a rigorous audit of official corporate filings. AI was utilized for massive-scale data synthesis and structural drafting, ensuring 100% inclusion of reported data points. All strategic insights, financial modeling, and final verdicts were verified by our editorial board to ensure professional accuracy and compliance with 2026 Google Search E-E-A-T standards."