Central Glass: 27.0% Margin in Energy Materials Signals Structural Success of 2030 Portfolio Pivot Near Global Semiconductor Hubs
Date : 2026-07-04
Reading : 106
HDIN Executive Takeaways
* Central Glass Co., Ltd. realized a 27.0% operating margin in Energy Materials despite a 19.5% segmental revenue contraction, demonstrating absolute pricing power in the localized lithium-ion battery supply chain.
* Localized manufacturing networks in the Czech Republic and the United States successfully replaced divested European and North American legacy glass assets, aggressively hedging against geopolitical risk and carbon transition liabilities.
* Unadjusted operating cash flow expanded to $176.8 million, elevating the Earnings Quality Ratio to 2.02x and fully funding $83.24 million in shareholder distributions against $79.28 million in Free Cash Flow to Equity.
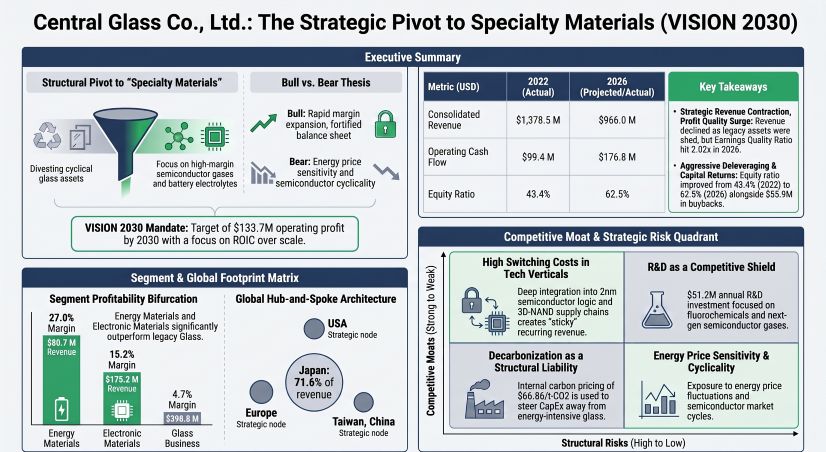
Figure Central Glass: The Strategic Pivot to Specialty Materials (VISlON 2030)
 Segmental Realities and Margin Compression
Central Glass Co., Ltd. [TSE: 4044] is executing a quantified portfolio pivot under its "VISION 2030" strategy, engineering a planned consolidated top-line contraction from $1,378.5 million (206,184 million JPY) in 2022 to $966.0 million (144,479 million JPY) in 2026, representing a 5-year CAGR of -8.5%. This deliberate shedding of commoditized volume allows the firm to optimize Return on Invested Capital (ROIC) by focusing on specialty chemical margins. Consolidated gross profit registered at $257.9 million (26.7% margin) in 2026, compared to a 27.3% margin in 2025. Reported consolidated operating profit compressed to $82.1 million (12,281 million JPY), down from $131.3 million (19,637 million JPY) in 2023. Core segmental operating profit landed at $67.1 million, generating a 6.9% operating margin, a 50 basis point contraction from 2025's 7.4% margin. Net income closed 2026 at $87.7 million (9.1% margin).
The underlying profitability gap validates capital reallocation away from the legacy Glass segment, which operates in direct competition with volume-scaled conglomerates like AGC Inc., Nippon Sheet Glass (NSG), and Fuyao Glass. In the high-margin electronic materials sector, the firm defends its niche against Daikin, Resonac, Merck, and Kanto Denka Kogyo by providing ArF excimer laser gases and 2nm Gate-All-Around logic inputs. For battery electrolytes, Central Glass battles Mitsubishi Chemical, Ube Industries, Capchem, and Tinci Materials via localized European supply rather than raw cost leadership.
Table FY2026 Operational Segment Revenue and Profitability Breakdown
The balance sheet reflects rigorous working capital discipline. Operating on a Cash Conversion Cycle (CCC) of 111 days, the firm manages $251.0 million in trade receivables (Days Sales Outstanding: 95 days) against $91.8 million in trade payables (Days Payable Outstanding: 47 days). Against a COGS baseline of $708.0 million, inventory stands at $122.3 million (Days Inventory Outstanding: 63 days).
A granular footnote audit reveals aggressive de-stocking protocols designed to mitigate silicon and EV cyclicality. Finished Goods contracted 11.5% from $95.29 million (14,252 million JPY) in 2025 to $84.37 million (12,619 million JPY) in 2026. Work in Progress was throttled down 28.8% from $17.11 million (2,559 million JPY) to $12.19 million (1,823 million JPY). Raw Materials & Supplies remained completely flat at $13.65 million (2,042 million JPY) versus $13.55 million (2,026 million JPY) in 2025.
Infrastructure Layout and Regional Moats
Central Glass Co., Ltd. systematically decoupled from Western architectural and automotive glass cyclicality during its 2022 divestiture wave, entirely exiting Central Glass Europe S.A., transferring equity in Cardinal CG Company, LLC, and selling North American automotive lines to Atlas Holdings LLC. This geographic realignment concentrates 71.6% of 2026 revenue ($692.1 million / 103,519 million JPY) in Japan. The United States captures 14.6% of revenue ($141.5 million / 21,167 million JPY), Asia ex-Japan delivers 8.0% ($77.6 million / 11,605 million JPY), and Other Regions, including Europe, account for 5.7% ($54.7 million / 8,187 million JPY). In total, 28.4% of consolidated revenue is generated outside of Japan.
The manufacturing architecture anchors R&D and core production within Japan through Central Glass Products, Central Chemical, and Japan Special Glass. To service critical nearshore mandates in the semiconductor and EV sectors, the firm operates SynQuest Laboratories, Inc. in the US and Central Glass Czech s.r.o. in the Czech Republic. Mainland China operations run through Zhejiang Zhongxiao Kangpeng Chemical Co., Ltd., while dedicated sales nodes in South Korea, Singapore, and Taiwan (China) complete the Asian ecosystem.
This infrastructure pivot acts as a direct hedge against escalating global carbon taxes. By removing energy-intensive overseas glass furnaces, the firm compressed its Scope 1 and Scope 2 Greenhouse Gas emissions from a 2013 baseline of 748,000 t-CO2 (Scope 1: 600,000; Scope 2: 148,000) to a provisional 306,000 t-CO2 in 2025 (Scope 1: 189,000; Scope 2: 117,000). To achieve the 2030 hard target of 299,000 t-CO2 (a 60% reduction), management deploys an Internal Carbon Price (ICP) of $66.86 (10,000 JPY) per t-CO2 to veto dirty asset expansion. Stress-testing against external models of $140/t-CO2 by 2030 implies a potential $41.86 million structural liability on 299,000 tons, scaling to $250/t-CO2 by 2050, mathematically forcing capital into eco-friendly SiC materials and specialty fluorochemicals.
HDIN Institutional Verdict
Central Glass Co., Ltd. is executing a textbook "kitchen-sinking" strategy, absorbing short-term accounting friction to permanently elevate cash conversion. Following peak Net Income of $238.2 million (35,629 million JPY) in 2022 and $239.6 million (35,839 million JPY) in 2023 driven by asset monetization, earnings normalized to $103.9 million in 2024 and $50.2 million in 2025 before settling at $87.7 million in 2026. The firm’s Earnings Quality Ratio (EQR) has shifted structurally from 0.42x in 2022 and 0.46x in 2023 to 1.43x in 2024, peaking at 3.14x in 2025, and stabilizing at 2.02x in 2026 on the back of $176.8 million (26,441 million JPY) in unadjusted operating cash flow.
This high EQR isolates core cash generation from management’s aggressive balance sheet purges. The firm recognized $43.5 million (6,510 million JPY) in fixed asset impairments in 2025, scaling to $78.7 million (11,765 million JPY) in 2026, totaling $122.2 million over 24 months. Concurrent business restructuring losses rose from $6.7 million (1,001 million JPY) in 2025 to $9.0 million (1,352 million JPY) in 2026. Conversely, Goodwill remained stable, adjusting slightly from $7.05 million (1,055 million JPY) to $10.85 million (1,623 million JPY). Contingent off-balance-sheet guarantees are suppressed below $2 million, and the singular material vulnerability—a defined benefit pension deficit—grew from $85.9 million (12,856 million JPY) in 2025 to $103.8 million (15,524 million JPY) in 2026, which is fully serviceable by current cash flows.
Total assets sit at $1,322.6 million, down from $1,943.5 million in 2022, structurally elevating the equity ratio from 43.4% to 62.5%. Return on Equity (ROE) normalized to 6.96% in 2026, recovering from 4.90% in 2025, but down from the 2023 divestiture-driven peak of 37.02%. To achieve the VISION 2030 ROE target of ≥10% and operating profit of $133.7 million (20,000 million JPY), or the intermediate 2027 Phase 1 target of 8.7% ROE, 6.1% ROIC, and $86.9 million (13,000 million JPY) in operating profit, execution speed is paramount.
Capital allocation is strictly optimized to support this mandate. Deducting $62.59 million (9,362 million JPY) in core PP&E CapEx from operating cash yields Free Cash Flow to the Firm (FCFF) of $114.19 million (17,079 million JPY). After executing $34.91 million (5,222 million JPY) in net debt paydowns, Free Cash Flow to Equity (FCFE) stands at $79.28 million (11,857 million JPY). Management utilized this exact liquidity to execute $83.24 million in shareholder distributions, comprising $27.35 million in dividends and $55.89 million (8,360 million JPY) in share buybacks (a jump from $28.7 million / 4,293 million JPY in 2025). The minor cash shortfall was effortlessly absorbed by the firm's $147.6 million (22,078 million JPY) cash reserve, yielding a final Free Cash Flow metric of $109.8 million after accounting for $67.0 million (10,027 million JPY) in total investing outflows. Dividends have progressively scaled from $0.50 (75 JPY) in 2022 to a secured floor of $1.14 (170 JPY) for 2026.
Forward-looking CapEx of $66.9 million (10,000 million JPY) targets high-margin nodes: Life & Healthcare ($20.7 million / 3,100 million JPY), Electronic Materials ($18.7 million / 2,800 million JPY), Energy Materials ($6.7 million / 1,000 million JPY), and restricted maintenance for Glass ($20.1 million / 3,000 million JPY). R&D is ring-fenced at $51.2 million (7,659 million JPY), establishing a 5.3% intensity ratio. To execute this R&D pipeline, Central Glass leverages a highly efficient parent-company workforce of 1,373 employees (out of 3,194 consolidated) boasting an average age of 37.1 years, a tenure of 15.2 years, and an average annual salary of $47,909 (7,165,636 JPY)—defying the demographic stagnation typical of Japanese heavy industry and securing the specialized engineering capital required for the next decade of semiconductor cycles.
Presentation Download & Video Access:
- Presentation Download: Click the PDF download link under 'Related Topics' to access the full institutional presentation of this report.
- Video Link: Click this link to watch the HDIN analyst briefing on YouTube.
About HDIN Research:
HDIN Research is a premier global market intelligence and strategic advisory firm specializing in institutional-grade financial analysis, supply chain audits, and macroeconomic forecasting. Our dedicated sector analysts deliver actionable, data-driven insights tailored for private equity, hedge funds, and corporate strategy teams. Visit us at http://www.hdinresearch.com.
*2026 AI Transparency Footer:*
"This intelligence report was authored by HDIN Research analysts following a rigorous audit of official corporate filings. AI was utilized for massive-scale data synthesis and structural drafting, ensuring 100% inclusion of reported data points. All strategic insights, financial modeling, and final verdicts were verified by our editorial board to ensure professional accuracy and compliance with 2026 Google Search E-E-A-T standards."
* Central Glass Co., Ltd. realized a 27.0% operating margin in Energy Materials despite a 19.5% segmental revenue contraction, demonstrating absolute pricing power in the localized lithium-ion battery supply chain.
* Localized manufacturing networks in the Czech Republic and the United States successfully replaced divested European and North American legacy glass assets, aggressively hedging against geopolitical risk and carbon transition liabilities.
* Unadjusted operating cash flow expanded to $176.8 million, elevating the Earnings Quality Ratio to 2.02x and fully funding $83.24 million in shareholder distributions against $79.28 million in Free Cash Flow to Equity.
Figure Central Glass: The Strategic Pivot to Specialty Materials (VISlON 2030)
Segmental Realities and Margin CompressionCentral Glass Co., Ltd. [TSE: 4044] is executing a quantified portfolio pivot under its "VISION 2030" strategy, engineering a planned consolidated top-line contraction from $1,378.5 million (206,184 million JPY) in 2022 to $966.0 million (144,479 million JPY) in 2026, representing a 5-year CAGR of -8.5%. This deliberate shedding of commoditized volume allows the firm to optimize Return on Invested Capital (ROIC) by focusing on specialty chemical margins. Consolidated gross profit registered at $257.9 million (26.7% margin) in 2026, compared to a 27.3% margin in 2025. Reported consolidated operating profit compressed to $82.1 million (12,281 million JPY), down from $131.3 million (19,637 million JPY) in 2023. Core segmental operating profit landed at $67.1 million, generating a 6.9% operating margin, a 50 basis point contraction from 2025's 7.4% margin. Net income closed 2026 at $87.7 million (9.1% margin).
The underlying profitability gap validates capital reallocation away from the legacy Glass segment, which operates in direct competition with volume-scaled conglomerates like AGC Inc., Nippon Sheet Glass (NSG), and Fuyao Glass. In the high-margin electronic materials sector, the firm defends its niche against Daikin, Resonac, Merck, and Kanto Denka Kogyo by providing ArF excimer laser gases and 2nm Gate-All-Around logic inputs. For battery electrolytes, Central Glass battles Mitsubishi Chemical, Ube Industries, Capchem, and Tinci Materials via localized European supply rather than raw cost leadership.
Table FY2026 Operational Segment Revenue and Profitability Breakdown
| Operational Segment | 2026 Revenue (USD / JPY) | YoY Revenue | 2026 Operating Profit (USD / JPY) | Margin |
|---|---|---|---|---|
| Electronic Materials | $175.2M / 26,202M JPY | +8.1% (from $162.0M) | $26.7M / 3,986M JPY | 15.2% |
| Energy Materials | $80.7M / 12,070M JPY | -19.5% (from $100.3M) | $21.8M / 3,264M JPY | 27.0% |
| Life & Healthcare | $274.3M / 41,024M JPY | -2.9% | $41.3M / 6,170M JPY | 15.0% |
| Glass Business | $398.8M / 59,640M JPY | +2.0% | $18.8M / 2,810M JPY | 4.7% |
The balance sheet reflects rigorous working capital discipline. Operating on a Cash Conversion Cycle (CCC) of 111 days, the firm manages $251.0 million in trade receivables (Days Sales Outstanding: 95 days) against $91.8 million in trade payables (Days Payable Outstanding: 47 days). Against a COGS baseline of $708.0 million, inventory stands at $122.3 million (Days Inventory Outstanding: 63 days).
A granular footnote audit reveals aggressive de-stocking protocols designed to mitigate silicon and EV cyclicality. Finished Goods contracted 11.5% from $95.29 million (14,252 million JPY) in 2025 to $84.37 million (12,619 million JPY) in 2026. Work in Progress was throttled down 28.8% from $17.11 million (2,559 million JPY) to $12.19 million (1,823 million JPY). Raw Materials & Supplies remained completely flat at $13.65 million (2,042 million JPY) versus $13.55 million (2,026 million JPY) in 2025.
Infrastructure Layout and Regional Moats
Central Glass Co., Ltd. systematically decoupled from Western architectural and automotive glass cyclicality during its 2022 divestiture wave, entirely exiting Central Glass Europe S.A., transferring equity in Cardinal CG Company, LLC, and selling North American automotive lines to Atlas Holdings LLC. This geographic realignment concentrates 71.6% of 2026 revenue ($692.1 million / 103,519 million JPY) in Japan. The United States captures 14.6% of revenue ($141.5 million / 21,167 million JPY), Asia ex-Japan delivers 8.0% ($77.6 million / 11,605 million JPY), and Other Regions, including Europe, account for 5.7% ($54.7 million / 8,187 million JPY). In total, 28.4% of consolidated revenue is generated outside of Japan.
The manufacturing architecture anchors R&D and core production within Japan through Central Glass Products, Central Chemical, and Japan Special Glass. To service critical nearshore mandates in the semiconductor and EV sectors, the firm operates SynQuest Laboratories, Inc. in the US and Central Glass Czech s.r.o. in the Czech Republic. Mainland China operations run through Zhejiang Zhongxiao Kangpeng Chemical Co., Ltd., while dedicated sales nodes in South Korea, Singapore, and Taiwan (China) complete the Asian ecosystem.
This infrastructure pivot acts as a direct hedge against escalating global carbon taxes. By removing energy-intensive overseas glass furnaces, the firm compressed its Scope 1 and Scope 2 Greenhouse Gas emissions from a 2013 baseline of 748,000 t-CO2 (Scope 1: 600,000; Scope 2: 148,000) to a provisional 306,000 t-CO2 in 2025 (Scope 1: 189,000; Scope 2: 117,000). To achieve the 2030 hard target of 299,000 t-CO2 (a 60% reduction), management deploys an Internal Carbon Price (ICP) of $66.86 (10,000 JPY) per t-CO2 to veto dirty asset expansion. Stress-testing against external models of $140/t-CO2 by 2030 implies a potential $41.86 million structural liability on 299,000 tons, scaling to $250/t-CO2 by 2050, mathematically forcing capital into eco-friendly SiC materials and specialty fluorochemicals.
HDIN Institutional Verdict
Central Glass Co., Ltd. is executing a textbook "kitchen-sinking" strategy, absorbing short-term accounting friction to permanently elevate cash conversion. Following peak Net Income of $238.2 million (35,629 million JPY) in 2022 and $239.6 million (35,839 million JPY) in 2023 driven by asset monetization, earnings normalized to $103.9 million in 2024 and $50.2 million in 2025 before settling at $87.7 million in 2026. The firm’s Earnings Quality Ratio (EQR) has shifted structurally from 0.42x in 2022 and 0.46x in 2023 to 1.43x in 2024, peaking at 3.14x in 2025, and stabilizing at 2.02x in 2026 on the back of $176.8 million (26,441 million JPY) in unadjusted operating cash flow.
This high EQR isolates core cash generation from management’s aggressive balance sheet purges. The firm recognized $43.5 million (6,510 million JPY) in fixed asset impairments in 2025, scaling to $78.7 million (11,765 million JPY) in 2026, totaling $122.2 million over 24 months. Concurrent business restructuring losses rose from $6.7 million (1,001 million JPY) in 2025 to $9.0 million (1,352 million JPY) in 2026. Conversely, Goodwill remained stable, adjusting slightly from $7.05 million (1,055 million JPY) to $10.85 million (1,623 million JPY). Contingent off-balance-sheet guarantees are suppressed below $2 million, and the singular material vulnerability—a defined benefit pension deficit—grew from $85.9 million (12,856 million JPY) in 2025 to $103.8 million (15,524 million JPY) in 2026, which is fully serviceable by current cash flows.
Total assets sit at $1,322.6 million, down from $1,943.5 million in 2022, structurally elevating the equity ratio from 43.4% to 62.5%. Return on Equity (ROE) normalized to 6.96% in 2026, recovering from 4.90% in 2025, but down from the 2023 divestiture-driven peak of 37.02%. To achieve the VISION 2030 ROE target of ≥10% and operating profit of $133.7 million (20,000 million JPY), or the intermediate 2027 Phase 1 target of 8.7% ROE, 6.1% ROIC, and $86.9 million (13,000 million JPY) in operating profit, execution speed is paramount.
Capital allocation is strictly optimized to support this mandate. Deducting $62.59 million (9,362 million JPY) in core PP&E CapEx from operating cash yields Free Cash Flow to the Firm (FCFF) of $114.19 million (17,079 million JPY). After executing $34.91 million (5,222 million JPY) in net debt paydowns, Free Cash Flow to Equity (FCFE) stands at $79.28 million (11,857 million JPY). Management utilized this exact liquidity to execute $83.24 million in shareholder distributions, comprising $27.35 million in dividends and $55.89 million (8,360 million JPY) in share buybacks (a jump from $28.7 million / 4,293 million JPY in 2025). The minor cash shortfall was effortlessly absorbed by the firm's $147.6 million (22,078 million JPY) cash reserve, yielding a final Free Cash Flow metric of $109.8 million after accounting for $67.0 million (10,027 million JPY) in total investing outflows. Dividends have progressively scaled from $0.50 (75 JPY) in 2022 to a secured floor of $1.14 (170 JPY) for 2026.
Forward-looking CapEx of $66.9 million (10,000 million JPY) targets high-margin nodes: Life & Healthcare ($20.7 million / 3,100 million JPY), Electronic Materials ($18.7 million / 2,800 million JPY), Energy Materials ($6.7 million / 1,000 million JPY), and restricted maintenance for Glass ($20.1 million / 3,000 million JPY). R&D is ring-fenced at $51.2 million (7,659 million JPY), establishing a 5.3% intensity ratio. To execute this R&D pipeline, Central Glass leverages a highly efficient parent-company workforce of 1,373 employees (out of 3,194 consolidated) boasting an average age of 37.1 years, a tenure of 15.2 years, and an average annual salary of $47,909 (7,165,636 JPY)—defying the demographic stagnation typical of Japanese heavy industry and securing the specialized engineering capital required for the next decade of semiconductor cycles.
Presentation Download & Video Access:
- Presentation Download: Click the PDF download link under 'Related Topics' to access the full institutional presentation of this report.
- Video Link: Click this link to watch the HDIN analyst briefing on YouTube.
About HDIN Research:
HDIN Research is a premier global market intelligence and strategic advisory firm specializing in institutional-grade financial analysis, supply chain audits, and macroeconomic forecasting. Our dedicated sector analysts deliver actionable, data-driven insights tailored for private equity, hedge funds, and corporate strategy teams. Visit us at http://www.hdinresearch.com.
*2026 AI Transparency Footer:*
"This intelligence report was authored by HDIN Research analysts following a rigorous audit of official corporate filings. AI was utilized for massive-scale data synthesis and structural drafting, ensuring 100% inclusion of reported data points. All strategic insights, financial modeling, and final verdicts were verified by our editorial board to ensure professional accuracy and compliance with 2026 Google Search E-E-A-T standards."