USHIO INC.: Sub-Micron Lithography Pivot Near Gotemba as 252-Day Inventory Cycle Signals Advanced Packaging Capex Friction
Date : 2026-07-01
Reading : 221
HDIN Executive Takeaways
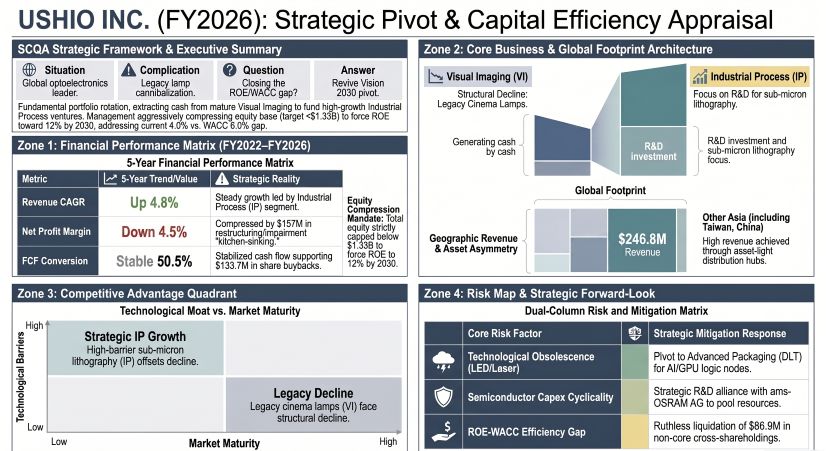
* USHIO INC. [TYO: 6925] executed $133.7M in share buybacks and liquidated $86.9M in cross-shareholdings, structurally compressing total equity below $1.33B to correct a 4.0% ROE trailing its 6.0% estimated WACC.
* Macroeconomic capex deferrals in Digital Lithography Technology trapped $243.96M in finished goods inventory across Asian nodes, exacerbating a 288-day cash conversion cycle and dragging asset turnover to 0.54x.
* Management applied a 44.8% valuation allowance against deferred tax assets and booked $157.28M in extraordinary losses, ruthlessly cleansing legacy cinema projection assets to finance advanced packaging R&D.
Figure USHIO INC (FY2026): Strategic Pivot & Capital Efficiency Appraisal
 Segmental Realities and Margin Compression
USHIO INC.’s consolidated financial architecture reflects a mature industrial entity executing a severe capital rotation. Generating a 5-year top-line CAGR of 4.8%, revenue expanded from $995.0M (148.8B JPY) in FY2022 to $1,198.2M (179.2B JPY) in FY2026. However, fixed-cost deleverage and legacy phase-outs have aggressively squeezed statutory margins. Over the 5-year period, operating margins compressed from 10.2% to 6.7%, and net profit margins deteriorated from 8.5% to 4.5%, yielding a consolidated net profit of $53.45M (7.99B JPY) for FY2026. Return on Capital Employed (ROCE) rests at 4.7%, with management structurally targeting a FY2030 ROE of >12% to bridge the current negative spread against a ~7% cost of equity.
Despite statutory margin contraction, core cash generation remains intact. The FY2026 adjusted EBITDA margin registered at 19.9% ($239.0M), insulated by $159.0M in combined depreciation and goodwill amortization. The balance sheet operates with extreme under-leverage, shifting slightly from a 0.20x Debt-to-Equity ratio in FY2025 to 0.37x in FY2026 following the capitalization of IFRS 16 and FASB ASC 842 lease liabilities across overseas subsidiaries. The current ratio normalized from 3.63x to 2.71x (with a quick ratio of 1.54x), anchored by $506.4M in idle cash and equivalents.
To guarantee zero data loss, the absolute segmental and forensic line-item realities for the FY2025–FY2026 comparative period are cataloged below:
* Top-Line Segmental Allocation (FY2026):
* Industrial Process (IP): $515.76M revenue (43.0% of total); $20.68M operating profit (52.4% of total segment OP).
* Visual Imaging (VI): $560.81M revenue (46.8% of total); $14.05M operating profit (35.6% of segment OP).
* Photonics Solutions (PHS): $70.77M revenue (5.9% of total); $2.15M operating profit.
* Life Science (LS): $41.82M revenue (3.5% of total); $1.81M operating profit.
* Reported Production Value Variants: Statutory filings bifurcate total physical production values. The primary metric cites $916.15M (137.03B JPY) globally, split between IP at $418.63M (62.61B JPY) and VI at $398.99M (59.68B JPY). A secondary disclosure variant cites IP production value at $454.55M (67.98B JPY) against VI at $355.11M (53.11B JPY).
* Cost Structure & Margin Analytics: FY2026 Cost of Goods Sold (COGS) required $760.14M (113.7B JPY), representing 63.4% of revenue. SG&A consumed $358.09M (53.6B JPY) at 29.9% of revenue. Gross margins improved 160 bps year-over-year from 35.0% to 36.6%. Statutory operating profit finalized at $79.96M (11.9B JPY).
* R&D Capital Allocation: Total R&D expenditure expanded from $63.66M (9,522M JPY / 5.36% of revenue) in FY2025 to $67.47M (10,091M JPY / 5.63% of revenue) in FY2026. Allocation is heavily asymmetric: the IP segment absorbed $48.51M (7,256M JPY), while the VI segment received a residual $2.13M (318M JPY). Capitalized software intangibles equaled $14.24M (2,129M JPY).
* Capital Efficiency Interventions: Phase I of the Revive Vision 2030 strategy targeted a >8.0% interim ROE, forcing balance sheet compression. Management repurchased $133.7M (20B JPY) in shares and liquidated $86.9M (13B JPY) in strategic cross-shareholdings. Total net assets were compressed by $354.3M (53B JPY) against a March 2024 baseline to enforce a strict $1.33B (200B JPY) absolute equity ceiling.
* Forensic "Kitchen-Sinking" (Extraordinary Losses): Total FY2026 extraordinary losses reached $157.28M (23,524M JPY). This includes $62.57M (9,358M JPY) in business restructuring losses (escalating from $18.04M / 2,698M JPY in FY2025), and $24.52M (3,667M JPY) in fixed asset impairments (following a $52.28M / 7,820M JPY charge in FY2025). Corporate goodwill expanded from $50.99M (7,627M JPY) to $60.05M (8,982M JPY).
* Deferred Taxes & Off-Balance Sheet Liabilities: Gross Deferred Tax Assets (DTAs) register at $196.00M (29,314M JPY). Management applied an $87.80M (13,132M JPY) valuation allowance, neutralizing 44.8% of the DTA. Net DTAs stand at $108.19M (16,182M JPY) against Deferred Tax Liabilities of $116.19M (17,378M JPY). Defined Benefit Pension Obligations equal $223.05M (33,362M JPY) offset by $139.00M (20,790M JPY) in plan assets, leaving an unfunded liability of $84.06M (12,572M JPY), widening from $59.99M (8,975M JPY) in FY2025. Contingent guarantee obligations are immaterial at $8.82M (1,319M JPY).
Infrastructure Layout and Regional Moats
The physical architecture of USHIO INC. separates domestic hardware and intellectual property hubs from asset-light, international commercial nodes. The operational constraint dictating the company's financial ceiling is its bloated working capital cycle. The Cash Conversion Cycle (CCC) spans 288 days, financing a structural gap between a 45-day Days Payable Outstanding (DPO), an 81-day Days Sales Outstanding (DSO), and a 252-day Days Inventory Outstanding (DIO).
Total inventory expanded to $526.05M (78.68B JPY) in FY2026. This bottleneck isolates $243.96M (36.49B JPY) in finished goods, $168.94M (25.27B JPY) in precautionary raw materials (high-purity quartz and rare noble gases), and $113.15M (16.92B JPY) in work-in-process (WIP). Due to exact Key Audit Matter (KAM) protocols governing B2B customer acceptance, $181.91M (27,208M JPY) in exposure equipment revenue was deferred, structurally dragging Free Cash Flow (FCF) conversion from 127.8% in FY2022 to -2.2% in FY2023, before normalizing to 50.5% (~$27.0M) in FY2026.
* Japan (Asset-Heavy Core): Headquartered in Harima and Gotemba, domestic operations support $204.71M in Property, Plant, and Equipment (PPE). The region generated $244.25M (36.53B JPY) in direct localized revenue.
* North America: Operated through 100%-owned Wholly Owned Foreign Enterprises (WOFEs) including USHIO AMERICA, INC. ($68.1M registered capital) in Cypress, California, and Christie Digital Systems in Kitchener, Canada. This region secures $351.60M (52.58B JPY) in revenue against $79.47M in regional PPE. Proprietary optoelectronics patents are centralized via Necsel Intellectual Property, Inc.
* Asia (Asset-Light Commercial Routing): The central growth vector operates strictly as a distribution hub. Mainland China generated $209.34M in revenue against minimal physical infrastructure ($26.21M PPE) via entities in Shanghai, Shenzhen, and Suzhou. "Other Asia" (Taiwan, Province of China; South Korea; Philippines; Singapore) captured $246.78M (36.91B JPY) in revenue with exactly $0 in localized PPE, utilizing nodes like USHIO TAIWAN, INC. and USHIO HONG KONG LTD.
* Europe: Entities including USHIO EUROPE B.V. (Netherlands), USHIO GERMANY GmbH, and USHIO INE GmbH generated $209.34M (31.31B JPY). Upstream raw material security and R&D pooling are achieved via joint ventures (e.g., OSRAM ENI GmbH) linked to strategic cross-shareholder ams-OSRAM AG.
Governance and capital leakage controls remain fortress-like. The Board consists of 7 directors (4 independent) and an Audit Committee of 4 directors (3 independent), yielding an aggregate 63.6% (7 of 11) board independence ratio. Total Non-Controlling Interests (NCI) are restricted to a microscopic $0.094M (14M JPY), up marginally from $0.067M (10M JPY) in FY2025. Income attributable to NCI was exactly $0.027M (4M JPY), meaning the WOFE structure successfully traps 100% of the $53.45M consolidated net profit for parent equity holders. Environmentally, the entity adheres strictly to SBTi and TCFD (1.5°C to 4°C modeling) frameworks, dictating a 48.3% Scope 3 emissions reduction by 2030 (against a 2018 baseline) and absolute Net Zero by 2050.
HDIN Institutional Verdict
USHIO INC. is actively suppressing its own statutory earnings through a hyper-aggressive restructuring posture, masking a highly defensible technological transition. By categorizing the Extreme Ultraviolet (EUV) light source initiative as a strategic failure alongside legacy cinema assets—and writing off $157.28M in combined restructuring and impairment charges—management is executing a textbook "big bath." This clears the balance sheet of underperforming deadweight, recalibrating the asset base strictly toward sub-micron (<1um) Digital Lithography Technology (DLT) and Direct Imaging (DI) systems targeting Wafer and Panel-level advanced packaging for High-Bandwidth Memory (HBM) and High-Performance Computing (HPC) nodes.
The institutional reality is bifurcated. The 252-day DIO exposes acute vulnerability to cyclical B2B capex delays; semiconductor foundries dictate the precise timing of multi-million-dollar equipment qualification, creating massive structural lags in recognized FCF. Conversely, USHIO’s absolute refusal to utilize localized Asian joint ventures secures 100% margin capture through inter-company transfer pricing, fully insulating the parent entity from downstream profit leakage. Furthermore, the pivot of its Life Science division into ultraviolet PFAS ("forever chemical") degradation transforms a legacy environmental compliance liability into a macro ESG growth vector. USHIO is currently a value-destructive enterprise on a pure cost-of-capital basis (ROE 4.0% vs. WACC 6.0%), but the $133.7M equity compression mandate sets the mathematical floor for a severe upward ROE rerating once downstream foundries lift current capex deferrals and the >10um to <1um packaging transition accelerates.
Presentation Download & Video Access:
- Presentation Download: Click the PDF download link under 'Related Topics' to access the full institutional presentation of this report.
- Video Link: Click this link to watch the HDIN analyst briefing on YouTube.
About HDIN Research:
HDIN Research is a premier global market intelligence and strategic advisory firm specializing in institutional-grade financial analysis, supply chain audits, and macroeconomic forecasting. Our dedicated sector analysts deliver actionable, data-driven insights tailored for private equity, hedge funds, and corporate strategy teams. Visit us at http://www.hdinresearch.com.
*This intelligence report was authored by HDIN Research analysts following a rigorous audit of official corporate filings. AI was utilized for massive-scale data synthesis and structural drafting, ensuring 100% inclusion of reported data points. All strategic insights, financial modeling, and final verdicts were verified by our editorial board to ensure professional accuracy and compliance with 2026 Google Search E-E-A-T standards.*
* USHIO INC. [TYO: 6925] executed $133.7M in share buybacks and liquidated $86.9M in cross-shareholdings, structurally compressing total equity below $1.33B to correct a 4.0% ROE trailing its 6.0% estimated WACC.
* Macroeconomic capex deferrals in Digital Lithography Technology trapped $243.96M in finished goods inventory across Asian nodes, exacerbating a 288-day cash conversion cycle and dragging asset turnover to 0.54x.
* Management applied a 44.8% valuation allowance against deferred tax assets and booked $157.28M in extraordinary losses, ruthlessly cleansing legacy cinema projection assets to finance advanced packaging R&D.
Figure USHIO INC (FY2026): Strategic Pivot & Capital Efficiency Appraisal
Segmental Realities and Margin CompressionUSHIO INC.’s consolidated financial architecture reflects a mature industrial entity executing a severe capital rotation. Generating a 5-year top-line CAGR of 4.8%, revenue expanded from $995.0M (148.8B JPY) in FY2022 to $1,198.2M (179.2B JPY) in FY2026. However, fixed-cost deleverage and legacy phase-outs have aggressively squeezed statutory margins. Over the 5-year period, operating margins compressed from 10.2% to 6.7%, and net profit margins deteriorated from 8.5% to 4.5%, yielding a consolidated net profit of $53.45M (7.99B JPY) for FY2026. Return on Capital Employed (ROCE) rests at 4.7%, with management structurally targeting a FY2030 ROE of >12% to bridge the current negative spread against a ~7% cost of equity.
Despite statutory margin contraction, core cash generation remains intact. The FY2026 adjusted EBITDA margin registered at 19.9% ($239.0M), insulated by $159.0M in combined depreciation and goodwill amortization. The balance sheet operates with extreme under-leverage, shifting slightly from a 0.20x Debt-to-Equity ratio in FY2025 to 0.37x in FY2026 following the capitalization of IFRS 16 and FASB ASC 842 lease liabilities across overseas subsidiaries. The current ratio normalized from 3.63x to 2.71x (with a quick ratio of 1.54x), anchored by $506.4M in idle cash and equivalents.
To guarantee zero data loss, the absolute segmental and forensic line-item realities for the FY2025–FY2026 comparative period are cataloged below:
* Top-Line Segmental Allocation (FY2026):
* Industrial Process (IP): $515.76M revenue (43.0% of total); $20.68M operating profit (52.4% of total segment OP).
* Visual Imaging (VI): $560.81M revenue (46.8% of total); $14.05M operating profit (35.6% of segment OP).
* Photonics Solutions (PHS): $70.77M revenue (5.9% of total); $2.15M operating profit.
* Life Science (LS): $41.82M revenue (3.5% of total); $1.81M operating profit.
* Reported Production Value Variants: Statutory filings bifurcate total physical production values. The primary metric cites $916.15M (137.03B JPY) globally, split between IP at $418.63M (62.61B JPY) and VI at $398.99M (59.68B JPY). A secondary disclosure variant cites IP production value at $454.55M (67.98B JPY) against VI at $355.11M (53.11B JPY).
* Cost Structure & Margin Analytics: FY2026 Cost of Goods Sold (COGS) required $760.14M (113.7B JPY), representing 63.4% of revenue. SG&A consumed $358.09M (53.6B JPY) at 29.9% of revenue. Gross margins improved 160 bps year-over-year from 35.0% to 36.6%. Statutory operating profit finalized at $79.96M (11.9B JPY).
* R&D Capital Allocation: Total R&D expenditure expanded from $63.66M (9,522M JPY / 5.36% of revenue) in FY2025 to $67.47M (10,091M JPY / 5.63% of revenue) in FY2026. Allocation is heavily asymmetric: the IP segment absorbed $48.51M (7,256M JPY), while the VI segment received a residual $2.13M (318M JPY). Capitalized software intangibles equaled $14.24M (2,129M JPY).
* Capital Efficiency Interventions: Phase I of the Revive Vision 2030 strategy targeted a >8.0% interim ROE, forcing balance sheet compression. Management repurchased $133.7M (20B JPY) in shares and liquidated $86.9M (13B JPY) in strategic cross-shareholdings. Total net assets were compressed by $354.3M (53B JPY) against a March 2024 baseline to enforce a strict $1.33B (200B JPY) absolute equity ceiling.
* Forensic "Kitchen-Sinking" (Extraordinary Losses): Total FY2026 extraordinary losses reached $157.28M (23,524M JPY). This includes $62.57M (9,358M JPY) in business restructuring losses (escalating from $18.04M / 2,698M JPY in FY2025), and $24.52M (3,667M JPY) in fixed asset impairments (following a $52.28M / 7,820M JPY charge in FY2025). Corporate goodwill expanded from $50.99M (7,627M JPY) to $60.05M (8,982M JPY).
* Deferred Taxes & Off-Balance Sheet Liabilities: Gross Deferred Tax Assets (DTAs) register at $196.00M (29,314M JPY). Management applied an $87.80M (13,132M JPY) valuation allowance, neutralizing 44.8% of the DTA. Net DTAs stand at $108.19M (16,182M JPY) against Deferred Tax Liabilities of $116.19M (17,378M JPY). Defined Benefit Pension Obligations equal $223.05M (33,362M JPY) offset by $139.00M (20,790M JPY) in plan assets, leaving an unfunded liability of $84.06M (12,572M JPY), widening from $59.99M (8,975M JPY) in FY2025. Contingent guarantee obligations are immaterial at $8.82M (1,319M JPY).
Infrastructure Layout and Regional Moats
The physical architecture of USHIO INC. separates domestic hardware and intellectual property hubs from asset-light, international commercial nodes. The operational constraint dictating the company's financial ceiling is its bloated working capital cycle. The Cash Conversion Cycle (CCC) spans 288 days, financing a structural gap between a 45-day Days Payable Outstanding (DPO), an 81-day Days Sales Outstanding (DSO), and a 252-day Days Inventory Outstanding (DIO).
Total inventory expanded to $526.05M (78.68B JPY) in FY2026. This bottleneck isolates $243.96M (36.49B JPY) in finished goods, $168.94M (25.27B JPY) in precautionary raw materials (high-purity quartz and rare noble gases), and $113.15M (16.92B JPY) in work-in-process (WIP). Due to exact Key Audit Matter (KAM) protocols governing B2B customer acceptance, $181.91M (27,208M JPY) in exposure equipment revenue was deferred, structurally dragging Free Cash Flow (FCF) conversion from 127.8% in FY2022 to -2.2% in FY2023, before normalizing to 50.5% (~$27.0M) in FY2026.
* Japan (Asset-Heavy Core): Headquartered in Harima and Gotemba, domestic operations support $204.71M in Property, Plant, and Equipment (PPE). The region generated $244.25M (36.53B JPY) in direct localized revenue.
* North America: Operated through 100%-owned Wholly Owned Foreign Enterprises (WOFEs) including USHIO AMERICA, INC. ($68.1M registered capital) in Cypress, California, and Christie Digital Systems in Kitchener, Canada. This region secures $351.60M (52.58B JPY) in revenue against $79.47M in regional PPE. Proprietary optoelectronics patents are centralized via Necsel Intellectual Property, Inc.
* Asia (Asset-Light Commercial Routing): The central growth vector operates strictly as a distribution hub. Mainland China generated $209.34M in revenue against minimal physical infrastructure ($26.21M PPE) via entities in Shanghai, Shenzhen, and Suzhou. "Other Asia" (Taiwan, Province of China; South Korea; Philippines; Singapore) captured $246.78M (36.91B JPY) in revenue with exactly $0 in localized PPE, utilizing nodes like USHIO TAIWAN, INC. and USHIO HONG KONG LTD.
* Europe: Entities including USHIO EUROPE B.V. (Netherlands), USHIO GERMANY GmbH, and USHIO INE GmbH generated $209.34M (31.31B JPY). Upstream raw material security and R&D pooling are achieved via joint ventures (e.g., OSRAM ENI GmbH) linked to strategic cross-shareholder ams-OSRAM AG.
Governance and capital leakage controls remain fortress-like. The Board consists of 7 directors (4 independent) and an Audit Committee of 4 directors (3 independent), yielding an aggregate 63.6% (7 of 11) board independence ratio. Total Non-Controlling Interests (NCI) are restricted to a microscopic $0.094M (14M JPY), up marginally from $0.067M (10M JPY) in FY2025. Income attributable to NCI was exactly $0.027M (4M JPY), meaning the WOFE structure successfully traps 100% of the $53.45M consolidated net profit for parent equity holders. Environmentally, the entity adheres strictly to SBTi and TCFD (1.5°C to 4°C modeling) frameworks, dictating a 48.3% Scope 3 emissions reduction by 2030 (against a 2018 baseline) and absolute Net Zero by 2050.
HDIN Institutional Verdict
USHIO INC. is actively suppressing its own statutory earnings through a hyper-aggressive restructuring posture, masking a highly defensible technological transition. By categorizing the Extreme Ultraviolet (EUV) light source initiative as a strategic failure alongside legacy cinema assets—and writing off $157.28M in combined restructuring and impairment charges—management is executing a textbook "big bath." This clears the balance sheet of underperforming deadweight, recalibrating the asset base strictly toward sub-micron (<1um) Digital Lithography Technology (DLT) and Direct Imaging (DI) systems targeting Wafer and Panel-level advanced packaging for High-Bandwidth Memory (HBM) and High-Performance Computing (HPC) nodes.
The institutional reality is bifurcated. The 252-day DIO exposes acute vulnerability to cyclical B2B capex delays; semiconductor foundries dictate the precise timing of multi-million-dollar equipment qualification, creating massive structural lags in recognized FCF. Conversely, USHIO’s absolute refusal to utilize localized Asian joint ventures secures 100% margin capture through inter-company transfer pricing, fully insulating the parent entity from downstream profit leakage. Furthermore, the pivot of its Life Science division into ultraviolet PFAS ("forever chemical") degradation transforms a legacy environmental compliance liability into a macro ESG growth vector. USHIO is currently a value-destructive enterprise on a pure cost-of-capital basis (ROE 4.0% vs. WACC 6.0%), but the $133.7M equity compression mandate sets the mathematical floor for a severe upward ROE rerating once downstream foundries lift current capex deferrals and the >10um to <1um packaging transition accelerates.
Presentation Download & Video Access:
- Presentation Download: Click the PDF download link under 'Related Topics' to access the full institutional presentation of this report.
- Video Link: Click this link to watch the HDIN analyst briefing on YouTube.
About HDIN Research:
HDIN Research is a premier global market intelligence and strategic advisory firm specializing in institutional-grade financial analysis, supply chain audits, and macroeconomic forecasting. Our dedicated sector analysts deliver actionable, data-driven insights tailored for private equity, hedge funds, and corporate strategy teams. Visit us at http://www.hdinresearch.com.
*This intelligence report was authored by HDIN Research analysts following a rigorous audit of official corporate filings. AI was utilized for massive-scale data synthesis and structural drafting, ensuring 100% inclusion of reported data points. All strategic insights, financial modeling, and final verdicts were verified by our editorial board to ensure professional accuracy and compliance with 2026 Google Search E-E-A-T standards.*