Beijing Yuding Advanced Materials & Manufacturing Technologies Co., Ltd. [IPO Candidate]: USD 250.70 Million Capex Pivot Near Xiong'an as 500-Day AR Turnover Signals Structural Liquidity Risk
Date : 2026-07-03
Reading : 73
HDIN Executive Takeaways
* Yuding's 2025 net profit of USD 9.86 million masks a 111.56% policy dividend dependency. Core organic net profit collapsed to USD 1.49 million amid military pricing bottlenecks.
* A USD 250.70 million IPO expansion across Xiong'an and Chengdu adds USD 10.25 million in annual depreciation, threatening margins against unproven fourth-generation nuclear capacity utilization.
* Structural accumulation of USD 71.14 million in contract assets and receivables, heavily tied to "Product A," suppresses operational cash flow to USD 10.02 million, forcing a 28.19% pre-IPO equity dilution.
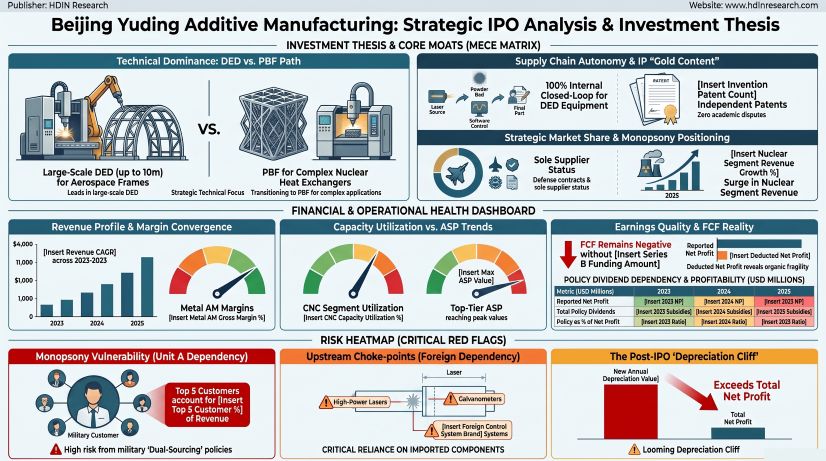
Figure Beijing Yuding Additive Manufacturing: Strategic lPO Analysis & investment Thesis
 Segmental Realities and Margin Compression
The financial architecture of Beijing Yuding Advanced Materials & Manufacturing Technologies Co., Ltd. ("Yuding") reveals a 676-basis point gross margin compression between 2023 and 2025, driven by military procurement pricing lags and elevated unit economics on advanced aerospace components. The Company operates under a provisional pricing model, where 36.03% of 2025 revenue was booked without final audited military prices, generating severe balance sheet bloat. Contract assets tied to a single core transport aircraft component ("Product A") ballooned to USD 53.63 million (CNY 385.49 million), forcing USD 7.16 million in aging impairments by 2025, including a specific USD 3.29 million write-down. The exchange rate benchmark applied across all metrics is 1 USD = 7.1875 CNY.
Table 1: Macro Financials, Asset Quality, and Capital Leverage (USD Millions)
In 2024, Yuding recognized a 100% Expected Credit Loss of USD 3.72 million against New Xiang Zhengxiao. Operating Cash Flow (OCF) registered at USD 8.03 million in 2023, crashed to USD -13.20 million in 2024, and rebounded to USD 10.02 million in 2025. The Cash Received from Sales to Revenue ratio printed 87.67%, 54.79%, and 78.31% over the three-year period, resulting in OCF/Net Profit matching ratios of 214.80%, -446.94%, and 101.60%.
Table 2: Income Statement, Segment Margins, and Policy Dependency (USD Millions)
Total Policy Dividends reached 59.36%, 214.24%, and 111.56% of Reported Net Profit across 2023, 2024, and 2025. The 2025 Tax Benefits equaled USD 2.08 million (R&D super-deduction: USD 0.61 million; 15% High-Tech Rate: USD 1.01 million; VAT input: USD 0.46 million). Total 2025 non-recurring items hit USD 8.55 million (CNY 61.46 million).
The 85.62% gross margin anomaly in 2025 Tech Services was artificially engineered by a USD 1.29 million (CNY 928.98 million) retroactive pricing adjustment from Beihang University. Related-Party Transactions (RPTs) show sales to Beihang at USD 5.28 million (2023), USD 0.92 million (2024), and USD 1.44 million (2025). Additional sales to Lepu Medical printed zero in 2023, and USD 0.001 million in 2024 and 2025. Total RPT sales were 9.57%, 1.67%, and 2.65% of revenue. RPT purchases (including USD 0.038 million to founder Wang Huaming in 2023 and USD 0.085 million to Beihang in 2024) represented 0.11%, 0.23%, and 0.00% of costs. Uncollected AR owed by Beihang stood at USD 9.49 million, USD 9.33 million, and USD 7.31 million, compounded by USD 3.47 million (CNY 24.96 million) in long-term non-current assets tied to Beihang.
Table 3: Revenue Distribution and CNC Capacity Metrics (USD Millions / Units)
Geographical revenue distribution reflects a 100% domestic profile: Northeast (USD 19.78m, 25.51m, 20.40m), Northwest (USD 10.35m, 12.59m, 13.36m), Southwest (USD 9.62m, 6.56m, 9.63m), East China (USD 2.85m, 4.31m, 5.89m), North China (USD 6.61m, 1.36m, 3.33m), Central China (USD 5.69m, 4.05m, 0.60m), and South China (USD 0.00m, 0.04m, 0.42m).
The unclassified CNC Equipment division maintained a static 200-unit capacity. Production volumes fluctuated from 162 to 247 to 172 units (utilizations of 81.00%, 123.50%, 86.00%). Sales volumes hit 165, 203, and 201 units, with internal self-supply absorbing 20, 10, and 6 units. Sales-to-production ratios cleared at 101.85%, 82.19%, and 116.86%. CNC ASPs (in USD thousands) exhibit extreme volatility based on specs: Vertical 3-axis (54.1, 45.1, 45.6); Vertical 5-axis (242.2, N/A, 142.4); Gantry 3-axis (312.2, 172.5, 146.5); Gantry 5-axis (N/A, N/A, 628.0); Horizontal 4-axis (86.9, 142.1, 130.0); and Horizontal 5-axis (492.5, 326.2, 300.8).
Infrastructure Layout and Regional Moats
Yuding operates a decentralized physical footprint. Headquarters and core R&D transitioned to the Xiong'an Pilot Free Trade Zone in September 2024. Heavy manufacturing is centralized via Chengdu Yuding and Chengdu Aiwei in the Gaoxin West District, complemented by Beijing facilities (Haidian Branch, Yuding New Materials in Changping) and Luzhou Yuding (established late 2025).
The Company operates in a global Additive Manufacturing market sized at USD 21.9 billion in 2024 (USD 4.7 billion specific to metals), projecting USD 60.0 billion by 2034, with the APAC region targeting USD 1.7 billion by 2025. Competitors include international OEMs (EOS, SLM Solutions, 3D Systems) and domestic rivals (BLT, Farsoon, XinJingHe, AVIC Tiandi, Triangle Defense).
Yuding’s moat lies in Directed Energy Deposition (DED), achieving forming limits of 10m x 5m x 3m (capable of producing >16 square meter titanium frames) at forming rates of 0.1-10kg/h, with multi-laser systems pushing >20kg/h. This contrasts starkly against Powder Bed Fusion (PBF) systems limited to <800mm³ chambers and 300-1000mm³/s forming rates. Material metallurgy yields LAM-TC11 titanium with 116MPa·m1/2 fracture toughness versus 72.4MPa·m1/2 for conventional forgings. R&D covers superalloys (GH3230), A100 steel, Tungsten/Tantalum, copper, and high-entropy alloys.
The USD 250.70 million (CNY 1,801.90 million) IPO Capex program mandates a 36-month construction cycle (trial production in months 27-30). Allocations include: DED Expansion (USD 61.18m / 24.4%), Headquarters/Testing Center (USD 56.20m / 22.4%), PBF Expansion (USD 55.38m / 22.1%), Ultra-large DED for 7m x 4m x 3.5m onsite parameters (USD 50.11m / 20.0%), and Working Capital (USD 27.83m / 11.1%). The hardware acquisition triggers a 293.0% expansion in machinery (adding USD 96.42m to the existing USD 32.91m / CNY 236.51m base) and a 1,336.0% expansion in buildings (adding USD 34.47m to the USD 2.58m base). Accounting for 9.5% equipment and 3.17% building depreciation policies, this loads USD 10.25 million (USD 9.16m + USD 1.09m) in fixed annual depreciation onto the P&L.
R&D initiatives include the MIIT 07 CNC System Project (USD 11.48m), Naval Copper Alloy AM (USD 2.79m), Low-Cost Titanium (USD 1.34m), and Superalloy Defect Control (USD 0.88m). Yuding holds 109 authorized patents (81 invention, 28 utility, 23 software). The 81 invention patents comprise 61 independent and 20 acquired (1 from Beihang/Beihang Huatai, 19 from Puruisi integration). Collaborative agreements with Hebei University of Science and Technology and Sichuan University exist without joint-ownership conflicts. The Company maintains a Level-3 Safety Production Certificate valid until November 2027 and reports zero core tech disputes.
HDIN Institutional Verdict
The governance architecture and capitalization table reveal high technical pedigree offset by extreme liquidity thirst. Founder and Beihang University Academician (2015) Dr. Wang Huaming controls the entity via Baoxiang Technology, holding 25.49% pre-IPO, which dilutes to 19.12% post-IPO, presenting a structural control risk without special voting rights. The executive team, featuring Chairman Dr. Liu Dong, GM Dr. He Bei, and Deputy GMs Yin Haifeng, Wang Fuwei, and Li An, drew total 2025 compensation of USD 0.617 million (CNY 4.4345 million). Management retains indirect equity via ESOPs Yujin Technology (12.75%) and Yujing Technology (2.10%), with specific stakes mapping to Liu Dong (0.83%), Li An (0.69%), Wang Fuwei (0.31%), He Bei (0.19%), and Chen Bo (0.13%). A 2022 options plan issued 1,543,231 units at USD 5.02 (CNY 36.06) tied to missed 2023 revenue targets of USD 48.69 million (CNY 350 million).
In the 12 months pre-IPO, Yuding onboarded 34 VC investors. A December 2025 injection raised USD 117.78 million (CNY 846.55 million) from 20 entities—including Chongqing Manufacturing Fund and Xiongan Sci-Tech Innovation Growth Fund—at a USD 486.96 million (CNY 3.5 billion) pre-money valuation, surrendering 28.19% of pre-IPO equity. Other institutional backers include Suzhou Kunyu (8.54%) and Lepu Medical (5.25%). Historical Valuation Adjustment Mechanisms (VAMs) from 2020, 2024, and 2025 holding drag-along and liquidation rights were terminated pre-IPO.
Compliance audits flag a historical 2023 tax late fee of USD 0.63 million (CNY 4.4985 million) and one pending lawsuit from Beijing Jiuguo Kemao for USD 0.20 million (CNY 1.4153 million).
Operational risk is dominated by extreme customer concentration and supply chain choking. The top 5 customers control 82.45%, 90.16%, and 82.66% of revenue, with ultimate military conglomerate "Unit A" dictating 54.01% (USD 29.94m), 70.81% (USD 39.05m), and 60.92% (USD 33.26m). Nuclear pilot revenue ("Unit B") sits at a fragile USD 1.55 million (5.74%). Procurement concentration (Top 5: 41.08%, 30.04%, 34.22%) highlights reliance on domestic material giants Baoji Titanium (USD 2.03m) and Shaanxi Yuguang Feili, against foreign-dependent CNC controllers from Beijing FANUC (USD 3.76m, USD 3.69m). PBF hardware expansion is reliant on competitors Huashu (CNY 30.125 million / USD 4.19 million) and E-Plus 3D (CNY 19.115 million / USD 2.66 million).
HDIN Verdict: Yuding's "sole supplier" monopoly is under immediate threat from the military's mandated "Dual-Sourcing" protocol. If the USD 10.25 million depreciation cliff outpaces PBF nuclear certification and DED aerospace absorption, the post-IPO earnings profile faces severe systemic compression.
Presentation Download & Video Access:
- Presentation Download: Click the PDF download link under 'Related Topics' to access the full institutional presentation of this report.
- Video Link: Click this link to watch the HDIN analyst briefing on YouTube.
About HDIN Research:
HDIN Research is a premier global market intelligence and strategic advisory firm specializing in institutional-grade financial analysis, supply chain audits, and macroeconomic forecasting. Our dedicated sector analysts deliver actionable, data-driven insights tailored for private equity, hedge funds, and corporate strategy teams. Visit us at http://www.hdinresearch.com.
2026 AI Transparency Footer:
"This intelligence report was authored by HDIN Research analysts following a rigorous audit of official corporate filings. AI was utilized for massive-scale data synthesis and structural drafting, ensuring 100% inclusion of reported data points. All strategic insights, financial modeling, and final verdicts were verified by our editorial board to ensure professional accuracy and compliance with 2026 Google Search E-E-A-T standards."
* Yuding's 2025 net profit of USD 9.86 million masks a 111.56% policy dividend dependency. Core organic net profit collapsed to USD 1.49 million amid military pricing bottlenecks.
* A USD 250.70 million IPO expansion across Xiong'an and Chengdu adds USD 10.25 million in annual depreciation, threatening margins against unproven fourth-generation nuclear capacity utilization.
* Structural accumulation of USD 71.14 million in contract assets and receivables, heavily tied to "Product A," suppresses operational cash flow to USD 10.02 million, forcing a 28.19% pre-IPO equity dilution.
Figure Beijing Yuding Additive Manufacturing: Strategic lPO Analysis & investment Thesis
Segmental Realities and Margin CompressionThe financial architecture of Beijing Yuding Advanced Materials & Manufacturing Technologies Co., Ltd. ("Yuding") reveals a 676-basis point gross margin compression between 2023 and 2025, driven by military procurement pricing lags and elevated unit economics on advanced aerospace components. The Company operates under a provisional pricing model, where 36.03% of 2025 revenue was booked without final audited military prices, generating severe balance sheet bloat. Contract assets tied to a single core transport aircraft component ("Product A") ballooned to USD 53.63 million (CNY 385.49 million), forcing USD 7.16 million in aging impairments by 2025, including a specific USD 3.29 million write-down. The exchange rate benchmark applied across all metrics is 1 USD = 7.1875 CNY.
Table 1: Macro Financials, Asset Quality, and Capital Leverage (USD Millions)
| Metric | 2023 | 2024 | 2025 |
|---|---|---|---|
| Total Assets | 129.61 | 179.11 | 307.36 |
| AR + Notes + Contract Assets (Net) | 44.18 (34.1%) | 60.61 (33.8%) | 71.14 (23.1%) |
| Accounts Receivable Turnover Days | 273 days | 371 days | 500 days |
| Inventory Net (% of Total Assets) | 28.87 (22.3%) | 33.42 (18.7%) | 30.17 (9.8%) |
| Raw Materials / WIP / Finished Goods | 6.75 / 18.13 / 2.28 | 6.88 / 15.55 / 5.40 | 7.41 / 14.57 / 2.61 |
| Inventory Turnover Days / Write-downs | 267 days / — | 305 days / — | 303 days / 1.03 (3.3%) |
| Bad Debt & Impairment Provisions | 2.69 | 6.41 | 12.71 |
In 2024, Yuding recognized a 100% Expected Credit Loss of USD 3.72 million against New Xiang Zhengxiao. Operating Cash Flow (OCF) registered at USD 8.03 million in 2023, crashed to USD -13.20 million in 2024, and rebounded to USD 10.02 million in 2025. The Cash Received from Sales to Revenue ratio printed 87.67%, 54.79%, and 78.31% over the three-year period, resulting in OCF/Net Profit matching ratios of 214.80%, -446.94%, and 101.60%.
Table 2: Income Statement, Segment Margins, and Policy Dependency (USD Millions)
| Metric | 2023 | 2024 | 2025 |
|---|---|---|---|
| Operating Revenue | 55.43 | 55.15 | 54.61 |
| Overall Gross Margin | 35.24% | 31.79% | 28.48% |
| Metal AM Products Margin | 35.46% | 37.40% | 27.28% |
| Metal AM Tech Services Margin | 28.62% | 28.18% | 85.62% |
| CNC Equipment Margin | 16.17% | 15.92% | 18.51% |
| R&D Expense Ratio (0% Capitalized) | 12.51% | 10.52% | 7.29% |
| SG&A Expense Ratio | 10.94% | 8.59% | 10.04% |
| Profit Before Tax (PBT) | 3.81 | 2.11 | 10.09 |
| Reported Net Profit (NP) | 3.74 | 2.95 | 9.86 |
| Non-Recurring P&L (Net of Tax) | 0.01 | 3.51 | 8.37 |
| Core Organic Net Profit (Deducted NP) | 3.73 (6.73%) | -0.56 (-1.02%) | 1.49 (2.73%) |
| Government Subsidies (incl. Xiong’an Relocation) | 0.88 | 4.60 | 8.92 |
| Total Policy Dividends (Subsidies + Tax) | 2.22 | 6.32 | 11.00 |
Total Policy Dividends reached 59.36%, 214.24%, and 111.56% of Reported Net Profit across 2023, 2024, and 2025. The 2025 Tax Benefits equaled USD 2.08 million (R&D super-deduction: USD 0.61 million; 15% High-Tech Rate: USD 1.01 million; VAT input: USD 0.46 million). Total 2025 non-recurring items hit USD 8.55 million (CNY 61.46 million).
The 85.62% gross margin anomaly in 2025 Tech Services was artificially engineered by a USD 1.29 million (CNY 928.98 million) retroactive pricing adjustment from Beihang University. Related-Party Transactions (RPTs) show sales to Beihang at USD 5.28 million (2023), USD 0.92 million (2024), and USD 1.44 million (2025). Additional sales to Lepu Medical printed zero in 2023, and USD 0.001 million in 2024 and 2025. Total RPT sales were 9.57%, 1.67%, and 2.65% of revenue. RPT purchases (including USD 0.038 million to founder Wang Huaming in 2023 and USD 0.085 million to Beihang in 2024) represented 0.11%, 0.23%, and 0.00% of costs. Uncollected AR owed by Beihang stood at USD 9.49 million, USD 9.33 million, and USD 7.31 million, compounded by USD 3.47 million (CNY 24.96 million) in long-term non-current assets tied to Beihang.
Table 3: Revenue Distribution and CNC Capacity Metrics (USD Millions / Units)
| Metric | 2023 | 2024 | 2025 |
|---|---|---|---|
| Metal AM Subtotal | 40.82 (74.33%) | 40.18 (73.83%) | 37.67 (70.24%) |
| Metal AM – Products (Customized Parts) | 34.25 (62.38%) | 39.11 (71.88%) | 34.31 (63.98%) |
| Metal AM – Tech Services / R&D | 1.20 (2.18%) | 1.06 (1.96%) | 3.28 (6.11%) |
| Metal AM – Equipment | 5.36 (9.77%) | 0.00 (0.00%) | 0.08 (0.14%) |
| CNC Processing Equipment | 11.97 (21.79%) | 14.06 (25.83%) | 15.41 (28.73%) |
| Special Processing Services | 2.13 (3.88%) | 0.18 (0.33%) | 0.55 (1.03%) |
| Total Main Business Revenue | 54.91 | 54.42 | 53.63 |
| Direct Sales vs. Trader Sales | 52.56 / 2.35 | 49.76 / 4.66 | 51.48 / 2.15 |
Geographical revenue distribution reflects a 100% domestic profile: Northeast (USD 19.78m, 25.51m, 20.40m), Northwest (USD 10.35m, 12.59m, 13.36m), Southwest (USD 9.62m, 6.56m, 9.63m), East China (USD 2.85m, 4.31m, 5.89m), North China (USD 6.61m, 1.36m, 3.33m), Central China (USD 5.69m, 4.05m, 0.60m), and South China (USD 0.00m, 0.04m, 0.42m).
The unclassified CNC Equipment division maintained a static 200-unit capacity. Production volumes fluctuated from 162 to 247 to 172 units (utilizations of 81.00%, 123.50%, 86.00%). Sales volumes hit 165, 203, and 201 units, with internal self-supply absorbing 20, 10, and 6 units. Sales-to-production ratios cleared at 101.85%, 82.19%, and 116.86%. CNC ASPs (in USD thousands) exhibit extreme volatility based on specs: Vertical 3-axis (54.1, 45.1, 45.6); Vertical 5-axis (242.2, N/A, 142.4); Gantry 3-axis (312.2, 172.5, 146.5); Gantry 5-axis (N/A, N/A, 628.0); Horizontal 4-axis (86.9, 142.1, 130.0); and Horizontal 5-axis (492.5, 326.2, 300.8).
Infrastructure Layout and Regional Moats
Yuding operates a decentralized physical footprint. Headquarters and core R&D transitioned to the Xiong'an Pilot Free Trade Zone in September 2024. Heavy manufacturing is centralized via Chengdu Yuding and Chengdu Aiwei in the Gaoxin West District, complemented by Beijing facilities (Haidian Branch, Yuding New Materials in Changping) and Luzhou Yuding (established late 2025).
The Company operates in a global Additive Manufacturing market sized at USD 21.9 billion in 2024 (USD 4.7 billion specific to metals), projecting USD 60.0 billion by 2034, with the APAC region targeting USD 1.7 billion by 2025. Competitors include international OEMs (EOS, SLM Solutions, 3D Systems) and domestic rivals (BLT, Farsoon, XinJingHe, AVIC Tiandi, Triangle Defense).
Yuding’s moat lies in Directed Energy Deposition (DED), achieving forming limits of 10m x 5m x 3m (capable of producing >16 square meter titanium frames) at forming rates of 0.1-10kg/h, with multi-laser systems pushing >20kg/h. This contrasts starkly against Powder Bed Fusion (PBF) systems limited to <800mm³ chambers and 300-1000mm³/s forming rates. Material metallurgy yields LAM-TC11 titanium with 116MPa·m1/2 fracture toughness versus 72.4MPa·m1/2 for conventional forgings. R&D covers superalloys (GH3230), A100 steel, Tungsten/Tantalum, copper, and high-entropy alloys.
The USD 250.70 million (CNY 1,801.90 million) IPO Capex program mandates a 36-month construction cycle (trial production in months 27-30). Allocations include: DED Expansion (USD 61.18m / 24.4%), Headquarters/Testing Center (USD 56.20m / 22.4%), PBF Expansion (USD 55.38m / 22.1%), Ultra-large DED for 7m x 4m x 3.5m onsite parameters (USD 50.11m / 20.0%), and Working Capital (USD 27.83m / 11.1%). The hardware acquisition triggers a 293.0% expansion in machinery (adding USD 96.42m to the existing USD 32.91m / CNY 236.51m base) and a 1,336.0% expansion in buildings (adding USD 34.47m to the USD 2.58m base). Accounting for 9.5% equipment and 3.17% building depreciation policies, this loads USD 10.25 million (USD 9.16m + USD 1.09m) in fixed annual depreciation onto the P&L.
R&D initiatives include the MIIT 07 CNC System Project (USD 11.48m), Naval Copper Alloy AM (USD 2.79m), Low-Cost Titanium (USD 1.34m), and Superalloy Defect Control (USD 0.88m). Yuding holds 109 authorized patents (81 invention, 28 utility, 23 software). The 81 invention patents comprise 61 independent and 20 acquired (1 from Beihang/Beihang Huatai, 19 from Puruisi integration). Collaborative agreements with Hebei University of Science and Technology and Sichuan University exist without joint-ownership conflicts. The Company maintains a Level-3 Safety Production Certificate valid until November 2027 and reports zero core tech disputes.
HDIN Institutional Verdict
The governance architecture and capitalization table reveal high technical pedigree offset by extreme liquidity thirst. Founder and Beihang University Academician (2015) Dr. Wang Huaming controls the entity via Baoxiang Technology, holding 25.49% pre-IPO, which dilutes to 19.12% post-IPO, presenting a structural control risk without special voting rights. The executive team, featuring Chairman Dr. Liu Dong, GM Dr. He Bei, and Deputy GMs Yin Haifeng, Wang Fuwei, and Li An, drew total 2025 compensation of USD 0.617 million (CNY 4.4345 million). Management retains indirect equity via ESOPs Yujin Technology (12.75%) and Yujing Technology (2.10%), with specific stakes mapping to Liu Dong (0.83%), Li An (0.69%), Wang Fuwei (0.31%), He Bei (0.19%), and Chen Bo (0.13%). A 2022 options plan issued 1,543,231 units at USD 5.02 (CNY 36.06) tied to missed 2023 revenue targets of USD 48.69 million (CNY 350 million).
In the 12 months pre-IPO, Yuding onboarded 34 VC investors. A December 2025 injection raised USD 117.78 million (CNY 846.55 million) from 20 entities—including Chongqing Manufacturing Fund and Xiongan Sci-Tech Innovation Growth Fund—at a USD 486.96 million (CNY 3.5 billion) pre-money valuation, surrendering 28.19% of pre-IPO equity. Other institutional backers include Suzhou Kunyu (8.54%) and Lepu Medical (5.25%). Historical Valuation Adjustment Mechanisms (VAMs) from 2020, 2024, and 2025 holding drag-along and liquidation rights were terminated pre-IPO.
Compliance audits flag a historical 2023 tax late fee of USD 0.63 million (CNY 4.4985 million) and one pending lawsuit from Beijing Jiuguo Kemao for USD 0.20 million (CNY 1.4153 million).
Operational risk is dominated by extreme customer concentration and supply chain choking. The top 5 customers control 82.45%, 90.16%, and 82.66% of revenue, with ultimate military conglomerate "Unit A" dictating 54.01% (USD 29.94m), 70.81% (USD 39.05m), and 60.92% (USD 33.26m). Nuclear pilot revenue ("Unit B") sits at a fragile USD 1.55 million (5.74%). Procurement concentration (Top 5: 41.08%, 30.04%, 34.22%) highlights reliance on domestic material giants Baoji Titanium (USD 2.03m) and Shaanxi Yuguang Feili, against foreign-dependent CNC controllers from Beijing FANUC (USD 3.76m, USD 3.69m). PBF hardware expansion is reliant on competitors Huashu (CNY 30.125 million / USD 4.19 million) and E-Plus 3D (CNY 19.115 million / USD 2.66 million).
HDIN Verdict: Yuding's "sole supplier" monopoly is under immediate threat from the military's mandated "Dual-Sourcing" protocol. If the USD 10.25 million depreciation cliff outpaces PBF nuclear certification and DED aerospace absorption, the post-IPO earnings profile faces severe systemic compression.
Presentation Download & Video Access:
- Presentation Download: Click the PDF download link under 'Related Topics' to access the full institutional presentation of this report.
- Video Link: Click this link to watch the HDIN analyst briefing on YouTube.
About HDIN Research:
HDIN Research is a premier global market intelligence and strategic advisory firm specializing in institutional-grade financial analysis, supply chain audits, and macroeconomic forecasting. Our dedicated sector analysts deliver actionable, data-driven insights tailored for private equity, hedge funds, and corporate strategy teams. Visit us at http://www.hdinresearch.com.
2026 AI Transparency Footer:
"This intelligence report was authored by HDIN Research analysts following a rigorous audit of official corporate filings. AI was utilized for massive-scale data synthesis and structural drafting, ensuring 100% inclusion of reported data points. All strategic insights, financial modeling, and final verdicts were verified by our editorial board to ensure professional accuracy and compliance with 2026 Google Search E-E-A-T standards."