InnoGrit Corporation: Enterprise Solid-State Drive Pivot Near Shanghai Free Trade Zone as 5.29% Gross Margin Signals Capital-Intensive AI Architecture Penetration
Date : 2026-07-03
Reading : 182
HDIN Executive Takeaways
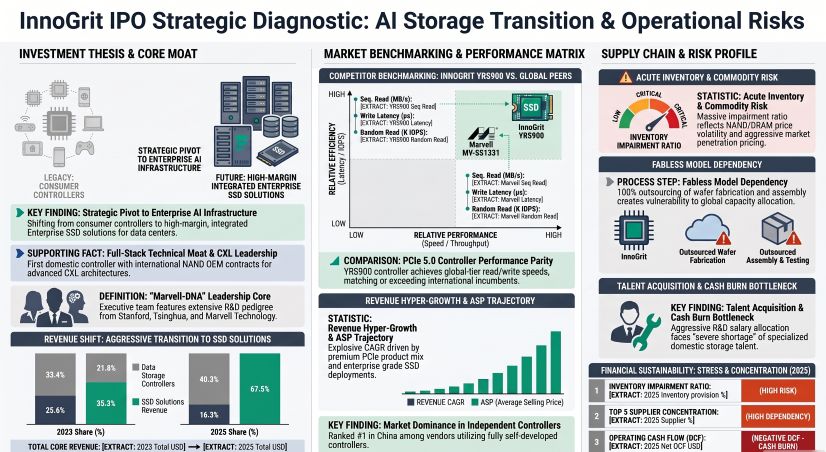
1. Total revenue scaled at a 70.02% CAGR to $143.89 million in 2025, driven by an enterprise solid-state drive pivot that compressed corporate gross margins to 5.29% and yielded a -$90.82 million operating cash flow deficit.
2. Operating a fabless model from its Shanghai Free Trade Zone headquarters, the firm relies on oligopolistic memory suppliers for 70.09% of procurement, retaining core R&D across Chengdu, Nanjing, and Shenzhen.
3. A proposed $449.81 million IPO targets the funding of $156.09 million in specialized R&D salaries and bridges a $134.96 million working capital gap, offsetting the financial drain of aggressive market penetration pricing.
Figure InnoGrit lPO Strategic Diagnostic: Al Storage Transition & Operational Risks
 Segmental Realities and Margin Compression
InnoGrit Corporation [Pre-IPO: InnoGrit] executed a structural shift from a standalone component supplier to a full-stack solid-state drive (SSD) vendor, dictating a highly consumptive working capital cycle. Total revenue advanced from $49.78 million (2023) to $86.95 million (2024), reaching $143.89 million in 2025. Core operational revenue mirrored this trajectory, scaling from $49.26 million to $86.82 million, and settling at $143.50 million in 2025.
This top-line acceleration was achieved at the expense of profitability. Corporate gross margins contracted from 33.09% (2023) to 10.92% (2024), settling at 5.29% in 2025. Consequently, net margins remained deeply negative at -102.21% (2023), -86.38% (2024), and -45.47% (2025). The reported net losses were -$50.88 million, -$75.11 million, and -$65.43 million across the respective periods. Non-recurring items, primarily government subsidies ($2.14 million, $0.89 million, and $2.41 million/17.31 million CNY), alongside wealth management income ($0.04 million, $0.19 million, and $0.04 million) and negligible non-operating expenses ($0.009 million in 2024; $0.002 million in 2025), provided immaterial bottom-line offsets of -2.40%, -1.45%, and -3.75%. Normalized net losses stood at -$52.10 million, -$76.19 million, and -$67.88 million. Tax benefits for High-Tech Enterprise (15%) and Micro/Small Enterprise (20%) status yielded minimal income tax expenses of $0.009 million, $0.012 million, and $0.026 million, rendering the tax shields ineffective against a 2025 accumulated deficit of -$178.05 million (-1,279.26 million CNY).
Revenue Composition and Unit Economics
The deliberate cannibalization of the data storage controller business in favor of SSD modules is evidenced by the shifting core revenue mix:
Table 1: SSDs & Data Storage Controllers Segment Performance (2023–2025)
* Technical Services: Represented $0.30 million (0.61%), $1.37 million (1.58%), and $0.56 million (0.39%) across the period.
* Geographic Distribution: Domestic revenue scaled from $15.87 million (32.22%) to $63.26 million (72.86%), and $79.56 million (55.44%) in 2025. Overseas revenue fluctuated from $33.39 million (67.78%) to $23.56 million (27.14%), before recovering to $63.94 million (44.56%).
Operating Expenditures and Capital Efficiency
InnoGrit Corporation applies a 100% immediate expensing policy for R&D. Total R&D expenditure registered at $46.39 million (86.86% ratio; total expense ratio 93.20%) in 2023, $42.45 million (46.96% ratio) in 2024, and $37.07 million (24.99% ratio) in 2025. Selling expenses scaled from $8.82 million to $9.45 million, though the expense ratio contracted from 17.71% to 6.57%. General and Administrative (G&A) expenses stabilized at $10.95 million (7.61% of revenue) in 2025, containing a $2.17 million financing service fee anomaly (19.77% of G&A). Share-Based Compensation (SBC) declined as early grants vested, dropping from $6.48 million to $3.94 million, and $2.43 million.
Balance Sheet and Asset Impairment Mechanics
Working capital intensity escalated sharply. Accounts Receivable (AR) swelled from $21.53 million to $78.42 million, slowing AR turnover from 2.75x to 2.12x. The 1-year AR aging bucket degraded from 92.14% to 68.85%, while the 1-2 year bucket expanded to 27.70% ($21.67 million). The AR bad debt provision stood at $4.21 million (5.37%). Total inventory balances expanded from $23.05 million to a book value of $121.22 million, forcing a $25.71 million impairment provision (21.21% blended ratio) and leaving a net inventory of $95.50 million. Inventory turnover recorded at 1.19x in 2023 and 1.35x in 2025.
Forensic inventory impairment breakdowns (2025):
* Raw Materials (Wafers/NAND/DRAM): $50.83 million book, $7.12 million provision (14.01%).
* Work-in-Process: $8.95 million book, $1.59 million provision (17.81%).
* Finished Goods: $39.00 million book, $6.94 million provision (17.80%).
* Sent Goods: $1.92 million book, $0.05 million provision (2.85%).
* Contract Fulfillment Costs: $20.52 million book, $10.00 million provision (48.75%).
Long-term assets operate on aggressive depreciation schedules with zero residual value and zero recorded impairment. Intangible assets (EDA/Software) hold a net book value of $6.91 million (53% of non-current assets) amortized over 1-3 years. Fixed assets hold a net book value of $2.45 million, comprising R&D Machinery ($1.55 million; 3-10 years, 10.00%-33.33% depreciation), Electronic Equipment ($0.86 million; 3 years, 33.33%), and Office Furniture ($0.04 million; 5 years, 20.00%). Goodwill exposure is absolute zero.
Liquidity metrics indicate structural pressure. Operating cash flows recorded at -$52.20 million, -$118.50 million, and -$90.82 million. Despite a $147.48 million equity raise in 2025 pushing cash equivalents to $55.10 million, short-term borrowings remained high at $76.02 million. The current ratio sits at 1.62x, with the quick ratio strained at 0.89x.
Supply Chain Architecture and Regional Moats
InnoGrit Corporation executes a strict fabless mandate from its Shanghai Free Trade Zone headquarters, delegating wafer fabrication and packaging to third-party foundries and Outsourced Semiconductor Assembly and Test (OSAT) facilities. Direct material costs (NAND/DRAM) dictate 93.38% of total main business costs. Strategic R&D is distributed across centers in Chengdu, Nanjing, and Shenzhen, while operational and sales hubs are located in Beijing, Ezhou, and Wuhan. Overseas export execution relies on Hong Kong (Nyquist HK) and an undisclosed Overseas Subsidiary A.
Concentration Dynamics and Sales Channels
Procurement is highly exposed to upstream oligopolies, with the Top 5 suppliers (including Yachuang Electronics and Hongxinkai) controlling 68.36% ($24.95 million), 56.57% ($68.08 million), and 70.09% ($127.99 million) of volume from 2023 to 2025. Conversely, the Top 5 customers commanded 78.96% ($39.30 million), 57.00% ($49.57 million), and 69.83% ($100.48 million) of revenue over the same period. The sales architecture shifted aggressively toward Direct Sales (92.27% to 89.45%, reaching 96.50% in 2025), minimizing Distribution (7.73%, 10.55%, and 3.50%).
The client roster transitioned from consumer module manufacturers (Longsys, ADATA, BIWIN) to enterprise infrastructure entities, led by Client A (28.13%), Client B (25.52%), Lenovo (7.12%), H3C (5.14%), and Tencent. Related party transactions with BIWIN Storage (where InnoGrit Supervisor Zhang Shuai served as Director until September 2025) plummeted. Controller sales and tech services to BIWIN dropped from $12.88 million (25.87%) to $4.39 million (5.05%), and $2.56 million (1.78%). Upstream procurement from BIWIN fell from $0.029 million to $0.002 million, hitting $0 in 2025. Related outstanding balances normalized, with AR against BIWIN shrinking from $5.81 million to $1.45 million and $0.56 million, and contract liabilities (rebate provisions) falling from $0.36 million to $0.02 million and $0.01 million. Historical fund lendings to related platforms Cayman InnoGrit, SPV A1, Company A, and Shanghai Rencun were fully settled with bank-equivalent interest by 2023. Key management compensation recorded at $3.01 million, $3.81 million, and $3.16 million.
Technological Benchmarking and Market Positioning
In a global SSD controller market projected to expand from $1.15 billion (2024) to $2.53 billion (2029), InnoGrit Corporation holds an 11% share among independent vendors in China (ranking #3 behind Maxio at 54% and Yeestor at 18%). Competitor analysis includes independent designers Marvell, FADU, Silicon Motion, Phison, and vertically integrated firms Samsung, SK Hynix, Solidigm, Huawei, alongside domestic peers T-Head, DapuStor, Memblaze. InnoGrit Corporation’s 24.99% R&D ratio aligns with the 25.58% industry average (Maxio 35.98%, Silicon Motion 29.66%, Marvell 25.32%, Phison 18.96%, FADU 74.35%). The company leverages an IP portfolio of 156 patents (over 100 in overseas/US jurisdictions), deploying heterogeneous ARM and RISC-V architectures and "Super ECC" (LDPC, BCH) on advanced TSMC 12nm nodes (TSMCN12, TACOMA12).
Table 2: Hardware Specifications (Competitor Matrix)
HDIN Institutional Verdict and Capital Allocation Strategy
The proposed capital allocation of $449.81 million (3.23 billion CNY) exposes critical structural bottlenecks in human capital and tape-out economics. The governance structure is highly dispersed; ex-Marvell CTO and actual controller Zining Wu holds 25.78% of pre-IPO voting rights (13.90% via Cayman InnoGrit, 11.89% via Shanghai Rencun), diluting to 23.21% post-IPO (12.51% and 10.70%, respectively). Institutional backing includes the National Integrated Circuit Industry Investment Fund Phase II (3.70%) and CEC/Zhongdian Investment (4.40%). Zining Wu is subject to a 36-month lock-up, while core technical personnel (including board members Chen Jie, Lin Chen, Wu Jian, Feng Zhengtian, Yu Li, Jun Wu) face a maximum 25% annual equity transfer cap for four years post-lock-up.
Capital Deployment Execution Risks
The IPO proceeds are distributed across three distinct mandates:
1. New Generation Data Center Enterprise Storage R&D (PCIe 6.0/7.0, 8-year lifespan): Total investment of $208.47 million (proceeds allocation $176.97 million). Segmented into R&D Salaries at $104.62 million (50.18%), Working Capital/Other at $51.33 million (34.63%), Software/EDA at $27.98 million (13.42%), Tape-out at $21.10 million (10.12%), and Hardware at $3.44 million (1.65%).
2. AI-Oriented Storage System Solution (CXL Protocol, 5-year lifespan): Total investment of $138.47 million (proceeds allocation $137.88 million). Segmented into R&D Salaries at $51.47 million (37.17%), Other R&D/Reserves at $36.40 million (26.28%), Tape-out at $30.61 million (22.11%), Software/EDA at $17.11 million (12.36%), and Hardware at $2.88 million (2.08%).
3. Supplemental Working Capital: Proceeds allocation of $134.96 million.
The aggregate allocation designates $156.09 million exclusively for R&D salaries and $51.71 million for advanced node tape-outs (which exceed $10 million per iteration). As of December 2025, InnoGrit Corporation employed only 198 R&D personnel (64.29% of headcount), with total company-wide R&D compensation standing at $20.47 million. Deploying $156.09 million requires an immediate, massive headcount expansion in a domestic market characterized by a severe shortage of high-end storage controller talent. Concurrently, the necessity of injecting $134.96 million into general working capital confirms the chronic cash-burn reality of operating as a full-stack, enterprise SSD assembler under volatile memory procurement cycles.
Presentation Download & Video Access:
Presentation Download: Click the PDF download link under 'Related Topics' to access the full institutional presentation of this report.
Video Link: Click this link to watch the HDIN analyst briefing on YouTube.
About HDIN Research:
HDIN Research is a premier global market intelligence and strategic advisory firm specializing in institutional-grade financial analysis, supply chain audits, and macroeconomic forecasting. Our dedicated sector analysts deliver actionable, data-driven insights tailored for private equity, hedge funds, and corporate strategy teams. Visit us at http://www.hdinresearch.com.
2026 AI Transparency Footer:
"This intelligence report was authored by HDIN Research analysts following a rigorous audit of official corporate filings. AI was utilized for massive-scale data synthesis and structural drafting, ensuring 100% inclusion of reported data points. All strategic insights, financial modeling, and final verdicts were verified by our editorial board to ensure professional accuracy and compliance with 2026 Google Search E-E-A-T standards."
1. Total revenue scaled at a 70.02% CAGR to $143.89 million in 2025, driven by an enterprise solid-state drive pivot that compressed corporate gross margins to 5.29% and yielded a -$90.82 million operating cash flow deficit.
2. Operating a fabless model from its Shanghai Free Trade Zone headquarters, the firm relies on oligopolistic memory suppliers for 70.09% of procurement, retaining core R&D across Chengdu, Nanjing, and Shenzhen.
3. A proposed $449.81 million IPO targets the funding of $156.09 million in specialized R&D salaries and bridges a $134.96 million working capital gap, offsetting the financial drain of aggressive market penetration pricing.
Figure InnoGrit lPO Strategic Diagnostic: Al Storage Transition & Operational Risks
Segmental Realities and Margin CompressionInnoGrit Corporation [Pre-IPO: InnoGrit] executed a structural shift from a standalone component supplier to a full-stack solid-state drive (SSD) vendor, dictating a highly consumptive working capital cycle. Total revenue advanced from $49.78 million (2023) to $86.95 million (2024), reaching $143.89 million in 2025. Core operational revenue mirrored this trajectory, scaling from $49.26 million to $86.82 million, and settling at $143.50 million in 2025.
This top-line acceleration was achieved at the expense of profitability. Corporate gross margins contracted from 33.09% (2023) to 10.92% (2024), settling at 5.29% in 2025. Consequently, net margins remained deeply negative at -102.21% (2023), -86.38% (2024), and -45.47% (2025). The reported net losses were -$50.88 million, -$75.11 million, and -$65.43 million across the respective periods. Non-recurring items, primarily government subsidies ($2.14 million, $0.89 million, and $2.41 million/17.31 million CNY), alongside wealth management income ($0.04 million, $0.19 million, and $0.04 million) and negligible non-operating expenses ($0.009 million in 2024; $0.002 million in 2025), provided immaterial bottom-line offsets of -2.40%, -1.45%, and -3.75%. Normalized net losses stood at -$52.10 million, -$76.19 million, and -$67.88 million. Tax benefits for High-Tech Enterprise (15%) and Micro/Small Enterprise (20%) status yielded minimal income tax expenses of $0.009 million, $0.012 million, and $0.026 million, rendering the tax shields ineffective against a 2025 accumulated deficit of -$178.05 million (-1,279.26 million CNY).
Revenue Composition and Unit Economics
The deliberate cannibalization of the data storage controller business in favor of SSD modules is evidenced by the shifting core revenue mix:
Table 1: SSDs & Data Storage Controllers Segment Performance (2023–2025)
| Segment | 2023 | 2024 | 2025 | Key Notes |
|---|---|---|---|---|
| Solid State Drives (SSDs) Revenue | $14.18M (28.79%) | $62.42M (71.89%) | $123.68M (86.19%) | Rapid scale-up into core revenue driver |
| PCIe SSD Revenue | $12.51M | $31.77M | $81.84M | Strong high-performance mix shift |
| SATA SSD Revenue | $1.67M | $30.64M | $41.84M | Growth but declining margin contribution |
| SSD Production Volume | 0.51M TB | 0.94M TB | 1.68M TB | Strong capacity expansion |
| SSD Sales Volume | 0.45M TB | 0.82M TB | 1.59M TB | Demand scaling in parallel with production |
| SSD ASP | $31.77/TB | $76.01/TB | $77.67/TB | Pricing uplift then stabilization |
| SSD Gross Margin | 11.76% | — | 0.13% | Severe margin compression by FY2025 |
| SATA Sub-segment Margin | — | -4.87% | -8.98% | Structural loss-making pressure |
| Segment | 2023 | 2024 | 2025 | Key Notes |
|---|---|---|---|---|
| Data Storage Controllers Revenue | $34.78M (70.61%) | $23.03M (26.53%) | $19.26M (13.42%) | Structural decline in legacy segment |
| PCIe Controllers Revenue | $34.78M | $22.93M | $18.92M | Gradual contraction |
| SATA Controllers Revenue | $0 | $0.10M | $0.34M | Near exit state |
| Controller Production Volume | 9.11M units | 6.62M units | 7.84M units | Partial stabilization in FY2025 |
| Controller Sales Volume | 8.82M | 6.11M | 3.96M | Sharp demand decline despite ASP recovery |
| Controller ASP | $3.94 → $3.77 | $3.77 | $4.86 | Price recovery in later stage |
| Controller Gross Margin | 41.33% | 34.46% | 36.08% | Margins relatively resilient vs SSDs |
* Technical Services: Represented $0.30 million (0.61%), $1.37 million (1.58%), and $0.56 million (0.39%) across the period.
* Geographic Distribution: Domestic revenue scaled from $15.87 million (32.22%) to $63.26 million (72.86%), and $79.56 million (55.44%) in 2025. Overseas revenue fluctuated from $33.39 million (67.78%) to $23.56 million (27.14%), before recovering to $63.94 million (44.56%).
Operating Expenditures and Capital Efficiency
InnoGrit Corporation applies a 100% immediate expensing policy for R&D. Total R&D expenditure registered at $46.39 million (86.86% ratio; total expense ratio 93.20%) in 2023, $42.45 million (46.96% ratio) in 2024, and $37.07 million (24.99% ratio) in 2025. Selling expenses scaled from $8.82 million to $9.45 million, though the expense ratio contracted from 17.71% to 6.57%. General and Administrative (G&A) expenses stabilized at $10.95 million (7.61% of revenue) in 2025, containing a $2.17 million financing service fee anomaly (19.77% of G&A). Share-Based Compensation (SBC) declined as early grants vested, dropping from $6.48 million to $3.94 million, and $2.43 million.
Balance Sheet and Asset Impairment Mechanics
Working capital intensity escalated sharply. Accounts Receivable (AR) swelled from $21.53 million to $78.42 million, slowing AR turnover from 2.75x to 2.12x. The 1-year AR aging bucket degraded from 92.14% to 68.85%, while the 1-2 year bucket expanded to 27.70% ($21.67 million). The AR bad debt provision stood at $4.21 million (5.37%). Total inventory balances expanded from $23.05 million to a book value of $121.22 million, forcing a $25.71 million impairment provision (21.21% blended ratio) and leaving a net inventory of $95.50 million. Inventory turnover recorded at 1.19x in 2023 and 1.35x in 2025.
Forensic inventory impairment breakdowns (2025):
* Raw Materials (Wafers/NAND/DRAM): $50.83 million book, $7.12 million provision (14.01%).
* Work-in-Process: $8.95 million book, $1.59 million provision (17.81%).
* Finished Goods: $39.00 million book, $6.94 million provision (17.80%).
* Sent Goods: $1.92 million book, $0.05 million provision (2.85%).
* Contract Fulfillment Costs: $20.52 million book, $10.00 million provision (48.75%).
Long-term assets operate on aggressive depreciation schedules with zero residual value and zero recorded impairment. Intangible assets (EDA/Software) hold a net book value of $6.91 million (53% of non-current assets) amortized over 1-3 years. Fixed assets hold a net book value of $2.45 million, comprising R&D Machinery ($1.55 million; 3-10 years, 10.00%-33.33% depreciation), Electronic Equipment ($0.86 million; 3 years, 33.33%), and Office Furniture ($0.04 million; 5 years, 20.00%). Goodwill exposure is absolute zero.
Liquidity metrics indicate structural pressure. Operating cash flows recorded at -$52.20 million, -$118.50 million, and -$90.82 million. Despite a $147.48 million equity raise in 2025 pushing cash equivalents to $55.10 million, short-term borrowings remained high at $76.02 million. The current ratio sits at 1.62x, with the quick ratio strained at 0.89x.
Supply Chain Architecture and Regional Moats
InnoGrit Corporation executes a strict fabless mandate from its Shanghai Free Trade Zone headquarters, delegating wafer fabrication and packaging to third-party foundries and Outsourced Semiconductor Assembly and Test (OSAT) facilities. Direct material costs (NAND/DRAM) dictate 93.38% of total main business costs. Strategic R&D is distributed across centers in Chengdu, Nanjing, and Shenzhen, while operational and sales hubs are located in Beijing, Ezhou, and Wuhan. Overseas export execution relies on Hong Kong (Nyquist HK) and an undisclosed Overseas Subsidiary A.
Concentration Dynamics and Sales Channels
Procurement is highly exposed to upstream oligopolies, with the Top 5 suppliers (including Yachuang Electronics and Hongxinkai) controlling 68.36% ($24.95 million), 56.57% ($68.08 million), and 70.09% ($127.99 million) of volume from 2023 to 2025. Conversely, the Top 5 customers commanded 78.96% ($39.30 million), 57.00% ($49.57 million), and 69.83% ($100.48 million) of revenue over the same period. The sales architecture shifted aggressively toward Direct Sales (92.27% to 89.45%, reaching 96.50% in 2025), minimizing Distribution (7.73%, 10.55%, and 3.50%).
The client roster transitioned from consumer module manufacturers (Longsys, ADATA, BIWIN) to enterprise infrastructure entities, led by Client A (28.13%), Client B (25.52%), Lenovo (7.12%), H3C (5.14%), and Tencent. Related party transactions with BIWIN Storage (where InnoGrit Supervisor Zhang Shuai served as Director until September 2025) plummeted. Controller sales and tech services to BIWIN dropped from $12.88 million (25.87%) to $4.39 million (5.05%), and $2.56 million (1.78%). Upstream procurement from BIWIN fell from $0.029 million to $0.002 million, hitting $0 in 2025. Related outstanding balances normalized, with AR against BIWIN shrinking from $5.81 million to $1.45 million and $0.56 million, and contract liabilities (rebate provisions) falling from $0.36 million to $0.02 million and $0.01 million. Historical fund lendings to related platforms Cayman InnoGrit, SPV A1, Company A, and Shanghai Rencun were fully settled with bank-equivalent interest by 2023. Key management compensation recorded at $3.01 million, $3.81 million, and $3.16 million.
Technological Benchmarking and Market Positioning
In a global SSD controller market projected to expand from $1.15 billion (2024) to $2.53 billion (2029), InnoGrit Corporation holds an 11% share among independent vendors in China (ranking #3 behind Maxio at 54% and Yeestor at 18%). Competitor analysis includes independent designers Marvell, FADU, Silicon Motion, Phison, and vertically integrated firms Samsung, SK Hynix, Solidigm, Huawei, alongside domestic peers T-Head, DapuStor, Memblaze. InnoGrit Corporation’s 24.99% R&D ratio aligns with the 25.58% industry average (Maxio 35.98%, Silicon Motion 29.66%, Marvell 25.32%, Phison 18.96%, FADU 74.35%). The company leverages an IP portfolio of 156 patents (over 100 in overseas/US jurisdictions), deploying heterogeneous ARM and RISC-V architectures and "Super ECC" (LDPC, BCH) on advanced TSMC 12nm nodes (TSMCN12, TACOMA12).
Table 2: Hardware Specifications (Competitor Matrix)
| Category | Product | Read / Write Speed | IOPS (Read / Write) | Latency | Key Notes |
|---|---|---|---|---|---|
| Enterprise PCIe 5.0 Controllers | InnoGrit YRS900 | 14,700 / 12,000 MB/s | 3,500K / 2,500K | 4 μs (write) | Ultra-low latency leadership |
| Marvell MV-SS1331 | 14,000 / 9,000 MB/s | 2,000K / 1,000K | <6 μs | Balanced enterprise performer | |
| Silicon Motion SM8366 | 14,200 / 9,400 MB/s | 3,500K / 2,800K | 9 μs | High IOPS but higher latency | |
| FADU FC5161 | 14,000 / 12,000 MB/s | 3,500K / 1,600K | 10 μs | Strong write performance | |
| T-Head Zhenyue 510 | 14,000 / 10,000 MB/s | 3,400K / 2,500K | <4 μs | Best-in-class latency | |
| Consumer PCIe 4.0 Controllers | InnoGrit IG5222 | 7,400 / 6,800 MB/s | 1,200K / 1,200K | — | Competitive mainstream controller |
| Maxio MAP1602-C | 7,400 / 6,500 MB/s | 1,000K / 1,000K | — | Cost-optimized solution | |
| Silicon Motion SM2268XT2 | 7,400 / 6,700 MB/s | 1,200K / 1,200K | — | Balanced performance | |
| Phison PS5029-E29T | 7,400 / 6,600 MB/s | 1,000K / 1,400K | — | Strong write IOPS | |
| High-Performance AI SSDs | InnoGrit Dongting-N3X | 14,000 / 11,000 MB/s | 3,500K / 1,600K | 18 μs / 4 μs | AI-optimized architecture |
| Huawei EX560 | 14,900 / 12,000 MB/s | 2,863K / 1,500K | 40 μs / 5.4 μs | Higher throughput, higher latency |
HDIN Institutional Verdict and Capital Allocation Strategy
The proposed capital allocation of $449.81 million (3.23 billion CNY) exposes critical structural bottlenecks in human capital and tape-out economics. The governance structure is highly dispersed; ex-Marvell CTO and actual controller Zining Wu holds 25.78% of pre-IPO voting rights (13.90% via Cayman InnoGrit, 11.89% via Shanghai Rencun), diluting to 23.21% post-IPO (12.51% and 10.70%, respectively). Institutional backing includes the National Integrated Circuit Industry Investment Fund Phase II (3.70%) and CEC/Zhongdian Investment (4.40%). Zining Wu is subject to a 36-month lock-up, while core technical personnel (including board members Chen Jie, Lin Chen, Wu Jian, Feng Zhengtian, Yu Li, Jun Wu) face a maximum 25% annual equity transfer cap for four years post-lock-up.
Capital Deployment Execution Risks
The IPO proceeds are distributed across three distinct mandates:
1. New Generation Data Center Enterprise Storage R&D (PCIe 6.0/7.0, 8-year lifespan): Total investment of $208.47 million (proceeds allocation $176.97 million). Segmented into R&D Salaries at $104.62 million (50.18%), Working Capital/Other at $51.33 million (34.63%), Software/EDA at $27.98 million (13.42%), Tape-out at $21.10 million (10.12%), and Hardware at $3.44 million (1.65%).
2. AI-Oriented Storage System Solution (CXL Protocol, 5-year lifespan): Total investment of $138.47 million (proceeds allocation $137.88 million). Segmented into R&D Salaries at $51.47 million (37.17%), Other R&D/Reserves at $36.40 million (26.28%), Tape-out at $30.61 million (22.11%), Software/EDA at $17.11 million (12.36%), and Hardware at $2.88 million (2.08%).
3. Supplemental Working Capital: Proceeds allocation of $134.96 million.
The aggregate allocation designates $156.09 million exclusively for R&D salaries and $51.71 million for advanced node tape-outs (which exceed $10 million per iteration). As of December 2025, InnoGrit Corporation employed only 198 R&D personnel (64.29% of headcount), with total company-wide R&D compensation standing at $20.47 million. Deploying $156.09 million requires an immediate, massive headcount expansion in a domestic market characterized by a severe shortage of high-end storage controller talent. Concurrently, the necessity of injecting $134.96 million into general working capital confirms the chronic cash-burn reality of operating as a full-stack, enterprise SSD assembler under volatile memory procurement cycles.
Presentation Download & Video Access:
Presentation Download: Click the PDF download link under 'Related Topics' to access the full institutional presentation of this report.
Video Link: Click this link to watch the HDIN analyst briefing on YouTube.
About HDIN Research:
HDIN Research is a premier global market intelligence and strategic advisory firm specializing in institutional-grade financial analysis, supply chain audits, and macroeconomic forecasting. Our dedicated sector analysts deliver actionable, data-driven insights tailored for private equity, hedge funds, and corporate strategy teams. Visit us at http://www.hdinresearch.com.
2026 AI Transparency Footer:
"This intelligence report was authored by HDIN Research analysts following a rigorous audit of official corporate filings. AI was utilized for massive-scale data synthesis and structural drafting, ensuring 100% inclusion of reported data points. All strategic insights, financial modeling, and final verdicts were verified by our editorial board to ensure professional accuracy and compliance with 2026 Google Search E-E-A-T standards."