CAS Space: $581.62 Million Pre-Profit Listing Near Guangzhou as 88.77% Top-Line Growth Signals Imminent Reusable Architecture Transition
Date : 2026-07-02
Reading : 501
HDIN Executive Takeaways
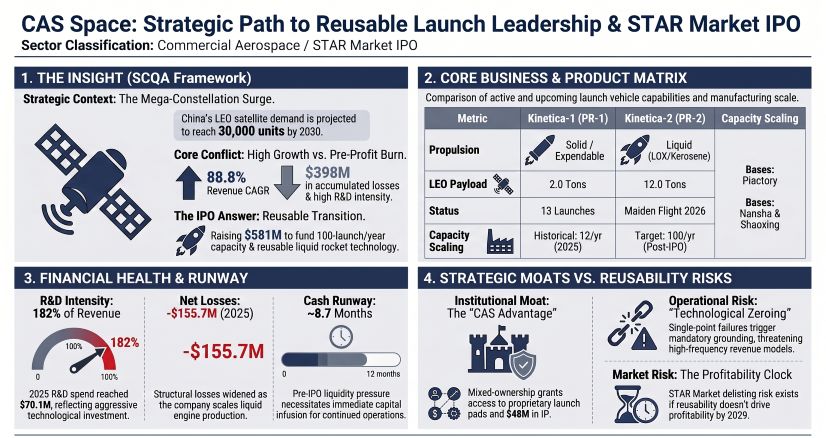
* Core launch revenue expanded at an 88.77% compound annual growth rate to $38.53 million in 2025, counterbalanced by an aggressive -$120.38 million operating cash burn dictating an 8.7-month pre-IPO implied liquidity runway.
* Production operations are systematically pivoting from Guangzhou Nansha solid-motor facilities to a Huangpu-based liquid engine base, allocating 60.35% of a $581.62 million IPO toward 110-ton LOX/Kerosene architectures.
* Despite capturing 63% of domestic private payloads in 2025, structural gross margins plunged to -89.29%, accelerating the necessity for a 30-reuse cycle, "cluster recovery" mechanism to offset severe fixed-asset depreciation.
Figure CAS Space: Strategic Path to Reusable Launch Leadership & STAR Market IPO
 Segmental Realities and Margin Compression
CAS Space [STAR: CASS] operates under acute liquidity pressure, balancing hyper-growth top-line trajectories against severe capital expenditure and structural negative margins. The accumulation of $398.86 million in unrecovered losses highlights the capital intensity of the pre-profit aerospace archetype. Based on a total annual cash burn (Operating plus Investing) of $275.35 million against a $199.98 million liquidity reserve at the end of 2025, the company faces an implied runway of 8.7 months at a ~$23 million monthly burn rate, sustaining operations primarily through $450.46 million in 2025 financing cash flows.
To combat a structural launch service gross margin of -91.74% in 2025 (-83.84% after restoring inventory impairments and expected liabilities), management relies on high-frequency economies of scale. Restored single-launch costs for the PR-1 dropped 11.03% to $18.30 million in 2024 and 24.83% to $13.75 million in 2025. Technological integration of avionics reduced onboard equipment by 50% and ground equipment by 80%, while optimized Guidance, Navigation, and Control (GNC) algorithms cut energy loss by over 15%. However, fixed asset infrastructure totaling $104.95 million (51.58% of non-current assets) continues to drive massive depreciation costs. Accounts receivable turnover deteriorated from 6.07 in 2024 to 2.43 in 2025, though 94.19% of the balance remains aged under one year. Inventory turnover accelerated from 1.11 to 5.92, yet out of $13.34 million in gross inventory, the firm booked a $10.71 million impairment provision tied to loss-making fulfillment costs, leaving a net book value of $2.63 million against $12.29 million in contract liabilities.
Table 1: Segmental Financials & Margin Metrics
Infrastructure Layout and Regional Moats
CAS Space maintains a structurally disjointed supply chain, operating through specialized, geographically decoupled nodes. The solid rocket pipeline is routed through Guangzhou Equipment (Guangzhou Nansha) for pulse-style assembly, utilizing a 2025 capacity of 12 rockets (6 output, 50.00% utilization, scaled from 4 capacity/1 output/25.00% utilization in 2023 and 9 capacity/4 output/44.44% utilization in 2024). Liquid rocket assembly is based at Shaoxing Equipment, supported by Guangzhou Power (engine testing) and Guangzhou Manufacturing (liquid engine/reusable vehicle production). Shandong Equipment (Yantai) handles sea-launch logistics, while Hainan Equipment (Wenchang) and Jiuquan Tech (Gansu) execute launch and recovery operations across dedicated solid and liquid launch pads.
The supplier matrix exposes an acute, single-point-of-failure risk, heavily concentrated in state-owned propulsion monopolies. Top-five supplier concentration registered 82.37% in 2023, 78.65% in 2024, and 78.51% in 2025. Out of the total $85.09 million raw material procurement in 2025, propulsion systems consumed 55.09% ($46.87 million), structural systems 23.28% ($19.81 million), and avionics 19.39% ($16.50 million). The China Aerospace Science and Technology Corporation (CASC) commanded 60.57% ($51.95 million) of total purchases, followed by Tianjin Aistar ($6.72 million / 7.84%), Shandong Tongqiang ($4.71 million / 5.49%), CASIC ($1.97 million / 2.30%), and Tianjin Hangyu Zhuoran ($1.99 million / 2.32%).
To internalize propulsion and execute a 10x scale-up target of 100 launches per year, CAS Space is executing a highly compartmented $581.62 million IPO capital deployment over synchronized timelines:
* Reusable Large-Scale Rocket R&D ($303.68M / 52.21%): A 36-month (12-quarter) timeline to develop the PR-2H and PR-3.
* Reusable Space Vehicle R&D ($119.28M / 20.51%): A 36-month timeline for Kinetica-Space orbital manufacturing/tourism models.
* Reusable Liquid Engine Base ($47.35M / 8.14%): An accelerated 18-month (6-quarter) facility rollout in Huangpu District. Hardware procurement scales from Q1 Year 1 to Q1 Year 2, personnel recruitment from Q1 Year 1 to Q2 Year 2, and trial production from Q4 Year 1 to Q2 Year 2.
* Working Capital & Debt Repayment ($111.30M / 19.14%): $83.48 million explicitly allocated to retire bank debt, leaving $27.83 million for direct working capital replenishment.
HDIN Institutional Verdict
The mixed-ownership governance structure effectively de-risks R&D while injecting $48.13 million in intellectual property (representing 79.42% of gross intangibles) from the Chinese Academy of Sciences (CAS) Institute of Mechanics via state vehicle Zhongke Lisen (holding 20.58% equity). Founder Yang Yiqiang retains de facto control with 34.71% voting rights via Pengyi Junlian (21.98%), Tianjin Tansuo (1.47%), Huzhou Zhongqing (1.12%), and a concert agreement with Zheng Jun/Guoke Yuhang (10.14%). Additional institutional backing includes the National Industry Investment Fund (2.19%), Guangzhou Chantou (3.89%), Yuexiu Zhichuang (0.87%), and Yuexiu Jinchan (0.47%). Talent retention demands massive share-based compensation: $24.69 million, $20.71 million, and $13.80 million across 2023-2025, covering 97 employees (7.56% equity: 2.66% directors/management, 4.90% staff), locked for 36 months post-IPO.
Shared lab infrastructure dependency relies on negligible financial outlays—$3,937 in 2023/2024 and $14,441 in 2025 for modal/vibration testing. A/R from CAS contracted from $3.01 million (81.41%) in 2023 to $1.76 million (23.52%) in 2024 and $0.68 million in 2025, alongside $0.49 million (2024) and $0.51 million (2025) in prepayments. Original 2023 licensing dependencies yielded $9.23 million (85.34% of revenue) before operational autonomy. A historical $11.13 million insurance claim from the Y6 rocket failure reinforces the immediate revenue-halting threat of mandatory "technological zeroing" mandates.
CAS Space commands a 63% market share (up from 50% in 2024), deploying approximately 6.0 tons of payload in 2025. It eclipses tier-1 private peers: Galactic Energy (>4 tons total, >1 ton LEO 2025, 24 launches/21 successes), LandSpace (<2 tons total, <1 ton LEO 2025, 8/5 successes), Orienspace (>1 ton total/2025, 2/2 successes), Space Pioneer (<1 ton total/2025, 2/1 successes), and i-Space (<1 ton total, <0.5 tons LEO 2025, 8/4 successes). Despite holding the private domestic single-launch record of 26 satellites, CAS Space remains a strategic pursuer compared to SpaceX’s 2025 output of 165 Falcon launches (51% of global orbital launches) with a 22.8-ton LEO capacity and a historical 525/526 success record.
Table 2: Aerospace Pipeline & VTVL Evolution Targets
*Overall Fleet Data: CAS Space holds a record of 16 total launches (15 successes, 1 failure), placing 107 satellites and 1 spacecraft into orbit, representing over 19 tons of payload. Total backlog demand is anchored by an impending 30,000-satellite national ITU mandate, supported by regional B2B operators (Zhongke Satellite, Microquanta Semiconductor) and 6 international sovereign clients across Oman, Mexico, Pakistan, the UAE, Egypt, and Nepal. Sub-meter precision capabilities have been validated in previous land and sea tests.*
Presentation Download & Video Access:
- Presentation Download: Click the PDF download link under 'Related Topics' to access the full institutional presentation of this report.
- Video Link: Click this link to watch the HDIN analyst briefing on YouTube.
About HDIN Research:
HDIN Research is a premier global market intelligence and strategic advisory firm specializing in institutional-grade financial analysis, supply chain audits, and macroeconomic forecasting. Our dedicated sector analysts deliver actionable, data-driven insights tailored for private equity, hedge funds, and corporate strategy teams. Visit us at http://www.hdinresearch.com.
*2026 AI Transparency Footer:*
"This intelligence report was authored by HDIN Research analysts following a rigorous audit of official corporate filings. AI was utilized for massive-scale data synthesis and structural drafting, ensuring 100% inclusion of reported data points. All strategic insights, financial modeling, and final verdicts were verified by our editorial board to ensure professional accuracy and compliance with 2026 Google Search E-E-A-T standards."
* Core launch revenue expanded at an 88.77% compound annual growth rate to $38.53 million in 2025, counterbalanced by an aggressive -$120.38 million operating cash burn dictating an 8.7-month pre-IPO implied liquidity runway.
* Production operations are systematically pivoting from Guangzhou Nansha solid-motor facilities to a Huangpu-based liquid engine base, allocating 60.35% of a $581.62 million IPO toward 110-ton LOX/Kerosene architectures.
* Despite capturing 63% of domestic private payloads in 2025, structural gross margins plunged to -89.29%, accelerating the necessity for a 30-reuse cycle, "cluster recovery" mechanism to offset severe fixed-asset depreciation.
Figure CAS Space: Strategic Path to Reusable Launch Leadership & STAR Market IPO
Segmental Realities and Margin CompressionCAS Space [STAR: CASS] operates under acute liquidity pressure, balancing hyper-growth top-line trajectories against severe capital expenditure and structural negative margins. The accumulation of $398.86 million in unrecovered losses highlights the capital intensity of the pre-profit aerospace archetype. Based on a total annual cash burn (Operating plus Investing) of $275.35 million against a $199.98 million liquidity reserve at the end of 2025, the company faces an implied runway of 8.7 months at a ~$23 million monthly burn rate, sustaining operations primarily through $450.46 million in 2025 financing cash flows.
To combat a structural launch service gross margin of -91.74% in 2025 (-83.84% after restoring inventory impairments and expected liabilities), management relies on high-frequency economies of scale. Restored single-launch costs for the PR-1 dropped 11.03% to $18.30 million in 2024 and 24.83% to $13.75 million in 2025. Technological integration of avionics reduced onboard equipment by 50% and ground equipment by 80%, while optimized Guidance, Navigation, and Control (GNC) algorithms cut energy loss by over 15%. However, fixed asset infrastructure totaling $104.95 million (51.58% of non-current assets) continues to drive massive depreciation costs. Accounts receivable turnover deteriorated from 6.07 in 2024 to 2.43 in 2025, though 94.19% of the balance remains aged under one year. Inventory turnover accelerated from 1.11 to 5.92, yet out of $13.34 million in gross inventory, the firm booked a $10.71 million impairment provision tied to loss-making fulfillment costs, leaving a net book value of $2.63 million against $12.29 million in contract liabilities.
Table 1: Segmental Financials & Margin Metrics
| Metric | 2023 | 2024 | 2025 |
|---|---|---|---|
| Total Revenue | $10.81M | $33.95M | $38.53M |
| Rocket Launch Services (Core % of Revenue) | $9.23M (85.76%) | $31.44M (93.01%) | $37.40M (97.50%) |
| Auxiliary Product Sales (% of Revenue) | $0.32M (2.98%) | $2.04M (6.03%) | $0.89M (2.32%) |
| Technical Services (% of Revenue) | $1.21M (11.26%) | — | $0.07M (0.18%) |
| Net Loss Attributable to Shareholders | $(71.20M) | $(119.86M) | $(155.71M) |
| R&D Expenses (R&D-to-Revenue Intensity) | $16.88M (156.10%) | $41.46M (122.13%) | $70.13M (182.00%) |
| Comprehensive Gross Margin | -40.45% | -82.92% | -89.29% |
| Operating Cash Flow (OCF) Net Burn | $(37.88M) | $(78.94M) | $(120.38M) |
| Investing Cash Flow (ICF) Net Burn | $(1.77M) | $(43.34M) | $(154.97M) |
| Total Accounts Receivable (A/R) | $3.54M | $7.14M | $23.22M |
Infrastructure Layout and Regional Moats
CAS Space maintains a structurally disjointed supply chain, operating through specialized, geographically decoupled nodes. The solid rocket pipeline is routed through Guangzhou Equipment (Guangzhou Nansha) for pulse-style assembly, utilizing a 2025 capacity of 12 rockets (6 output, 50.00% utilization, scaled from 4 capacity/1 output/25.00% utilization in 2023 and 9 capacity/4 output/44.44% utilization in 2024). Liquid rocket assembly is based at Shaoxing Equipment, supported by Guangzhou Power (engine testing) and Guangzhou Manufacturing (liquid engine/reusable vehicle production). Shandong Equipment (Yantai) handles sea-launch logistics, while Hainan Equipment (Wenchang) and Jiuquan Tech (Gansu) execute launch and recovery operations across dedicated solid and liquid launch pads.
The supplier matrix exposes an acute, single-point-of-failure risk, heavily concentrated in state-owned propulsion monopolies. Top-five supplier concentration registered 82.37% in 2023, 78.65% in 2024, and 78.51% in 2025. Out of the total $85.09 million raw material procurement in 2025, propulsion systems consumed 55.09% ($46.87 million), structural systems 23.28% ($19.81 million), and avionics 19.39% ($16.50 million). The China Aerospace Science and Technology Corporation (CASC) commanded 60.57% ($51.95 million) of total purchases, followed by Tianjin Aistar ($6.72 million / 7.84%), Shandong Tongqiang ($4.71 million / 5.49%), CASIC ($1.97 million / 2.30%), and Tianjin Hangyu Zhuoran ($1.99 million / 2.32%).
To internalize propulsion and execute a 10x scale-up target of 100 launches per year, CAS Space is executing a highly compartmented $581.62 million IPO capital deployment over synchronized timelines:
* Reusable Large-Scale Rocket R&D ($303.68M / 52.21%): A 36-month (12-quarter) timeline to develop the PR-2H and PR-3.
* Reusable Space Vehicle R&D ($119.28M / 20.51%): A 36-month timeline for Kinetica-Space orbital manufacturing/tourism models.
* Reusable Liquid Engine Base ($47.35M / 8.14%): An accelerated 18-month (6-quarter) facility rollout in Huangpu District. Hardware procurement scales from Q1 Year 1 to Q1 Year 2, personnel recruitment from Q1 Year 1 to Q2 Year 2, and trial production from Q4 Year 1 to Q2 Year 2.
* Working Capital & Debt Repayment ($111.30M / 19.14%): $83.48 million explicitly allocated to retire bank debt, leaving $27.83 million for direct working capital replenishment.
HDIN Institutional Verdict
The mixed-ownership governance structure effectively de-risks R&D while injecting $48.13 million in intellectual property (representing 79.42% of gross intangibles) from the Chinese Academy of Sciences (CAS) Institute of Mechanics via state vehicle Zhongke Lisen (holding 20.58% equity). Founder Yang Yiqiang retains de facto control with 34.71% voting rights via Pengyi Junlian (21.98%), Tianjin Tansuo (1.47%), Huzhou Zhongqing (1.12%), and a concert agreement with Zheng Jun/Guoke Yuhang (10.14%). Additional institutional backing includes the National Industry Investment Fund (2.19%), Guangzhou Chantou (3.89%), Yuexiu Zhichuang (0.87%), and Yuexiu Jinchan (0.47%). Talent retention demands massive share-based compensation: $24.69 million, $20.71 million, and $13.80 million across 2023-2025, covering 97 employees (7.56% equity: 2.66% directors/management, 4.90% staff), locked for 36 months post-IPO.
Shared lab infrastructure dependency relies on negligible financial outlays—$3,937 in 2023/2024 and $14,441 in 2025 for modal/vibration testing. A/R from CAS contracted from $3.01 million (81.41%) in 2023 to $1.76 million (23.52%) in 2024 and $0.68 million in 2025, alongside $0.49 million (2024) and $0.51 million (2025) in prepayments. Original 2023 licensing dependencies yielded $9.23 million (85.34% of revenue) before operational autonomy. A historical $11.13 million insurance claim from the Y6 rocket failure reinforces the immediate revenue-halting threat of mandatory "technological zeroing" mandates.
CAS Space commands a 63% market share (up from 50% in 2024), deploying approximately 6.0 tons of payload in 2025. It eclipses tier-1 private peers: Galactic Energy (>4 tons total, >1 ton LEO 2025, 24 launches/21 successes), LandSpace (<2 tons total, <1 ton LEO 2025, 8/5 successes), Orienspace (>1 ton total/2025, 2/2 successes), Space Pioneer (<1 ton total/2025, 2/1 successes), and i-Space (<1 ton total, <0.5 tons LEO 2025, 8/4 successes). Despite holding the private domestic single-launch record of 26 satellites, CAS Space remains a strategic pursuer compared to SpaceX’s 2025 output of 165 Falcon launches (51% of global orbital launches) with a 22.8-ton LEO capacity and a historical 525/526 success record.
Table 2: Aerospace Pipeline & VTVL Evolution Targets
| Program | LEO/SSO Payload | Operational Target & Recovery Specifications |
|---|---|---|
| Kinetica-1 (PR-1) Solid / Expendable | 2.0 t / 1.5 t | 13/12 historical success rate (92.31%). 95 satellites launched, 17 cumulative tons delivered |
| Kinetica-2 (PR-2) Liquid / Expendable CBC | 12.0 t / 8.0 t | Maiden launch planned Mar 2026. 1 successful mission (2 satellites + 1 spacecraft). Secured 18-satellite contract with Shanghai Yuanxin |
| Kinetica-2H (PR-2H) Reusable | 22.0 t / 15.0 t | Target deployment 2028. Cluster recovery architecture targeting ≥30 reuse cycles |
| Kinetica-3 (PR-3) Fully Reusable | 40.0 t / — | Target deployment 2030. Designed for ≥100 reuse cycles |
| Kinetica-Space Series (Testbeds) | Suborbital / Orbital | K-Space 1: Jan 2026 (100 km parachute landing, precision recovery). K-Space 2: Late 2026 / Q1 2027 (180s microgravity, 3t / 7-person VTVL). K-Space 3: 2028 orbital test platform |
| Liqing-1 LOX/Kerosene Engine | 30-ton class | 294 kN thrust; 50–100% throttling; 3 restarts; >1,500 s cumulative testing; 2026 readiness; ≥30 reuse cycles |
| Liqing-2 LOX/Kerosene Engine | 110-ton class | 1,078 kN thrust; 50–100% throttling; 3 restarts; 1,000 s cumulative testing; 2027 readiness; ≥30 reuse cycles |
*Overall Fleet Data: CAS Space holds a record of 16 total launches (15 successes, 1 failure), placing 107 satellites and 1 spacecraft into orbit, representing over 19 tons of payload. Total backlog demand is anchored by an impending 30,000-satellite national ITU mandate, supported by regional B2B operators (Zhongke Satellite, Microquanta Semiconductor) and 6 international sovereign clients across Oman, Mexico, Pakistan, the UAE, Egypt, and Nepal. Sub-meter precision capabilities have been validated in previous land and sea tests.*
Presentation Download & Video Access:
- Presentation Download: Click the PDF download link under 'Related Topics' to access the full institutional presentation of this report.
- Video Link: Click this link to watch the HDIN analyst briefing on YouTube.
About HDIN Research:
HDIN Research is a premier global market intelligence and strategic advisory firm specializing in institutional-grade financial analysis, supply chain audits, and macroeconomic forecasting. Our dedicated sector analysts deliver actionable, data-driven insights tailored for private equity, hedge funds, and corporate strategy teams. Visit us at http://www.hdinresearch.com.
*2026 AI Transparency Footer:*
"This intelligence report was authored by HDIN Research analysts following a rigorous audit of official corporate filings. AI was utilized for massive-scale data synthesis and structural drafting, ensuring 100% inclusion of reported data points. All strategic insights, financial modeling, and final verdicts were verified by our editorial board to ensure professional accuracy and compliance with 2026 Google Search E-E-A-T standards."