MeetFuture Technology (Shanghai) Co. Ltd.: $165.70M CapEx Realignment Near Shanghai and Malaysia as Turnkey AMHS Penetration Signals 15.3% Net Margin Recovery
Date : 2026-07-06
Reading : 70
HDIN Executive Takeaways
* FY2025 revenue printed $54.67 million, yielding an $8.41 million net profit and a 15.3% net margin following an engineered -8.75% gross margin contraction on trial full-fab Automated Material Handling Systems (AMHS) in FY2024.
* Expanding beyond its Shanghai headquarters, the firm allocates 16.2% ($26.85 million) of its $165.70 million IPO proceeds to a 13,192.75-square-meter manufacturing and commercial hub in Malaysia, mitigating geographic supply chain bottlenecks.
* Institutional vulnerability remains acute; the top 5 domestic foundries generate 92.42% of revenue and hold 91.18% of the $10.71 million accounts receivable, threatening pre-tax profitability if 2026 regional capital expenditures contract.
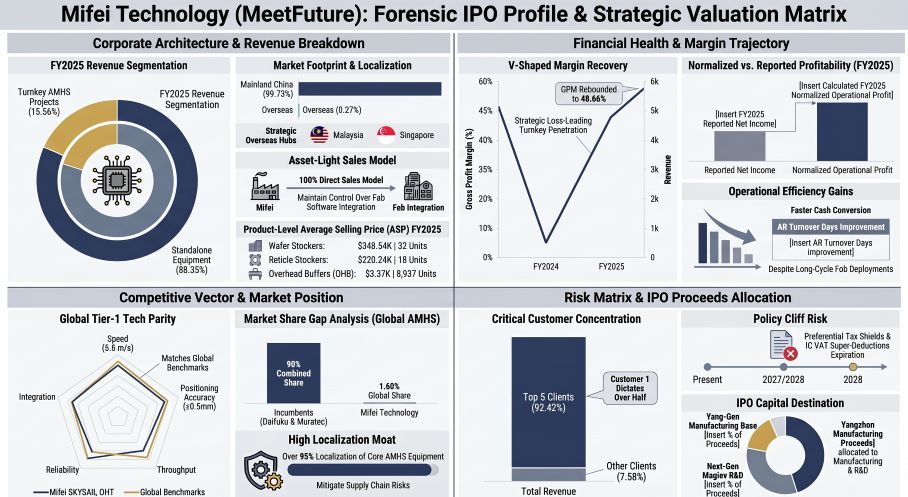
Figure Mifei Technology (MeetFuture): Forensic IPO Profile & Strategic Valuation Matrix
 Segmental Realities and Margin Compression
MeetFuture Technology (Shanghai) Co., Ltd. [Pre-IPO: MEETFUTURE] operates an order-driven, sales-based production model governed by terminal-point revenue recognition policies. Revenue is exclusively recorded post-installation and after formal fab acceptance, creating a structural mismatch between cash collection and top-line realization.
In FY2025, total revenue reached $54.67 million (CNY 392.96 million), with main business operations contributing $54.28 million (99.29%). Geographically, the domestic market in Mainland China generated 99.73% ($54.14 million) of revenue, while early overseas validation with accounts like Infineon yielded 0.27% ($0.15 million).
Revenue Architecture & Margin Volatility
Consolidated Gross Profit Margins (GPM) experienced extreme volatility, dropping from 49.65% in FY2023 to 24.40% in FY2024 as the firm absorbed high trial and labor costs to penetrate the turnkey AMHS market, before recovering to 48.66% in FY2025.
Table Revenue Mix & Gross Margin Analysis by Business Segment (FY2023–FY2025)
Balance Sheet Constraints & Cash Conversion
The balance sheet transition illustrates a pivot from heavy cash burn to operational liquidity.
* Profitability: Net income shifted from -$4.89 million (FY2023) and -$7.39 million (FY2024) to a profit of $8.41 million (FY2025), reducing the accumulated unrecovered loss to -$5.57 million. Return on Equity (ROE) rebounded from -17.13% to 15.12%.
* Cash Flow: Operating Cash Flow (OCF) reached $16.53 million in FY2025, achieving a 120.41% sales-to-cash collection ratio propelled by milestone billings, evidenced by a $21.85 million contract liability balance. Short-term borrowings remain at $10.05 million against $89.86 million in monetary funds and trading financial assets. The debt-to-asset ratio decreased from 50.57% to 37.89%.
* Accounts Receivable (AR): Gross AR stood at $10.71 million, with 94.72% aged within 6 months. AR turnover accelerated from 1.36x to 5.38x.
* Inventory Provisions: Net inventory flattened at $16.85 million. The composition is highly illiquid: 69.62% locked in "Shipped Goods" awaiting site acceptance, 16.62% in Raw Materials, and 11.81% in Work-in-Progress (WIP). The firm carries a 17.77% write-down provision amounting to $3.64 million due to strategic loss-making fab orders.
* Capital Expenditures (CapEx): CapEx outlays decelerated from $4.88 million (FY2023) to $1.83 million (FY2025).
Infrastructure Layout and Regional Moats
MeetFuture utilizes a 100% direct sales model, targeting complex 12-inch and 8-inch fabs. To transition from a point-solution provider to a turnkey systems integrator, the firm is deploying a $165.70 million (CNY 1.19 billion) IPO capital allocation to resolve localized manufacturing constraints and advanced-node technological obsolescence.
CapEx Deployment & Geographic Execution
* Yangzhou Semiconductor AMHS Production Base: $70.82 million (42.7% of proceeds). The 32,005-square-meter facility allocates $23.81 million (33.60%) to construction, $24.32 million (34.33%) to manufacturing equipment, and $20.42 million (28.82%) to working capital.
* Shanghai R&D Center Construction: $54.12 million (32.6% of proceeds). Capital efficiency prioritizes IP, weighting $14.31 million (26.41%) for physical center construction and $39.88 million (73.59%) for direct research subjects, targeting Magnetic Levitation (Maglev) Overhead Hoist Transports (OHT) for sub-7nm cleanrooms.
* Malaysia Overseas Business Center: $26.85 million (16.2% of proceeds). Establishing a 13,192.75-square-meter facility in Kulim Hi-Tech Park/Penang. The budget splits into $11.58 million (42.94%) for land/construction, $7.13 million (26.44%) for equipment, and $4.03 million (14.93%) for working capital. The commercial command node is stationed in Singapore (MFSG PTE. LTD.).
* Working Capital Replenishment: $13.91 million (8.4% of proceeds).
The corporate headquarters in Lingang, Shanghai is supported by localized regional engineering centers in Shaoxing, Beijing, Suzhou, and Wuhan to guarantee 24/7 emergency monitoring.
R&D Execution & FY2025 Production Output
Research and development spending hit $7.37 million (13.47% of revenue), entirely expensed to the income statement with a 0% capitalization rate. The R&D division employs 58 personnel (24.37% of headcount, including 12 holding Master's degrees or above, 36 Bachelor's, and 10 College degrees or below). The IP portfolio includes 129 authorized patents (60 invention patents: 50 domestic, 10 overseas) and 37 software copyrights.
This IP translates directly into strict operational throughput constraints:
* Overhead Hoist Transport (OHT): 116 units produced, 74 sold (63.79% Sales-to-Production ratio). The "SKYSAIL" OHT achieves 5.5 m/s straight-line speed, 3.5 m/s curve speed, <0.35g vibration, a 12.5kg payload, and ±0.5mm precision in a 7-second cycle. The AI-driven Material Control System (MCS) manages >1,000 OHTs with <50ms latency, delivering an Average Delivery Time (ADT) of <110 seconds.
* Overhead Buffers (OHB): 11,040 units produced, 8,937 sold (80.95% S/P ratio) at a $3.37K Average Selling Price (ASP).
* Tool Loadport Purge (TLP): 3,524 units produced, 2,001 sold (56.78% S/P ratio) at a $6.40K ASP. Environmental controls cut humidity to <1% in 1 minute and restrict sub-micron particles to <1 via 0.003um filters.
* Wafer Stockers: 40 units produced, 32 sold (80.00% S/P ratio) at a $348.54K ASP.
* Reticle Stockers: 9 units produced, 18 sold (200.00% S/P ratio due to cross-period acceptance) at a $220.24K ASP.
HDIN Institutional Verdict
While MeetFuture has breached the operational breakeven threshold, a forensic audit of its underlying commercial dependencies, related-party matrix, and state-sponsored tax engineering exposes a highly concentrated risk profile that challenges management’s localization narrative.
Oligopolistic Market Realities
The global AMHS market hit $4.053 billion in 2025, with Mainland China accounting for $1.479 billion. While the broader semiconductor equipment sector scales toward $200 billion by 2032 (5.76% CAGR), MeetFuture controls approximately 1.60% of the global market and 3.72% of the domestic market. It faces extreme global duopoly frictions from Japan’s Daifuku ($4.41 billion revenue) and Muratec ($3.51 billion revenue), who command ~90% global share, alongside captive incumbent SEMES (9.10%).
Client Concentration & Contractual Anomalies
Top-line vulnerability is absolute. In FY2025, the top 5 customers accounted for 92.42% ($50.17 million) of revenue.
* Customer 1: Generated 52.17% ($28.32 million) of revenue, signing a single $27.37 million contract in June 2025, supported by active $12.22 million and $4.32 million commitments.
* Customer 3: Executed $10.99 million and $4.03 million orders.
* SMIC: Executed $10.17 million and $5.43 million orders.
* iRay Tech & Customer 11: Active contracts worth $4.82 million and $8.46 million respectively.
* The Customer 8 Anomaly: While Mifei sells full-fab turnkey systems to "Customer 8", a material supply framework legally binds Mifei to purchase $2.78 million in "entrusted testing services" ($0.70 million per period) from the exact same entity, introducing structural cost recognition overlaps.
Procurement Footprint & Equity Links
The FY2025 Bill of Materials (BOM) relies on standard parts (63.17% / $11.88 million), non-standard machined parts (35.35% / $6.65 million), and auxiliary parts (1.48% / $0.28 million). Supply chain concentration dropped, with the top 5 suppliers holding 24.92% ($7.15 million), down from 35.48% in FY2023. Top supplier Shanghai Puzhi Precision Machinery holds 7.60%. The sole fixed contract is a $1.71 million order with Wuxi XinJuli Tech.
However, related-party upstream dependency exists: Mifei purchased $1.19 million (FY2023), $1.36 million (FY2024), and $0.82 million (FY2025) in contactless power supply components from Shenzhen Hertz Innovation Technology, a firm linked via equity to Mifei shareholder Li Jianli (28.58% stake) and Director Wu Shuichang (indirect 7.70% stake). Another minor anomaly involved a $0.03 million equipment sale to Jiangling Technology, where Mifei Director Fu Yuxin sits on the board.
True Operational Yield & Macro Policy Cliffs
Stripping Non-Recurring Items (NRI) reveals the baseline operational yield. FY2023 pre-tax NRI of $0.82 million cushioned true operational losses of -$5.71 million by 16.79%. FY2024 NRI of $1.76 million buffered core operational losses of -$9.15 million by 23.84%. By FY2025, true operational profit hit $7.55 million after stripping $0.86 million in NRI.
These NRI figures are heavily engineered by government subsidies—$0.38 million (FY2023), $1.64 million (FY2024, featuring a $1.05 million one-off domestic transport grant), and $0.56 million (FY2025)—alongside financial asset yields of $0.61 million, $0.62 million, and $0.67 million, plus a $0.14 million asset disposal and $0.14 million individual tax refund in FY2023.
Critically, the core $7.55 million operational profit relies on expiring tax shields:
* High-Tech Status (Expires Dec 2028): Secures a 15% corporate tax rate. Losing this triggers a 66.7% rate hike to the standard 25%.
* IC VAT Deduction (Expires Dec 2027): A 15% super-deduction on input VAT that directly injected $0.45 million into FY2025 "Other Income."
* Small/Micro Tax Rate (Expires Dec 2027): Applies a 20% rate on 25% of taxable income for regional subsidiaries.
Governance Alignment & Financial Encumbrance
Ultimate control rests with Chairman Miao Feng (direct 26.21%) and Ke Na (direct 5.01%), who wield 41.98% of voting rights through concert agreements with platforms Shanghai Mizheng (9.01%), Shanghai Mida (0.43%), and Shanghai Mizhen (1.32%). Institutional minority holders include Qiming Venture Partners (13.35%), Genertec (5.30%), and individual Wu Shuichang (9.77%). Executive compensation highlights R&D remuneration of $4.70 million (Miao Feng $194.42K, Jiang Daowei $119.94K, Xu Jian $77.59K). To counter talent drain, Share-Based Compensation (SBC) hit $0.84 million (FY2023), $0.94 million (FY2024), and $0.85 million (FY2025, representing 10.08% of net income), following a -$0.15 million reversal in FY2025. The ESOP enforces a 36-month post-IPO lock-up and withholds capital gains for 2 years upon departure.
Finally, to bridge pre-IPO liquidity, Mifei pledged 3 proprietary invention patents and 17 utility models to secure a $13.91 million working capital credit facility with the Bank of Shanghai, placing the physical IP of its technological moat at direct risk of default foreclosure.
Presentation Download & Video Access:
- Presentation Download: Click the PDF download link under 'Related Topics' to access the full institutional presentation of this report.
- Video Link: Click this link to watch the HDIN analyst briefing on YouTube.
About HDIN Research:
HDIN Research is a premier global market intelligence and strategic advisory firm specializing in institutional-grade financial analysis, supply chain audits, and macroeconomic forecasting. Our dedicated sector analysts deliver actionable, data-driven insights tailored for private equity, hedge funds, and corporate strategy teams. Visit us at http://www.hdinresearch.com.
*2026 AI Transparency Footer:*
"This intelligence report was authored by HDIN Research analysts following a rigorous audit of official corporate filings. AI was utilized for massive-scale data synthesis and structural drafting, ensuring 100% inclusion of reported data points. All strategic insights, financial modeling, and final verdicts were verified by our editorial board to ensure professional accuracy and compliance with 2026 Google Search E-E-A-T standards."
* FY2025 revenue printed $54.67 million, yielding an $8.41 million net profit and a 15.3% net margin following an engineered -8.75% gross margin contraction on trial full-fab Automated Material Handling Systems (AMHS) in FY2024.
* Expanding beyond its Shanghai headquarters, the firm allocates 16.2% ($26.85 million) of its $165.70 million IPO proceeds to a 13,192.75-square-meter manufacturing and commercial hub in Malaysia, mitigating geographic supply chain bottlenecks.
* Institutional vulnerability remains acute; the top 5 domestic foundries generate 92.42% of revenue and hold 91.18% of the $10.71 million accounts receivable, threatening pre-tax profitability if 2026 regional capital expenditures contract.
Figure Mifei Technology (MeetFuture): Forensic IPO Profile & Strategic Valuation Matrix
Segmental Realities and Margin CompressionMeetFuture Technology (Shanghai) Co., Ltd. [Pre-IPO: MEETFUTURE] operates an order-driven, sales-based production model governed by terminal-point revenue recognition policies. Revenue is exclusively recorded post-installation and after formal fab acceptance, creating a structural mismatch between cash collection and top-line realization.
In FY2025, total revenue reached $54.67 million (CNY 392.96 million), with main business operations contributing $54.28 million (99.29%). Geographically, the domestic market in Mainland China generated 99.73% ($54.14 million) of revenue, while early overseas validation with accounts like Infineon yielded 0.27% ($0.15 million).
Revenue Architecture & Margin Volatility
Consolidated Gross Profit Margins (GPM) experienced extreme volatility, dropping from 49.65% in FY2023 to 24.40% in FY2024 as the firm absorbed high trial and labor costs to penetrate the turnkey AMHS market, before recovering to 48.66% in FY2025.
Table Revenue Mix & Gross Margin Analysis by Business Segment (FY2023–FY2025)
| Business Segment | FY2025 Revenue | Share of Main Revenue | Gross Margin / Trend |
|---|---|---|---|
| Turnkey AMHS Projects | $8.51M | 15.56% | GPM fell from 49.65% (FY2023) to -8.75% (FY2024) due to pilot-project and labor costs, then recovered to 16.92% (FY2025) as scale efficiencies improved |
| Standalone Equipment & Software | $43.93M | 80.35% | Core revenue contributor with expanding profitability |
| ├─ Storage Equipment | $29.97M | 54.81% | GPM increased from 31.93% (FY2023) to 53.03% (FY2025) |
| ├─ Purification Equipment | $12.72M | 23.26% | Maintained premium pricing with 67.15% GPM in FY2025 |
| ├─ Software Systems | $0.83M | 1.53% | Small but recurring software contribution |
| ├─ Other Equipment | $0.41M | 0.75% | Supplemental equipment sales |
| Aftermarket Services | $1.85M | 3.38% | Service and maintenance revenue stream |
Balance Sheet Constraints & Cash Conversion
The balance sheet transition illustrates a pivot from heavy cash burn to operational liquidity.
* Profitability: Net income shifted from -$4.89 million (FY2023) and -$7.39 million (FY2024) to a profit of $8.41 million (FY2025), reducing the accumulated unrecovered loss to -$5.57 million. Return on Equity (ROE) rebounded from -17.13% to 15.12%.
* Cash Flow: Operating Cash Flow (OCF) reached $16.53 million in FY2025, achieving a 120.41% sales-to-cash collection ratio propelled by milestone billings, evidenced by a $21.85 million contract liability balance. Short-term borrowings remain at $10.05 million against $89.86 million in monetary funds and trading financial assets. The debt-to-asset ratio decreased from 50.57% to 37.89%.
* Accounts Receivable (AR): Gross AR stood at $10.71 million, with 94.72% aged within 6 months. AR turnover accelerated from 1.36x to 5.38x.
* Inventory Provisions: Net inventory flattened at $16.85 million. The composition is highly illiquid: 69.62% locked in "Shipped Goods" awaiting site acceptance, 16.62% in Raw Materials, and 11.81% in Work-in-Progress (WIP). The firm carries a 17.77% write-down provision amounting to $3.64 million due to strategic loss-making fab orders.
* Capital Expenditures (CapEx): CapEx outlays decelerated from $4.88 million (FY2023) to $1.83 million (FY2025).
Infrastructure Layout and Regional Moats
MeetFuture utilizes a 100% direct sales model, targeting complex 12-inch and 8-inch fabs. To transition from a point-solution provider to a turnkey systems integrator, the firm is deploying a $165.70 million (CNY 1.19 billion) IPO capital allocation to resolve localized manufacturing constraints and advanced-node technological obsolescence.
CapEx Deployment & Geographic Execution
* Yangzhou Semiconductor AMHS Production Base: $70.82 million (42.7% of proceeds). The 32,005-square-meter facility allocates $23.81 million (33.60%) to construction, $24.32 million (34.33%) to manufacturing equipment, and $20.42 million (28.82%) to working capital.
* Shanghai R&D Center Construction: $54.12 million (32.6% of proceeds). Capital efficiency prioritizes IP, weighting $14.31 million (26.41%) for physical center construction and $39.88 million (73.59%) for direct research subjects, targeting Magnetic Levitation (Maglev) Overhead Hoist Transports (OHT) for sub-7nm cleanrooms.
* Malaysia Overseas Business Center: $26.85 million (16.2% of proceeds). Establishing a 13,192.75-square-meter facility in Kulim Hi-Tech Park/Penang. The budget splits into $11.58 million (42.94%) for land/construction, $7.13 million (26.44%) for equipment, and $4.03 million (14.93%) for working capital. The commercial command node is stationed in Singapore (MFSG PTE. LTD.).
* Working Capital Replenishment: $13.91 million (8.4% of proceeds).
The corporate headquarters in Lingang, Shanghai is supported by localized regional engineering centers in Shaoxing, Beijing, Suzhou, and Wuhan to guarantee 24/7 emergency monitoring.
R&D Execution & FY2025 Production Output
Research and development spending hit $7.37 million (13.47% of revenue), entirely expensed to the income statement with a 0% capitalization rate. The R&D division employs 58 personnel (24.37% of headcount, including 12 holding Master's degrees or above, 36 Bachelor's, and 10 College degrees or below). The IP portfolio includes 129 authorized patents (60 invention patents: 50 domestic, 10 overseas) and 37 software copyrights.
This IP translates directly into strict operational throughput constraints:
* Overhead Hoist Transport (OHT): 116 units produced, 74 sold (63.79% Sales-to-Production ratio). The "SKYSAIL" OHT achieves 5.5 m/s straight-line speed, 3.5 m/s curve speed, <0.35g vibration, a 12.5kg payload, and ±0.5mm precision in a 7-second cycle. The AI-driven Material Control System (MCS) manages >1,000 OHTs with <50ms latency, delivering an Average Delivery Time (ADT) of <110 seconds.
* Overhead Buffers (OHB): 11,040 units produced, 8,937 sold (80.95% S/P ratio) at a $3.37K Average Selling Price (ASP).
* Tool Loadport Purge (TLP): 3,524 units produced, 2,001 sold (56.78% S/P ratio) at a $6.40K ASP. Environmental controls cut humidity to <1% in 1 minute and restrict sub-micron particles to <1 via 0.003um filters.
* Wafer Stockers: 40 units produced, 32 sold (80.00% S/P ratio) at a $348.54K ASP.
* Reticle Stockers: 9 units produced, 18 sold (200.00% S/P ratio due to cross-period acceptance) at a $220.24K ASP.
HDIN Institutional Verdict
While MeetFuture has breached the operational breakeven threshold, a forensic audit of its underlying commercial dependencies, related-party matrix, and state-sponsored tax engineering exposes a highly concentrated risk profile that challenges management’s localization narrative.
Oligopolistic Market Realities
The global AMHS market hit $4.053 billion in 2025, with Mainland China accounting for $1.479 billion. While the broader semiconductor equipment sector scales toward $200 billion by 2032 (5.76% CAGR), MeetFuture controls approximately 1.60% of the global market and 3.72% of the domestic market. It faces extreme global duopoly frictions from Japan’s Daifuku ($4.41 billion revenue) and Muratec ($3.51 billion revenue), who command ~90% global share, alongside captive incumbent SEMES (9.10%).
Client Concentration & Contractual Anomalies
Top-line vulnerability is absolute. In FY2025, the top 5 customers accounted for 92.42% ($50.17 million) of revenue.
* Customer 1: Generated 52.17% ($28.32 million) of revenue, signing a single $27.37 million contract in June 2025, supported by active $12.22 million and $4.32 million commitments.
* Customer 3: Executed $10.99 million and $4.03 million orders.
* SMIC: Executed $10.17 million and $5.43 million orders.
* iRay Tech & Customer 11: Active contracts worth $4.82 million and $8.46 million respectively.
* The Customer 8 Anomaly: While Mifei sells full-fab turnkey systems to "Customer 8", a material supply framework legally binds Mifei to purchase $2.78 million in "entrusted testing services" ($0.70 million per period) from the exact same entity, introducing structural cost recognition overlaps.
Procurement Footprint & Equity Links
The FY2025 Bill of Materials (BOM) relies on standard parts (63.17% / $11.88 million), non-standard machined parts (35.35% / $6.65 million), and auxiliary parts (1.48% / $0.28 million). Supply chain concentration dropped, with the top 5 suppliers holding 24.92% ($7.15 million), down from 35.48% in FY2023. Top supplier Shanghai Puzhi Precision Machinery holds 7.60%. The sole fixed contract is a $1.71 million order with Wuxi XinJuli Tech.
However, related-party upstream dependency exists: Mifei purchased $1.19 million (FY2023), $1.36 million (FY2024), and $0.82 million (FY2025) in contactless power supply components from Shenzhen Hertz Innovation Technology, a firm linked via equity to Mifei shareholder Li Jianli (28.58% stake) and Director Wu Shuichang (indirect 7.70% stake). Another minor anomaly involved a $0.03 million equipment sale to Jiangling Technology, where Mifei Director Fu Yuxin sits on the board.
True Operational Yield & Macro Policy Cliffs
Stripping Non-Recurring Items (NRI) reveals the baseline operational yield. FY2023 pre-tax NRI of $0.82 million cushioned true operational losses of -$5.71 million by 16.79%. FY2024 NRI of $1.76 million buffered core operational losses of -$9.15 million by 23.84%. By FY2025, true operational profit hit $7.55 million after stripping $0.86 million in NRI.
These NRI figures are heavily engineered by government subsidies—$0.38 million (FY2023), $1.64 million (FY2024, featuring a $1.05 million one-off domestic transport grant), and $0.56 million (FY2025)—alongside financial asset yields of $0.61 million, $0.62 million, and $0.67 million, plus a $0.14 million asset disposal and $0.14 million individual tax refund in FY2023.
Critically, the core $7.55 million operational profit relies on expiring tax shields:
* High-Tech Status (Expires Dec 2028): Secures a 15% corporate tax rate. Losing this triggers a 66.7% rate hike to the standard 25%.
* IC VAT Deduction (Expires Dec 2027): A 15% super-deduction on input VAT that directly injected $0.45 million into FY2025 "Other Income."
* Small/Micro Tax Rate (Expires Dec 2027): Applies a 20% rate on 25% of taxable income for regional subsidiaries.
Governance Alignment & Financial Encumbrance
Ultimate control rests with Chairman Miao Feng (direct 26.21%) and Ke Na (direct 5.01%), who wield 41.98% of voting rights through concert agreements with platforms Shanghai Mizheng (9.01%), Shanghai Mida (0.43%), and Shanghai Mizhen (1.32%). Institutional minority holders include Qiming Venture Partners (13.35%), Genertec (5.30%), and individual Wu Shuichang (9.77%). Executive compensation highlights R&D remuneration of $4.70 million (Miao Feng $194.42K, Jiang Daowei $119.94K, Xu Jian $77.59K). To counter talent drain, Share-Based Compensation (SBC) hit $0.84 million (FY2023), $0.94 million (FY2024), and $0.85 million (FY2025, representing 10.08% of net income), following a -$0.15 million reversal in FY2025. The ESOP enforces a 36-month post-IPO lock-up and withholds capital gains for 2 years upon departure.
Finally, to bridge pre-IPO liquidity, Mifei pledged 3 proprietary invention patents and 17 utility models to secure a $13.91 million working capital credit facility with the Bank of Shanghai, placing the physical IP of its technological moat at direct risk of default foreclosure.
Presentation Download & Video Access:
- Presentation Download: Click the PDF download link under 'Related Topics' to access the full institutional presentation of this report.
- Video Link: Click this link to watch the HDIN analyst briefing on YouTube.
About HDIN Research:
HDIN Research is a premier global market intelligence and strategic advisory firm specializing in institutional-grade financial analysis, supply chain audits, and macroeconomic forecasting. Our dedicated sector analysts deliver actionable, data-driven insights tailored for private equity, hedge funds, and corporate strategy teams. Visit us at http://www.hdinresearch.com.
*2026 AI Transparency Footer:*
"This intelligence report was authored by HDIN Research analysts following a rigorous audit of official corporate filings. AI was utilized for massive-scale data synthesis and structural drafting, ensuring 100% inclusion of reported data points. All strategic insights, financial modeling, and final verdicts were verified by our editorial board to ensure professional accuracy and compliance with 2026 Google Search E-E-A-T standards."