General Mills Inc.: $1,802.9 Million Asset Impairment Near Joplin as 1,220-Bps GAAP Margin Compression Signals Accelerate Strategy Overhaul
Date : 2026-07-07
Reading : 300
HDIN Executive Takeaways
* General Mills Inc. absorbed $1,802.9 million in non-cash impairments, driving a 1,220 basis point GAAP margin compression to 4.8% and a $(87.6) million net loss.
* Supply chain restructuring spans 41 global facilities, triggering $101 million in targeted charges and an exit from Brazil via a $143.1 million divestiture, concentrating production in core North American hubs.
* Management projects flat-to-negative FY2027 organic sales (-1.5% to +0.5%) and an 8% to 13% adjusted operating profit contraction, prioritizing 95% free cash flow conversion over volume expansion amid 4% to 5% input cost inflation.
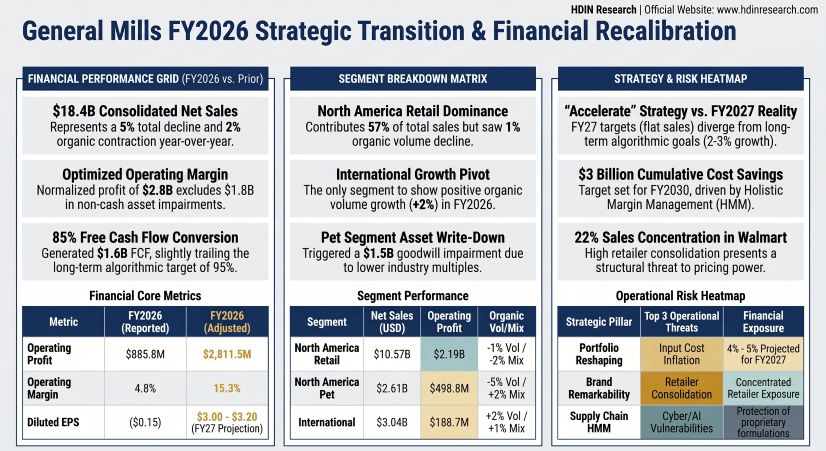
Figure General Mills FY2026 Strategic Transition & Financial Recalibration
 Segmental Realities and Margin Compression
General Mills Inc. reported a consolidated top-line contraction, with FY2026 net sales falling 5% year-over-year to $18,424.6 million. Organic net sales declined 2%, structurally driven by an 8-point decrease in volume growth contributions that completely negated a 2-point benefit from net price realization and mix. Weak consumer sentiment, the rising impact of weight-loss drugs, and shifting dietary demands toward "better-for-you" proteins forced slower volume recoveries.
Profitability metrics indicate severe GAAP compression masked by stable underlying cash generation. Gross margins contracted by 100 basis points to 33.6%, pressured by a $12,228.9 million cost of sales (COGS) base and 4% broad-based global input cost inflation. To offset this, the Holistic Margin Management (HMM) program yielded savings equivalent to 5% of COGS, augmented by $100 million in global transformation savings. While GAAP operating profit fell 73% to $885.8 million (yielding a 4.8% margin, a 1,220 basis point contraction), adjusted operating profit stood at $2,811.5 million, maintaining a 15.3% margin (a 190 basis point contraction, or a 16% decline on a constant-currency basis).
The disparity between the reported GAAP net loss attributable to General Mills Inc. of $(87.6) million (or a net loss of $(85.3) million including noncontrolling interests) and the $2,166.2 million in operating cash flow is governed by massive non-cash adjustments. The $2.25 billion positive divergence includes $2,897.7 million in non-cash restructuring, transformation, and impairment costs, $555.2 million in depreciation and amortization, offset by a $1,049.4 million non-cash divestiture gain. Free cash flow (FCF) reached $1,626.3 million, achieving an 85% conversion rate against adjusted earnings, falling short of the 95% algorithmic target.
Table FY2026 Product Class & Segment Performance Breakdown
Capital allocation strictly prioritizes shareholder returns over internal asset retention. Total capital returned reached $1,815.6 million (~111% of FCF), comprising $1,315.3 million in dividends ($2.44 per share) and $500.3 million via the repurchase of 10 million shares, aligning with the 80% to 90% target FCF distribution model. Core working capital net liabilities improved by $138 million (decreasing 46% from $303 million in FY2025 to $165 million in FY2026). Total debt and noncontrolling interests equal $13.6 billion, strictly divided into $1,053.6 million in current long-term debt and $12,416.0 million in long-term debt, backed by $491.7 million in cash and cash equivalents (including $37.9 million classified as held for sale).
Infrastructure Layout and Regional Moats
General Mills Inc. operates 41 principal production facilities, exposing 79.8% ($14,704.7 million) of its revenue to the United States and 20.2% ($3,719.9 million) to international markets. The operational network utilizes approximately 16 million square feet of nearly entirely leased warehouse space.
* United States (27 Hubs): Key automated centers include Belvidere, IL; Cedar Rapids, IA; Covington, GA; Buffalo, NY; Cincinnati, OH; and Joplin, MO.
* Greater China (4 Hubs): Sanhe, Shanghai, Guangzhou, and Nanjing.
* Europe/Australia (5 Hubs): Rooty Hill, Australia; San Adrian, Spain; Arras and Labatut, France; and Inofita, Greece.
* Latin America (3 Hubs): Irapuato, Mexico; and Campo Novo do Parecis and Pouso Alegre, Brazil (prior to pending divestiture).
* Rest of World (2 Hubs): Nashik, India; and 1 leased facility in Canada.
Supply chain optimization efforts generated $2,970.8 million in restructuring, transformation, impairment, and exit costs. A multi-year supply chain initiative expects to incur $101 million in total charges; FY2026 recognized $95.4 million ($71.0 million in asset write-offs and $24.4 million in severance). Environmental remediation liabilities remain active in Minneapolis, Minnesota, and Moonachie, New Jersey. Supply inputs (grains, meat, vegetable oils) face structural inflation and geopolitical supply chain risks stemming from Russian Federation and Ukraine sanctions, requiring advanced physical purchases and derivative swaps.
Customer consolidation poses a systemic margin threat. Walmart Inc. accounts for 22% of consolidated net sales and 31% of the North America Retail segment. The top five customers represent 54% of total sales, 57% of North America Retail, 66% of North America Pet, and 30% of North America Foodservice. Despite 1-point deceleration in category pound volume, North America Retail held or grew pound share in 65% of U.S. categories. North America Pet retail sales growth improved 1 point versus FY2025 trends, though organic net sales slowed 3 points due to retailer inventory adjustments.
To execute the "Accelerate" strategy and defend against generic labels, the company deployed $256.0 million toward Research and Development (down from $256.6 million in FY2025 and $257.8 million in FY2024), focusing on nutritional profiling and proprietary, patent-protected formulas. Under the guidance of a newly appointed Chief Digital, Technology and Transformation Officer (CDTTO), AI is integrated across the supply chain. The firm mitigates operational disruption via NIST Cybersecurity Framework audits, red-team penetration testing, and $164.4 million in financial guarantees for nonconsolidated affiliates, primarily the Cereal Partners Worldwide (CPW) joint venture.
Tax Profile, Balance Sheet Adjustments, and Contingent Liabilities
Asset valuations endured severe downward revisions totaling $1,802.9 million. The North America Pet unit absorbed a $1,500.0 million non-cash goodwill impairment driven by increased discount rates and market multiple contraction. Brand intangibles recorded $302.9 million in impairments: $52.9 million against Uncle Toby’s and $250.0 million against Nudges and True Chews. Total consolidated Goodwill ended at $14,122.4 million (North America Retail: $6,318.2 million; North America Pet: $5,617.6 million; International: $978.2 million; North America Foodservice: $755.3 million; Corporate/JV: $453.1 million). Management notes that both the Blue Buffalo and Progresso brand intangible assets face a risk of decreasing valuation coverage cushions.
Portfolio reshaping via M&A generated disparate tax and balance sheet effects. The divestiture of the U.S. yogurt business yielded $1,798 million in cash, creating a $1,046.5 million pre-tax gain. The company agreed to sell its Brazil business to Café Três Corações S.A. for a base price of R$800.0 million ($143.1 million USD at 1 USD = 5.5891 BRL), booking a $1,031.8 million non-cash valuation loss. Prior acquisitions included Whitebridge Pet Brands for $1.4 billion (FY2025) and a European pet business for $434.1 million (FY2024).
The effective income tax rate surged to 102.2%, deviating 81.2 percentage points from the 21.0% federal statutory rate. This was inflated by nondeductible goodwill (+85.7 points), state/local taxes in CA, IL, TX (+13.1 points), a Swiss basis difference (+11.2 points), and other foreign jurisdictions (+2.8 points). Favorable offsets included basis difference changes (-15.2 points), valuation allowance changes (-8.2 points), and R&D credits (-4.3 points). The One Big Beautiful Bill Act (OBBBA) enacted on July 4, 2025, altered cash tax timings but left income tax expense materially unaffected. Unrecognized tax benefits stand at $203.9 million ($94.5 million favorable if recognized).
* Deferred Taxes: Gross DTAs total $572.8 million (Compensation $119.1 million; Tax credits $89.8 million; Pensions $62.9 million; NOLs $35.7 million), offset by a $214.6 million valuation allowance primarily targeting legacy Pillsbury losses ($109.0 million), state/foreign losses ($50.1 million), and capital losses ($26.5 million). Gross DTLs of $2,624.0 million (Brands $1,341.5 million; Stock/investments $532.5 million; Fixed assets $394.3 million; Intangibles $199.0 million) result in a Net DTL position of $2,265.8 million.
* Pensions & Leases: The Defined Benefit Pension obligations equal $5,659.1 million against assets of $5,376.4 million, yielding a $(282.7) million underfunded status (5.72% discount rate). Other Postretirement Benefits hold $481.7 million in assets versus $315.6 million in obligations, yielding a $166.1 million surplus (5.54% rate). Postemployment plans are unfunded at $(117.8) million (4.97% rate). A 100-basis-point reduction in rates increases expense by $26 million. Future pension payments mandate $372.6 million for FY2027 and $1,969.5 million for FY2032-2036. A $2,000.0 million unrecognized actuarial net loss overhangs future cash flows. Operating lease liabilities present value at $402.4 million (5.0-year weighted average term, 4.7% discount rate), with finance leases at $0.4 million. Undiscounted lease obligations total $456.2 million (FY2027: $118.4 million; FY2028: $100.3 million; FY2029: $78.5 million; FY2030: $51.4 million; FY2031: $38.3 million; Thereafter: $69.3 million), alongside $95.5 million in uncommenced commitments.
* Contingencies: The Brazilian tax authority (RFB) proposes disallowing goodwill amortization from the Yoki Alimentos S.A. acquisition for tax years 2012–2020. Domestically, the IRS is auditing FY2018–2022, disputing a FY2019 capital loss.
HDIN Institutional Verdict
General Mills Inc. enters FY2027 operating well outside its "Accelerate" long-term algorithmic targets (which call for 2% to 3% organic growth and mid-single-digit EPS expansion). Executive compensation—tied to Performance Share Units (PSUs) utilizing 3-year organic sales, cumulative operating cash flow, and a relative Total Shareholder Return (TSR) modifier—will penalize management for the FY2026 structural shortfalls.
FY2027 guidance dictates an organic net sales trajectory of -1.5% to +0.5% and adjusted diluted EPS of $3.00 to $3.20. Adjusted operating profit will contract 8% to 13% on a constant-currency basis from the $2,811.5 million baseline. A 9-point operating profit headwind and an 11-point EPS headwind will materialize as the firm laps a 53-week prior year (which alone subtracts 2% from reported sales), normalizes corporate incentive expenses, and digests divestiture offsets.
To bridge this valuation gap, management will cap capital expenditures at 3% of net sales (FY2026 CapEx stood at $539.9 million, down $85 million year-over-year) and mandate $750 million in FY2027 cost savings. This is the first tranche of a $3 billion cumulative cost reduction target for FY2030, comprising $2 billion from HMM initiatives (~4% annual COGS reduction) and $1 billion from supply chain restructuring. In the absence of pricing elasticity, General Mills Inc. is now strictly a margin defense and capital return thesis.
Presentation Download & Video Access:
- Presentation Download: Click the PDF download link under 'Related Topics' to access the full institutional presentation of this report.
- Video Link: Click this link to watch the HDIN analyst briefing on YouTube.
About HDIN Research:
HDIN Research is a premier global market intelligence and strategic advisory firm specializing in institutional-grade financial analysis, supply chain audits, and macroeconomic forecasting. Our dedicated sector analysts deliver actionable, data-driven insights tailored for private equity, hedge funds, and corporate strategy teams. Visit us at http://www.hdinresearch.com.
2026 AI Transparency Footer:
"This intelligence report was authored by HDIN Research analysts following a rigorous audit of official corporate filings. AI was utilized for massive-scale data synthesis and structural drafting, ensuring 100% inclusion of reported data points. All strategic insights, financial modeling, and final verdicts were verified by our editorial board to ensure professional accuracy and compliance with 2026 Google Search E-E-A-T standards."
* General Mills Inc. absorbed $1,802.9 million in non-cash impairments, driving a 1,220 basis point GAAP margin compression to 4.8% and a $(87.6) million net loss.
* Supply chain restructuring spans 41 global facilities, triggering $101 million in targeted charges and an exit from Brazil via a $143.1 million divestiture, concentrating production in core North American hubs.
* Management projects flat-to-negative FY2027 organic sales (-1.5% to +0.5%) and an 8% to 13% adjusted operating profit contraction, prioritizing 95% free cash flow conversion over volume expansion amid 4% to 5% input cost inflation.
Figure General Mills FY2026 Strategic Transition & Financial Recalibration
Segmental Realities and Margin CompressionGeneral Mills Inc. reported a consolidated top-line contraction, with FY2026 net sales falling 5% year-over-year to $18,424.6 million. Organic net sales declined 2%, structurally driven by an 8-point decrease in volume growth contributions that completely negated a 2-point benefit from net price realization and mix. Weak consumer sentiment, the rising impact of weight-loss drugs, and shifting dietary demands toward "better-for-you" proteins forced slower volume recoveries.
Profitability metrics indicate severe GAAP compression masked by stable underlying cash generation. Gross margins contracted by 100 basis points to 33.6%, pressured by a $12,228.9 million cost of sales (COGS) base and 4% broad-based global input cost inflation. To offset this, the Holistic Margin Management (HMM) program yielded savings equivalent to 5% of COGS, augmented by $100 million in global transformation savings. While GAAP operating profit fell 73% to $885.8 million (yielding a 4.8% margin, a 1,220 basis point contraction), adjusted operating profit stood at $2,811.5 million, maintaining a 15.3% margin (a 190 basis point contraction, or a 16% decline on a constant-currency basis).
The disparity between the reported GAAP net loss attributable to General Mills Inc. of $(87.6) million (or a net loss of $(85.3) million including noncontrolling interests) and the $2,166.2 million in operating cash flow is governed by massive non-cash adjustments. The $2.25 billion positive divergence includes $2,897.7 million in non-cash restructuring, transformation, and impairment costs, $555.2 million in depreciation and amortization, offset by a $1,049.4 million non-cash divestiture gain. Free cash flow (FCF) reached $1,626.3 million, achieving an 85% conversion rate against adjusted earnings, falling short of the 95% algorithmic target.
Table FY2026 Product Class & Segment Performance Breakdown
| Product Class | FY2026 Net Sales (USD M) | Portfolio Allocation | Segment | Net Sales (USD M) | Operating Profit (USD M) | Reported Sales Growth | Organic Volume |
|---|---|---|---|---|---|---|---|
| Snacks | $4,138.5M | 22.4% | North America Retail | $10,571.8M | $2,189.0M | -11% | -1 pt |
| Cereal | $3,089.7M | 16.7% | International | $3,043.8M | $188.7M | +9% | +2 pts |
| Convenient Meals | $2,870.9M | 15.5% | North America Pet | $2,613.3M | $498.8M | +6% | -5 pts |
| Pet | $2,766.4M | 15.0% | North America Foodservice | $2,169.5M | $333.0M | -6% | -2 pts |
| Refined & Frozen Dough | $2,396.0M | 13.0% | — | — | — | — | — |
| Baking Mixes / Ingredients | $1,926.1M | 10.4% | — | — | — | — | — |
| Super-Premium Ice Cream | $782.7M | 4.2% | — | — | — | — | — |
| Yogurt | $102.0M | 0.5% | — | — | — | — | — |
| Other | $352.3M | 1.9% | — | — | — | — | — |
Capital allocation strictly prioritizes shareholder returns over internal asset retention. Total capital returned reached $1,815.6 million (~111% of FCF), comprising $1,315.3 million in dividends ($2.44 per share) and $500.3 million via the repurchase of 10 million shares, aligning with the 80% to 90% target FCF distribution model. Core working capital net liabilities improved by $138 million (decreasing 46% from $303 million in FY2025 to $165 million in FY2026). Total debt and noncontrolling interests equal $13.6 billion, strictly divided into $1,053.6 million in current long-term debt and $12,416.0 million in long-term debt, backed by $491.7 million in cash and cash equivalents (including $37.9 million classified as held for sale).
Infrastructure Layout and Regional Moats
General Mills Inc. operates 41 principal production facilities, exposing 79.8% ($14,704.7 million) of its revenue to the United States and 20.2% ($3,719.9 million) to international markets. The operational network utilizes approximately 16 million square feet of nearly entirely leased warehouse space.
* United States (27 Hubs): Key automated centers include Belvidere, IL; Cedar Rapids, IA; Covington, GA; Buffalo, NY; Cincinnati, OH; and Joplin, MO.
* Greater China (4 Hubs): Sanhe, Shanghai, Guangzhou, and Nanjing.
* Europe/Australia (5 Hubs): Rooty Hill, Australia; San Adrian, Spain; Arras and Labatut, France; and Inofita, Greece.
* Latin America (3 Hubs): Irapuato, Mexico; and Campo Novo do Parecis and Pouso Alegre, Brazil (prior to pending divestiture).
* Rest of World (2 Hubs): Nashik, India; and 1 leased facility in Canada.
Supply chain optimization efforts generated $2,970.8 million in restructuring, transformation, impairment, and exit costs. A multi-year supply chain initiative expects to incur $101 million in total charges; FY2026 recognized $95.4 million ($71.0 million in asset write-offs and $24.4 million in severance). Environmental remediation liabilities remain active in Minneapolis, Minnesota, and Moonachie, New Jersey. Supply inputs (grains, meat, vegetable oils) face structural inflation and geopolitical supply chain risks stemming from Russian Federation and Ukraine sanctions, requiring advanced physical purchases and derivative swaps.
Customer consolidation poses a systemic margin threat. Walmart Inc. accounts for 22% of consolidated net sales and 31% of the North America Retail segment. The top five customers represent 54% of total sales, 57% of North America Retail, 66% of North America Pet, and 30% of North America Foodservice. Despite 1-point deceleration in category pound volume, North America Retail held or grew pound share in 65% of U.S. categories. North America Pet retail sales growth improved 1 point versus FY2025 trends, though organic net sales slowed 3 points due to retailer inventory adjustments.
To execute the "Accelerate" strategy and defend against generic labels, the company deployed $256.0 million toward Research and Development (down from $256.6 million in FY2025 and $257.8 million in FY2024), focusing on nutritional profiling and proprietary, patent-protected formulas. Under the guidance of a newly appointed Chief Digital, Technology and Transformation Officer (CDTTO), AI is integrated across the supply chain. The firm mitigates operational disruption via NIST Cybersecurity Framework audits, red-team penetration testing, and $164.4 million in financial guarantees for nonconsolidated affiliates, primarily the Cereal Partners Worldwide (CPW) joint venture.
Tax Profile, Balance Sheet Adjustments, and Contingent Liabilities
Asset valuations endured severe downward revisions totaling $1,802.9 million. The North America Pet unit absorbed a $1,500.0 million non-cash goodwill impairment driven by increased discount rates and market multiple contraction. Brand intangibles recorded $302.9 million in impairments: $52.9 million against Uncle Toby’s and $250.0 million against Nudges and True Chews. Total consolidated Goodwill ended at $14,122.4 million (North America Retail: $6,318.2 million; North America Pet: $5,617.6 million; International: $978.2 million; North America Foodservice: $755.3 million; Corporate/JV: $453.1 million). Management notes that both the Blue Buffalo and Progresso brand intangible assets face a risk of decreasing valuation coverage cushions.
Portfolio reshaping via M&A generated disparate tax and balance sheet effects. The divestiture of the U.S. yogurt business yielded $1,798 million in cash, creating a $1,046.5 million pre-tax gain. The company agreed to sell its Brazil business to Café Três Corações S.A. for a base price of R$800.0 million ($143.1 million USD at 1 USD = 5.5891 BRL), booking a $1,031.8 million non-cash valuation loss. Prior acquisitions included Whitebridge Pet Brands for $1.4 billion (FY2025) and a European pet business for $434.1 million (FY2024).
The effective income tax rate surged to 102.2%, deviating 81.2 percentage points from the 21.0% federal statutory rate. This was inflated by nondeductible goodwill (+85.7 points), state/local taxes in CA, IL, TX (+13.1 points), a Swiss basis difference (+11.2 points), and other foreign jurisdictions (+2.8 points). Favorable offsets included basis difference changes (-15.2 points), valuation allowance changes (-8.2 points), and R&D credits (-4.3 points). The One Big Beautiful Bill Act (OBBBA) enacted on July 4, 2025, altered cash tax timings but left income tax expense materially unaffected. Unrecognized tax benefits stand at $203.9 million ($94.5 million favorable if recognized).
* Deferred Taxes: Gross DTAs total $572.8 million (Compensation $119.1 million; Tax credits $89.8 million; Pensions $62.9 million; NOLs $35.7 million), offset by a $214.6 million valuation allowance primarily targeting legacy Pillsbury losses ($109.0 million), state/foreign losses ($50.1 million), and capital losses ($26.5 million). Gross DTLs of $2,624.0 million (Brands $1,341.5 million; Stock/investments $532.5 million; Fixed assets $394.3 million; Intangibles $199.0 million) result in a Net DTL position of $2,265.8 million.
* Pensions & Leases: The Defined Benefit Pension obligations equal $5,659.1 million against assets of $5,376.4 million, yielding a $(282.7) million underfunded status (5.72% discount rate). Other Postretirement Benefits hold $481.7 million in assets versus $315.6 million in obligations, yielding a $166.1 million surplus (5.54% rate). Postemployment plans are unfunded at $(117.8) million (4.97% rate). A 100-basis-point reduction in rates increases expense by $26 million. Future pension payments mandate $372.6 million for FY2027 and $1,969.5 million for FY2032-2036. A $2,000.0 million unrecognized actuarial net loss overhangs future cash flows. Operating lease liabilities present value at $402.4 million (5.0-year weighted average term, 4.7% discount rate), with finance leases at $0.4 million. Undiscounted lease obligations total $456.2 million (FY2027: $118.4 million; FY2028: $100.3 million; FY2029: $78.5 million; FY2030: $51.4 million; FY2031: $38.3 million; Thereafter: $69.3 million), alongside $95.5 million in uncommenced commitments.
* Contingencies: The Brazilian tax authority (RFB) proposes disallowing goodwill amortization from the Yoki Alimentos S.A. acquisition for tax years 2012–2020. Domestically, the IRS is auditing FY2018–2022, disputing a FY2019 capital loss.
HDIN Institutional Verdict
General Mills Inc. enters FY2027 operating well outside its "Accelerate" long-term algorithmic targets (which call for 2% to 3% organic growth and mid-single-digit EPS expansion). Executive compensation—tied to Performance Share Units (PSUs) utilizing 3-year organic sales, cumulative operating cash flow, and a relative Total Shareholder Return (TSR) modifier—will penalize management for the FY2026 structural shortfalls.
FY2027 guidance dictates an organic net sales trajectory of -1.5% to +0.5% and adjusted diluted EPS of $3.00 to $3.20. Adjusted operating profit will contract 8% to 13% on a constant-currency basis from the $2,811.5 million baseline. A 9-point operating profit headwind and an 11-point EPS headwind will materialize as the firm laps a 53-week prior year (which alone subtracts 2% from reported sales), normalizes corporate incentive expenses, and digests divestiture offsets.
To bridge this valuation gap, management will cap capital expenditures at 3% of net sales (FY2026 CapEx stood at $539.9 million, down $85 million year-over-year) and mandate $750 million in FY2027 cost savings. This is the first tranche of a $3 billion cumulative cost reduction target for FY2030, comprising $2 billion from HMM initiatives (~4% annual COGS reduction) and $1 billion from supply chain restructuring. In the absence of pricing elasticity, General Mills Inc. is now strictly a margin defense and capital return thesis.
Presentation Download & Video Access:
- Presentation Download: Click the PDF download link under 'Related Topics' to access the full institutional presentation of this report.
- Video Link: Click this link to watch the HDIN analyst briefing on YouTube.
About HDIN Research:
HDIN Research is a premier global market intelligence and strategic advisory firm specializing in institutional-grade financial analysis, supply chain audits, and macroeconomic forecasting. Our dedicated sector analysts deliver actionable, data-driven insights tailored for private equity, hedge funds, and corporate strategy teams. Visit us at http://www.hdinresearch.com.
2026 AI Transparency Footer:
"This intelligence report was authored by HDIN Research analysts following a rigorous audit of official corporate filings. AI was utilized for massive-scale data synthesis and structural drafting, ensuring 100% inclusion of reported data points. All strategic insights, financial modeling, and final verdicts were verified by our editorial board to ensure professional accuracy and compliance with 2026 Google Search E-E-A-T standards."