Sumitomo Bakelite: 2026 CapEx Realignment Near Asian Fabrication Nodes as 35.7% Operating Profit Expansion Signals Structural De-commoditization
Date : 2026-07-07
Reading : 712
HDIN Executive Takeaways
* Operating leverage decoupled from volume as Sumitomo Bakelite Co., Ltd. [TYO: 4203] expanded operating profit by 35.7% year-over-year to $259.7M, driving EBITDA margins up 260 basis points to 16.6% despite flat semiconductor material throughput.
* Management authorized $185.87M in FY27 CapEx, relocating critical packaging nodes to Taiwan, China, and Southeast Asia to bypass tariffs, operating alongside a rigidly under-leveraged balance sheet with a 0.19x debt-to-equity ratio.
* The FY2030 $3.67B revenue target faces a 20% baseline execution gap, necessitating aggressive inorganic integration beyond the recent $10.2M polycarbonate bolt-on to offset stagnant legacy plastic volumes and severe North American asset impairments.
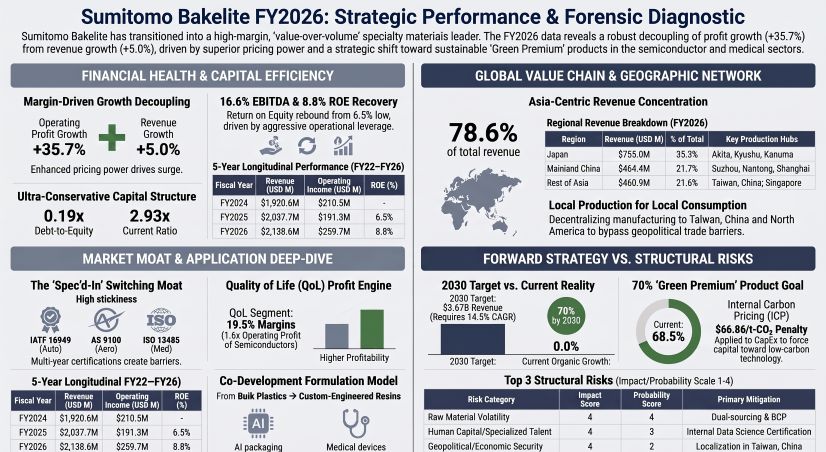
Figure Sumitomo Bakelite FY2026: Strategic Performance & Forensic Diagnostic
 Segmental Realities and Margin Compression
Sumitomo Bakelite Co., Ltd. executes a margin-driven operational model, prioritizing custom co-development formulations over commoditized volume. Financial translation is standardized at 1 USD = 149.5686 JPY under International Financial Reporting Standards (IFRS).
Table 5-Year Longitudinal Financial Matrix
FY2026 Segmental Operations & Margin Variations
* Semiconductor Encapsulation Materials: Revenue printed flat at 0.0% YoY, achieving $716.7M (107,189M JPY). Operating profit expanded 9.5% YoY to $86.3M (12,902M JPY). Operating margin expanded 100 basis points from 11.0% to 12.0%.
* High-Performance Plastics: Revenue printed flat at +0.0% YoY, attaining $705.3M (105,490M JPY). Operating profit expanded 18.4% YoY to $41.6M (6,224M JPY). Operating margin expanded 90 basis points from 5.0% to 5.9%.
* Quality of Life (QoL) Products: Revenue expanded 16.5% YoY to $711.4M (106,396M JPY). Operating profit expanded 15.2% YoY to $138.5M (20,714M JPY), capturing a segment-leading 19.5% operating margin.
Capital Structure, Liquidity, and Cash Flow Diagnostics
* Free Cash Flow (FCF): FY26 FCF registered at $181.0M (Operating CF: $234.0M + Investing CF: -$53.0M), trailing FY25 FCF of $187.9M (Operating CF: $292.2M + Investing CF: -$104.3M).
* Leverage Metrics: Total equity stands at $2,321.3M (347,186M JPY) against total interest-bearing debt of $450.0M (67,304M JPY), pushing the D/E ratio down from 0.24x to 0.19x.
* Liquidity: The current ratio registers at 2.93x ($1,784.9M current assets / $608.6M current liabilities). The quick ratio stands at 2.18x, excluding $458.33M (68,552M JPY) in total inventory.
* Asset Turnover & Efficiencies: Asset turnover decelerated to 0.66x (from 0.73x in FY25) amid a 15.9% YoY expansion in the total asset base. Return on Equity (ROE) reached 8.8% (rebounding from 6.5% in FY25, exceeding the 8.5% executive target). Return on Capital Employed (ROCE) expanded from 8.5% to 9.9%. Gross profit margin expanded 60 bps to 31.3%, while EBITDA margins expanded 260 bps to 16.6%.
* Inventory & Asset Health: Obsolete inventory write-downs totaled exactly $4.23M (633M JPY), representing 0.92% of the total inventory value. FY26 depreciation and amortization expenses totaled $117.97M (17,644M JPY) using straight-line methodology (Buildings up to 50 years; Machinery 2 to 20 years).
Infrastructure Layout and Regional Moats
Sumitomo Bakelite Co., Ltd. is aggressively re-architecting its physical supply chain to execute a "local production for local consumption" framework, utilizing foreign exchange forward contracts as financial hedges, and decentralized material buffers as operational hedges against commodity shocks.
Global Revenue Distribution (FY2026)
* Japan: $755.0M (35.3%)
* China (Mainland): $464.40M / 69,460M JPY (21.7%)
* Rest of Asia: $460.9M (21.6%)
* North America: $237.5M (11.1%)
* Europe & Others: $220.7M (10.3%)
Geographic Asset Deployment & CapEx Pipeline
The Board authorized $185.87M (27,800M JPY) in facility CapEx to insulate manufacturing from cross-border friction and economic security legislation:
* QoL Segment (34.5%): $64.18M (9,600M JPY) allocated for medical device and sustainable packaging scale-up.
* Semiconductor Materials (31.6%): $58.84M (8,800M JPY) allocated for advanced epoxy molding compound capacities in decentralized nodes, specifically targeting Taiwan, China and Southeast Asia.
* High-Performance Plastics (23.4%): $43.46M (6,500M JPY) for automation and polycarbonate integration.
* Corporate IT/R&D (10.5%): $19.39M (2,900M JPY) directing capital to the Computer Security Incident Response Team (SUMIBE-CSIRT), Materials Informatics, and the proprietary "Data Scientist Internal Certification System."
Construction-in-Progress (CIP) Indicators
Un-capitalized physical plant expansions reveal imminent capacity injections:
* Kanuma Plant: $9.37M (1,401M JPY) in CIP.
* Utsunomiya Plant: $7.84M (1,173M JPY) in CIP.
* Overseas Nodes: $18.83M (2,817M JPY) distributed across global subsidiaries.
M&A, Network Nodes, and Quality Certifications
Sumitomo Bakelite Co., Ltd. executes operations through heavily regulated facilities protected by IATF 16949 (Automotive), AS 9100 (Aerospace), ISO 13485 (Medical), and ISO 9001. Quality frameworks enforce Failure Mode and Effects Analysis (FMEA) and Fault Tree Analysis (FTA). Core operational subsidiaries dictating the global footprint include:
* Mainland China: Suzhou Sumitomo Bakelite Co., Ltd., Nantong Sumitomo Bakelite Co., Ltd., Shanghai Sumitomo Bakelite Co., Ltd., Vaupell Plastics Tooling (Dongguan) Co., Ltd., and Dongguan Sumitomo Bakelite Co., Ltd.
* Taiwan, China: Sumitomo Bakelite (Taiwan, China) Co., Ltd. and Sumitomo Bakelite Taiwan, China Co., Ltd.
* North America: Durez Corporation, Durez Canada Co., Ltd., Sumitomo Plastics America, Inc., and Vaupell Industrial Plastics.
* Southeast Asia: SumiDurez and Sumitomo Bakelite Singapore.
* Europe: Sumitomo Bakelite Europe (Ghent) NV and Vyncolit NV.
* Japan: Akita/Kyushu acting as centralized R&D hubs.
The October 2025 polycarbonate business acquisition injected $10.2M (1,525M JPY) in recognized goodwill. Sumitomo Bakelite Europe (Ghent) NV passed its FY26 standard IFRS impairment tests on $29.3M (4,385M JPY) of goodwill following a prior FY25 impairment of $10.0M (1,494M JPY).
HDIN Institutional Verdict
While Sumitomo Bakelite Co., Ltd. exceeded its FY26 core business profit target, achieving $230.7M (34.5 billion JPY) against a projected $227.3M (34.0 billion JPY), the macroeconomic gap between management's 2030 targets and baseline operational volume exposes extreme execution friction.
The Execution Gap on 2030 Top-Line Targets
Management mandates a 2030 revenue target of $3,677.2M (550.0 billion JPY) with a 13.0% business profit margin and ROE exceeding 10.0%. However, the firm missed its interim FY26 target of $2,674.3M (400.0 billion JPY) by roughly 20%, printing $2,138.6M. With zero volume growth across the semiconductor and high-performance plastic segments, the trajectory to $3.67B requires a 14.5% compound annual growth rate (CAGR)—a mathematical improbability without aggressive leverage injection or multi-hundred-million-dollar M&A deployment.
Hidden Balance Sheet Vulnerabilities: North American Impairment
Despite a clean global inventory profile, structural stagnation in the Western industrial supply chain forced a $28.15M (4,211M JPY) impairment loss against North American subsidiaries (Durez Corporation and Durez Canada Co., Ltd.). Management utilized a highly defensive 16.2% pre-tax discount rate (Value-in-Use) to write down these assets, confirming severe utilization distress outside of the primary Asian growth corridors.
Monetizing Environmental Liabilities (The Green Premium)
The firm effectively shifted regulatory risk into pricing power. Management's Risk Matrix classifies raw material supply volatility as a Level 4 Impact/Level 4 Probability threat, human capital as Level 4/3, geopolitical/cyber threats as Level 4/2, and climate change as Level 3/2. To navigate REACH and POPs chemical constraints, the firm applies a strict Internal Carbon Price (ICP) of $66.86 per t-CO2 (10,000 JPY/t-CO2), modeling future carbon taxes of $180 (2035), $205 (2040), and $250 (2050).
Rather than degrading margins, this compliance strategy generated the 35.7% operating profit surge. The company set a 2030 target for "SDGs-Contributing Products" (such as COPLUS® and AQNOA®) to represent 70% of total revenue. As of FY25, actuals track at 68.5%. Scope 1 and 2 emissions have dropped from a 2021 baseline of 246,000 t-CO2 to 123,000 t-CO2, outpacing the 2030 cap target of 128,000 t-CO2 (a 48% reduction). Value-chain Scope 3 emissions (Categories 1, 4, 5, 12) target a 25% reduction. Furthermore, governance KPIs dictating executive compensation yielded an exact match: management secured the targeted "A" ESG rating and exceeded the 4.5% human capital diversity target by achieving 5.87%.
Presentation Download & Video Access:
Presentation Download: Click the PDF download link under 'Related Topics' to access the full institutional presentation of this report.
Video Link: Click this link to watch the HDIN analyst briefing on YouTube.
About HDIN Research:
HDIN Research is a premier global market intelligence and strategic advisory firm specializing in institutional-grade financial analysis, supply chain audits, and macroeconomic forecasting. Our dedicated sector analysts deliver actionable, data-driven insights tailored for private equity, hedge funds, and corporate strategy teams. Visit us at http://www.hdinresearch.com.
*2026 AI Transparency Footer:*
"This intelligence report was authored by HDIN Research analysts following a rigorous audit of official corporate filings. AI was utilized for massive-scale data synthesis and structural drafting, ensuring 100% inclusion of reported data points. All strategic insights, financial modeling, and final verdicts were verified by our editorial board to ensure professional accuracy and compliance with 2026 Google Search E-E-A-T standards."
* Operating leverage decoupled from volume as Sumitomo Bakelite Co., Ltd. [TYO: 4203] expanded operating profit by 35.7% year-over-year to $259.7M, driving EBITDA margins up 260 basis points to 16.6% despite flat semiconductor material throughput.
* Management authorized $185.87M in FY27 CapEx, relocating critical packaging nodes to Taiwan, China, and Southeast Asia to bypass tariffs, operating alongside a rigidly under-leveraged balance sheet with a 0.19x debt-to-equity ratio.
* The FY2030 $3.67B revenue target faces a 20% baseline execution gap, necessitating aggressive inorganic integration beyond the recent $10.2M polycarbonate bolt-on to offset stagnant legacy plastic volumes and severe North American asset impairments.
Figure Sumitomo Bakelite FY2026: Strategic Performance & Forensic Diagnostic
Segmental Realities and Margin CompressionSumitomo Bakelite Co., Ltd. executes a margin-driven operational model, prioritizing custom co-development formulations over commoditized volume. Financial translation is standardized at 1 USD = 149.5686 JPY under International Financial Reporting Standards (IFRS).
Table 5-Year Longitudinal Financial Matrix
| Metric | FY2022 | FY2023 | FY2024 | FY2025 | FY2026 |
|---|---|---|---|---|---|
| Top-Line Revenue | $1,759.2M (¥263,114M) | $1,905.1M (¥284,939M) | $1,920.6M (¥287,267M) | $2,037.7M (¥304,773M) | $2,138.6M (¥319,867M) |
| Operating Income | $173.0M (¥25,880M) | $178.8M (¥26,736M) | $210.5M (¥31,489M) | $191.3M (¥28,614M) | $259.7M (¥38,842M) |
| Net Income | $122.3M | $135.7M | $146.0M | $128.9M | $187.3M |
FY2026 Segmental Operations & Margin Variations
* Semiconductor Encapsulation Materials: Revenue printed flat at 0.0% YoY, achieving $716.7M (107,189M JPY). Operating profit expanded 9.5% YoY to $86.3M (12,902M JPY). Operating margin expanded 100 basis points from 11.0% to 12.0%.
* High-Performance Plastics: Revenue printed flat at +0.0% YoY, attaining $705.3M (105,490M JPY). Operating profit expanded 18.4% YoY to $41.6M (6,224M JPY). Operating margin expanded 90 basis points from 5.0% to 5.9%.
* Quality of Life (QoL) Products: Revenue expanded 16.5% YoY to $711.4M (106,396M JPY). Operating profit expanded 15.2% YoY to $138.5M (20,714M JPY), capturing a segment-leading 19.5% operating margin.
Capital Structure, Liquidity, and Cash Flow Diagnostics
* Free Cash Flow (FCF): FY26 FCF registered at $181.0M (Operating CF: $234.0M + Investing CF: -$53.0M), trailing FY25 FCF of $187.9M (Operating CF: $292.2M + Investing CF: -$104.3M).
* Leverage Metrics: Total equity stands at $2,321.3M (347,186M JPY) against total interest-bearing debt of $450.0M (67,304M JPY), pushing the D/E ratio down from 0.24x to 0.19x.
* Liquidity: The current ratio registers at 2.93x ($1,784.9M current assets / $608.6M current liabilities). The quick ratio stands at 2.18x, excluding $458.33M (68,552M JPY) in total inventory.
* Asset Turnover & Efficiencies: Asset turnover decelerated to 0.66x (from 0.73x in FY25) amid a 15.9% YoY expansion in the total asset base. Return on Equity (ROE) reached 8.8% (rebounding from 6.5% in FY25, exceeding the 8.5% executive target). Return on Capital Employed (ROCE) expanded from 8.5% to 9.9%. Gross profit margin expanded 60 bps to 31.3%, while EBITDA margins expanded 260 bps to 16.6%.
* Inventory & Asset Health: Obsolete inventory write-downs totaled exactly $4.23M (633M JPY), representing 0.92% of the total inventory value. FY26 depreciation and amortization expenses totaled $117.97M (17,644M JPY) using straight-line methodology (Buildings up to 50 years; Machinery 2 to 20 years).
Infrastructure Layout and Regional Moats
Sumitomo Bakelite Co., Ltd. is aggressively re-architecting its physical supply chain to execute a "local production for local consumption" framework, utilizing foreign exchange forward contracts as financial hedges, and decentralized material buffers as operational hedges against commodity shocks.
Global Revenue Distribution (FY2026)
* Japan: $755.0M (35.3%)
* China (Mainland): $464.40M / 69,460M JPY (21.7%)
* Rest of Asia: $460.9M (21.6%)
* North America: $237.5M (11.1%)
* Europe & Others: $220.7M (10.3%)
Geographic Asset Deployment & CapEx Pipeline
The Board authorized $185.87M (27,800M JPY) in facility CapEx to insulate manufacturing from cross-border friction and economic security legislation:
* QoL Segment (34.5%): $64.18M (9,600M JPY) allocated for medical device and sustainable packaging scale-up.
* Semiconductor Materials (31.6%): $58.84M (8,800M JPY) allocated for advanced epoxy molding compound capacities in decentralized nodes, specifically targeting Taiwan, China and Southeast Asia.
* High-Performance Plastics (23.4%): $43.46M (6,500M JPY) for automation and polycarbonate integration.
* Corporate IT/R&D (10.5%): $19.39M (2,900M JPY) directing capital to the Computer Security Incident Response Team (SUMIBE-CSIRT), Materials Informatics, and the proprietary "Data Scientist Internal Certification System."
Construction-in-Progress (CIP) Indicators
Un-capitalized physical plant expansions reveal imminent capacity injections:
* Kanuma Plant: $9.37M (1,401M JPY) in CIP.
* Utsunomiya Plant: $7.84M (1,173M JPY) in CIP.
* Overseas Nodes: $18.83M (2,817M JPY) distributed across global subsidiaries.
M&A, Network Nodes, and Quality Certifications
Sumitomo Bakelite Co., Ltd. executes operations through heavily regulated facilities protected by IATF 16949 (Automotive), AS 9100 (Aerospace), ISO 13485 (Medical), and ISO 9001. Quality frameworks enforce Failure Mode and Effects Analysis (FMEA) and Fault Tree Analysis (FTA). Core operational subsidiaries dictating the global footprint include:
* Mainland China: Suzhou Sumitomo Bakelite Co., Ltd., Nantong Sumitomo Bakelite Co., Ltd., Shanghai Sumitomo Bakelite Co., Ltd., Vaupell Plastics Tooling (Dongguan) Co., Ltd., and Dongguan Sumitomo Bakelite Co., Ltd.
* Taiwan, China: Sumitomo Bakelite (Taiwan, China) Co., Ltd. and Sumitomo Bakelite Taiwan, China Co., Ltd.
* North America: Durez Corporation, Durez Canada Co., Ltd., Sumitomo Plastics America, Inc., and Vaupell Industrial Plastics.
* Southeast Asia: SumiDurez and Sumitomo Bakelite Singapore.
* Europe: Sumitomo Bakelite Europe (Ghent) NV and Vyncolit NV.
* Japan: Akita/Kyushu acting as centralized R&D hubs.
The October 2025 polycarbonate business acquisition injected $10.2M (1,525M JPY) in recognized goodwill. Sumitomo Bakelite Europe (Ghent) NV passed its FY26 standard IFRS impairment tests on $29.3M (4,385M JPY) of goodwill following a prior FY25 impairment of $10.0M (1,494M JPY).
HDIN Institutional Verdict
While Sumitomo Bakelite Co., Ltd. exceeded its FY26 core business profit target, achieving $230.7M (34.5 billion JPY) against a projected $227.3M (34.0 billion JPY), the macroeconomic gap between management's 2030 targets and baseline operational volume exposes extreme execution friction.
The Execution Gap on 2030 Top-Line Targets
Management mandates a 2030 revenue target of $3,677.2M (550.0 billion JPY) with a 13.0% business profit margin and ROE exceeding 10.0%. However, the firm missed its interim FY26 target of $2,674.3M (400.0 billion JPY) by roughly 20%, printing $2,138.6M. With zero volume growth across the semiconductor and high-performance plastic segments, the trajectory to $3.67B requires a 14.5% compound annual growth rate (CAGR)—a mathematical improbability without aggressive leverage injection or multi-hundred-million-dollar M&A deployment.
Hidden Balance Sheet Vulnerabilities: North American Impairment
Despite a clean global inventory profile, structural stagnation in the Western industrial supply chain forced a $28.15M (4,211M JPY) impairment loss against North American subsidiaries (Durez Corporation and Durez Canada Co., Ltd.). Management utilized a highly defensive 16.2% pre-tax discount rate (Value-in-Use) to write down these assets, confirming severe utilization distress outside of the primary Asian growth corridors.
Monetizing Environmental Liabilities (The Green Premium)
The firm effectively shifted regulatory risk into pricing power. Management's Risk Matrix classifies raw material supply volatility as a Level 4 Impact/Level 4 Probability threat, human capital as Level 4/3, geopolitical/cyber threats as Level 4/2, and climate change as Level 3/2. To navigate REACH and POPs chemical constraints, the firm applies a strict Internal Carbon Price (ICP) of $66.86 per t-CO2 (10,000 JPY/t-CO2), modeling future carbon taxes of $180 (2035), $205 (2040), and $250 (2050).
Rather than degrading margins, this compliance strategy generated the 35.7% operating profit surge. The company set a 2030 target for "SDGs-Contributing Products" (such as COPLUS® and AQNOA®) to represent 70% of total revenue. As of FY25, actuals track at 68.5%. Scope 1 and 2 emissions have dropped from a 2021 baseline of 246,000 t-CO2 to 123,000 t-CO2, outpacing the 2030 cap target of 128,000 t-CO2 (a 48% reduction). Value-chain Scope 3 emissions (Categories 1, 4, 5, 12) target a 25% reduction. Furthermore, governance KPIs dictating executive compensation yielded an exact match: management secured the targeted "A" ESG rating and exceeded the 4.5% human capital diversity target by achieving 5.87%.
Presentation Download & Video Access:
Presentation Download: Click the PDF download link under 'Related Topics' to access the full institutional presentation of this report.
Video Link: Click this link to watch the HDIN analyst briefing on YouTube.
About HDIN Research:
HDIN Research is a premier global market intelligence and strategic advisory firm specializing in institutional-grade financial analysis, supply chain audits, and macroeconomic forecasting. Our dedicated sector analysts deliver actionable, data-driven insights tailored for private equity, hedge funds, and corporate strategy teams. Visit us at http://www.hdinresearch.com.
*2026 AI Transparency Footer:*
"This intelligence report was authored by HDIN Research analysts following a rigorous audit of official corporate filings. AI was utilized for massive-scale data synthesis and structural drafting, ensuring 100% inclusion of reported data points. All strategic insights, financial modeling, and final verdicts were verified by our editorial board to ensure professional accuracy and compliance with 2026 Google Search E-E-A-T standards."