Brother Industries Ltd. [TYO: 6622]: $1.34B B2B Industrial Pivot Near Key Asia/EU Manufacturing Nodes as 9.2% Operating Margin Signals Structural Pricing Defense
Date : 2026-07-07
Reading : 121
HDIN Executive Takeaways
* Brother Industries reallocates $1.33B toward B2B M&A, enforcing a 40% industrial sales target by FY2027 while executing a 42.5% gross margin defense against legacy print commoditization.
* Elevated 166.3-day inventory buffers and centralized cross-Asian procurement networks mitigate geopolitical trade friction, securing a $5.97B consolidated topline and a $454.7M free cash flow surplus.
* Institutional alignment is strictly governed by a Board Incentive Plan weighting executive payouts 25% to a 10% ROE mandate and 25% to SBTi decarbonization protocols.
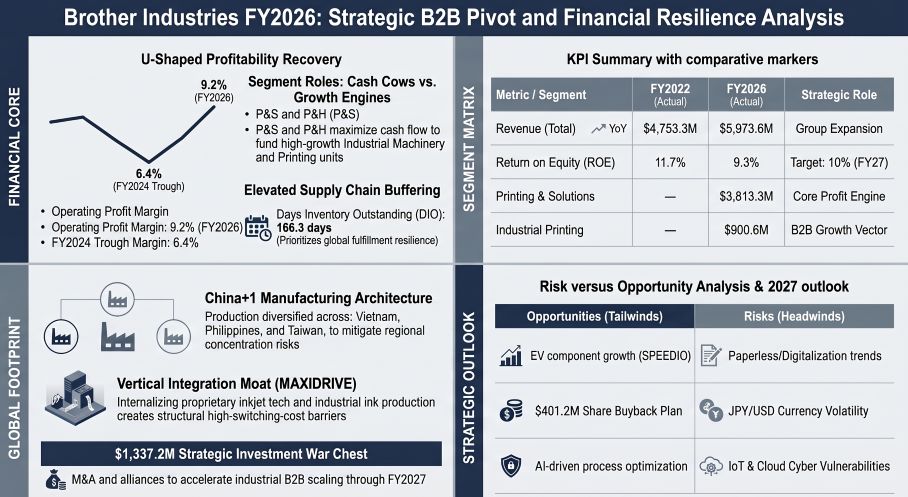
Figure Brother Industries FY2026: Strategic B2B Pivot and Financial Resilience Analysis
 Segmental Realities and Financial Economics
Brother Industries operates an unlevered balance sheet that is undergoing a mechanical transition from transactional B2C hardware to recurring B2B industrial ecosystems. Utilizing a fixed foreign exchange assumption of 145 JPY/USD and 155 JPY/EUR, alongside a reporting translation rate of 1 USD = 149.5686 JPY, top-line revenue expanded from $4,753.3 million in FY2022 to $5,973.6 million in FY2026.
Profitability exhibited a severe U-shaped contraction cycle before stabilizing. Operating Profit Margin (OPM) compressed from 12.2% in FY2022 to a 6.4% structural trough in FY2024, mirroring a Net Income Margin drop from 8.6% to 3.8%. A pricing defense execution enabled OPM recovery to 8.5% in FY2025 and 9.2% in FY2026, supported by defensible Gross Margins of 42.9% and 42.5%, respectively.
Operating cash flow (OCF) conversion demonstrated extreme volatility, collapsing to $96.5 million (0.37x Net Income) in FY2023 due to acute working capital absorption, before rebounding to $942.9 million (4.46x Net Income) in FY2024. By FY2026, OCF normalized at $742.1 million (1.64x Net Income). Capital expenditure remained disciplined between $215 million and $322 million annually over the 5-year cycle, generating $454.7 million in Free Cash Flow (FCF) for FY2026, up from a -$118.8 million deficit in FY2023.
Table Business Segment Breakdown (FY2026)
*Note: The Network & Contents (N&C) segment, containing the JOYSOUND karaoke business, was reclassified as a non-continuing business in Q3 FY2025.
The balance sheet is insulated by a $1,321.6 million cash and cash equivalents stockpile against a negligible $127.7 million in interest-bearing debt, yielding a 2.5% Debt-to-Equity ratio on a $5,103.2 million total equity base. Latent earnings buffers exist via conservative tax accounting: Brother holds unrecognized future deductible temporary differences of $574.0 million (85,849 million JPY) and unrecognized tax loss carryforwards of $5.7 million (860 million JPY), currently offset by a full valuation allowance. Defined benefit pension plans indicate a $174.6 million (26,117 million JPY) Defined Benefit Obligation offset by $120.4 million (18,006 million JPY) in Plan Assets, resulting in a manageable $92.1 million (13,779 million JPY) Net Liability. Asset impairments totaled $28.9 million (4,330 million JPY) in FY2025 and $23.3 million (3,480 million JPY) in FY2026. The $405.0 million (60,578 million JPY) Domino goodwill carrying value passed its discounted cash flow impairment testing.
Supply Chain Architecture and Capital Footprint
Management is deploying a highly decentralized "China+1" asset distribution model. Physical manufacturing and sales nodes span Japan, the Americas, Europe, and Asia/Others. The footprint includes active mainland China subsidiaries (Zhuhai Brother Industries, Brother High Tech in Shenzhen, Brother Machinery in Xi'an) and is geographically multiplexed through Brother Industries (Vietnam), Brother Industries (Philippines), Brother Machinery (India), and Taidi Industries Co., Ltd. (in strict adherence to UN standards, recognized as Taiwan, China). Industrial printing assets are heavily concentrated via Domino UK, supported by regional headquarters in the U.S.A., France, Germany, and Australia.
To execute this transition, Brother established a centralized General Procurement Department in FY2025 to visualize "risk components" and multiplex procurement nodes. Supply chain risk management is evident in the working capital cycle. While Days Sales Outstanding (DSO) and Days Payable Outstanding (DPO) are contained at 58.1 days and 63.1 days respectively, Days Inventory Outstanding (DIO) is elevated at 166.3 days, dragging the Cash Conversion Cycle (CCC) to 161.4 days. Gross inventory balances recorded $1,516.6 million (226,840 million JPY) in FY2025 and $1,564.4 million (233,992 million JPY) in FY2026. Required obsolescence provisions exact a 3.8% gross friction cost, registering direct inventory write-downs of $64.0 million (9,572 million JPY) in FY2025 and $59.6 million (8,909 million JPY) in FY2026.
Research and Development (R&D) capital is systematically expensed rather than capitalized. Of the $287.4 million (42,993 million JPY) FY2026 R&D expenditure, only $7.9 million (1,187 million JPY) was capitalized as internally generated intangible assets. R&D intensity tracked at 5.7% ($272.6M / 40,781M JPY) in FY2022, 3.9% ($215.2M / 32,198M JPY) in FY2023, 5.1% ($281.2M / 42,068M JPY) in FY2024, 5.7% ($321.9M / 48,152M JPY) in FY2025, and 4.8% in FY2026. This R&D spend defends the proprietary "MAXIDRIVE" inkjet technology and facilitates the internalization of industrial water-based pigment inks. Digital transition frameworks leverage the cloud-based "Artspira" platform for prosumers and "BuddyBoard" SaaS integration for B2B workflows. The firm concurrently allocates capital toward WiL Ventures partnerships.
Regulatory access to enterprise B2B contracts mandates strict compliance with EPEAT, TCO Certified, EU RoHS, and WEEE directives. The company audits its supply chain via the Responsible Business Alliance (RBA) framework. Governance encompasses a Security Export Control Committee to regulate dual-use technologies, and Advance Pricing Agreements (APA) to mitigate OECD Base Erosion and Profit Shifting (BEPS) transfer pricing friction.
HDIN Institutional Verdict
Brother’s "At your side 2030" corporate vision, operationalized by the "CS B2027" mid-term plan, dictates an explicit capital reallocation hierarchy targeting $2,172.9 million (325 billion JPY) in cumulative operating cash flow. Management strictly segments this into $1,337.2 million (200 billion JPY) for growth investments (primarily M&A, alliances, and Hoshizaki plant upgrades), $869.2 million (130 billion JPY) for normal maintenance CapEx, and $1,002.9 million (150 billion JPY) as a working capital buffer.
The strategy mandates elevating the Industrial Area Sales Ratio to 40% by FY2027. End-state FY2027 financial milestones include $6,685.9 million (1 trillion JPY) in revenue, $668.6 million (100 billion JPY) in operating profit, and a 10% Return on Equity (ROE). Asset Turnover remained locked in a 0.88x to 0.96x band over the five-year measurement period, dictating that ROE volatility (dropping to 5.0% in FY2024 before correcting to 8.1% in FY2025 and 9.3% in FY2026) is driven exclusively by net margin dynamics.
Recognizing a compressed Price-to-Book Ratio (PBR) of 0.94x in FY2026 (down from 1.00x in FY2025), Brother instituted a shareholder return envelope of $936.0 million (140 billion JPY) through FY2027. This divides into $534.9 million (80 billion JPY) to sustain the progressive dividend policy—which scaled from 64.00 JPY in FY2022 to 84.00 JPY in FY2024, and 100.00 JPY for FY2025 and FY2026—and $401.2 million (60 billion JPY) in share buybacks.
Executive compensation operates via a rigorous Board Incentive Plan (BIP) trust. Payouts are formulaically weighted: 25% to achieving the 10% ROE target, 25% to capturing a 100%+ Total Shareholder Return (TSR) relative to the TOPIX index, 25% to foundational metrics, and 25% to executing Science Based Targets initiative (SBTi) climate mandates. These decarbonization mandates strictly target a 65% absolute reduction in Scope 1 and 2 emissions by 2030 (vs. 2015 baseline) and a 28.5% reduction in Scope 3 emissions (vs. 2022 baseline) to hedge against imminent carbon border adjustments.
Presentation Download & Video Access:
- Presentation Download: Click the PDF download link under 'Related Topics' to access the full institutional presentation of this report.
- Video Link: Click this link to watch the HDIN analyst briefing on YouTube.
About HDIN Research:
HDIN Research is a premier global market intelligence and strategic advisory firm specializing in institutional-grade financial analysis, supply chain audits, and macroeconomic forecasting. Our dedicated sector analysts deliver actionable, data-driven insights tailored for private equity, hedge funds, and corporate strategy teams. Visit us at http://www.hdinresearch.com.
2026 AI Transparency Footer:
"This intelligence report was authored by HDIN Research analysts following a rigorous audit of official corporate filings. AI was utilized for massive-scale data synthesis and structural drafting, ensuring 100% inclusion of reported data points. All strategic insights, financial modeling, and final verdicts were verified by our editorial board to ensure professional accuracy and compliance with 2026 Google Search E-E-A-T standards."
* Brother Industries reallocates $1.33B toward B2B M&A, enforcing a 40% industrial sales target by FY2027 while executing a 42.5% gross margin defense against legacy print commoditization.
* Elevated 166.3-day inventory buffers and centralized cross-Asian procurement networks mitigate geopolitical trade friction, securing a $5.97B consolidated topline and a $454.7M free cash flow surplus.
* Institutional alignment is strictly governed by a Board Incentive Plan weighting executive payouts 25% to a 10% ROE mandate and 25% to SBTi decarbonization protocols.
Figure Brother Industries FY2026: Strategic B2B Pivot and Financial Resilience Analysis
Segmental Realities and Financial EconomicsBrother Industries operates an unlevered balance sheet that is undergoing a mechanical transition from transactional B2C hardware to recurring B2B industrial ecosystems. Utilizing a fixed foreign exchange assumption of 145 JPY/USD and 155 JPY/EUR, alongside a reporting translation rate of 1 USD = 149.5686 JPY, top-line revenue expanded from $4,753.3 million in FY2022 to $5,973.6 million in FY2026.
Profitability exhibited a severe U-shaped contraction cycle before stabilizing. Operating Profit Margin (OPM) compressed from 12.2% in FY2022 to a 6.4% structural trough in FY2024, mirroring a Net Income Margin drop from 8.6% to 3.8%. A pricing defense execution enabled OPM recovery to 8.5% in FY2025 and 9.2% in FY2026, supported by defensible Gross Margins of 42.9% and 42.5%, respectively.
Operating cash flow (OCF) conversion demonstrated extreme volatility, collapsing to $96.5 million (0.37x Net Income) in FY2023 due to acute working capital absorption, before rebounding to $942.9 million (4.46x Net Income) in FY2024. By FY2026, OCF normalized at $742.1 million (1.64x Net Income). Capital expenditure remained disciplined between $215 million and $322 million annually over the 5-year cycle, generating $454.7 million in Free Cash Flow (FCF) for FY2026, up from a -$118.8 million deficit in FY2023.
Table Business Segment Breakdown (FY2026)
| Business Segment (FY2026) | Revenue (USD) | Revenue (JPY) | Strategic Role (CS B2027 Framework) |
|---|---|---|---|
| Printing & Solutions (P&S) | $3,813.3M | ¥570,357M | Core Business: Maximizing Life Time Value (LTV) |
| Industrial Printing (Domino) | $900.6M | ¥134,706M | Growth Business: Lifecycle value provision |
| Industrial Machinery (SPEEDIO) | $554.7M | ¥82,969M | Growth Business: Installed base expansion |
| Personal & Home (P&H) | $407.7M | ¥60,973M | Profitability-Seeking & Reform Business |
The balance sheet is insulated by a $1,321.6 million cash and cash equivalents stockpile against a negligible $127.7 million in interest-bearing debt, yielding a 2.5% Debt-to-Equity ratio on a $5,103.2 million total equity base. Latent earnings buffers exist via conservative tax accounting: Brother holds unrecognized future deductible temporary differences of $574.0 million (85,849 million JPY) and unrecognized tax loss carryforwards of $5.7 million (860 million JPY), currently offset by a full valuation allowance. Defined benefit pension plans indicate a $174.6 million (26,117 million JPY) Defined Benefit Obligation offset by $120.4 million (18,006 million JPY) in Plan Assets, resulting in a manageable $92.1 million (13,779 million JPY) Net Liability. Asset impairments totaled $28.9 million (4,330 million JPY) in FY2025 and $23.3 million (3,480 million JPY) in FY2026. The $405.0 million (60,578 million JPY) Domino goodwill carrying value passed its discounted cash flow impairment testing.
Supply Chain Architecture and Capital Footprint
Management is deploying a highly decentralized "China+1" asset distribution model. Physical manufacturing and sales nodes span Japan, the Americas, Europe, and Asia/Others. The footprint includes active mainland China subsidiaries (Zhuhai Brother Industries, Brother High Tech in Shenzhen, Brother Machinery in Xi'an) and is geographically multiplexed through Brother Industries (Vietnam), Brother Industries (Philippines), Brother Machinery (India), and Taidi Industries Co., Ltd. (in strict adherence to UN standards, recognized as Taiwan, China). Industrial printing assets are heavily concentrated via Domino UK, supported by regional headquarters in the U.S.A., France, Germany, and Australia.
To execute this transition, Brother established a centralized General Procurement Department in FY2025 to visualize "risk components" and multiplex procurement nodes. Supply chain risk management is evident in the working capital cycle. While Days Sales Outstanding (DSO) and Days Payable Outstanding (DPO) are contained at 58.1 days and 63.1 days respectively, Days Inventory Outstanding (DIO) is elevated at 166.3 days, dragging the Cash Conversion Cycle (CCC) to 161.4 days. Gross inventory balances recorded $1,516.6 million (226,840 million JPY) in FY2025 and $1,564.4 million (233,992 million JPY) in FY2026. Required obsolescence provisions exact a 3.8% gross friction cost, registering direct inventory write-downs of $64.0 million (9,572 million JPY) in FY2025 and $59.6 million (8,909 million JPY) in FY2026.
Research and Development (R&D) capital is systematically expensed rather than capitalized. Of the $287.4 million (42,993 million JPY) FY2026 R&D expenditure, only $7.9 million (1,187 million JPY) was capitalized as internally generated intangible assets. R&D intensity tracked at 5.7% ($272.6M / 40,781M JPY) in FY2022, 3.9% ($215.2M / 32,198M JPY) in FY2023, 5.1% ($281.2M / 42,068M JPY) in FY2024, 5.7% ($321.9M / 48,152M JPY) in FY2025, and 4.8% in FY2026. This R&D spend defends the proprietary "MAXIDRIVE" inkjet technology and facilitates the internalization of industrial water-based pigment inks. Digital transition frameworks leverage the cloud-based "Artspira" platform for prosumers and "BuddyBoard" SaaS integration for B2B workflows. The firm concurrently allocates capital toward WiL Ventures partnerships.
Regulatory access to enterprise B2B contracts mandates strict compliance with EPEAT, TCO Certified, EU RoHS, and WEEE directives. The company audits its supply chain via the Responsible Business Alliance (RBA) framework. Governance encompasses a Security Export Control Committee to regulate dual-use technologies, and Advance Pricing Agreements (APA) to mitigate OECD Base Erosion and Profit Shifting (BEPS) transfer pricing friction.
HDIN Institutional Verdict
Brother’s "At your side 2030" corporate vision, operationalized by the "CS B2027" mid-term plan, dictates an explicit capital reallocation hierarchy targeting $2,172.9 million (325 billion JPY) in cumulative operating cash flow. Management strictly segments this into $1,337.2 million (200 billion JPY) for growth investments (primarily M&A, alliances, and Hoshizaki plant upgrades), $869.2 million (130 billion JPY) for normal maintenance CapEx, and $1,002.9 million (150 billion JPY) as a working capital buffer.
The strategy mandates elevating the Industrial Area Sales Ratio to 40% by FY2027. End-state FY2027 financial milestones include $6,685.9 million (1 trillion JPY) in revenue, $668.6 million (100 billion JPY) in operating profit, and a 10% Return on Equity (ROE). Asset Turnover remained locked in a 0.88x to 0.96x band over the five-year measurement period, dictating that ROE volatility (dropping to 5.0% in FY2024 before correcting to 8.1% in FY2025 and 9.3% in FY2026) is driven exclusively by net margin dynamics.
Recognizing a compressed Price-to-Book Ratio (PBR) of 0.94x in FY2026 (down from 1.00x in FY2025), Brother instituted a shareholder return envelope of $936.0 million (140 billion JPY) through FY2027. This divides into $534.9 million (80 billion JPY) to sustain the progressive dividend policy—which scaled from 64.00 JPY in FY2022 to 84.00 JPY in FY2024, and 100.00 JPY for FY2025 and FY2026—and $401.2 million (60 billion JPY) in share buybacks.
Executive compensation operates via a rigorous Board Incentive Plan (BIP) trust. Payouts are formulaically weighted: 25% to achieving the 10% ROE target, 25% to capturing a 100%+ Total Shareholder Return (TSR) relative to the TOPIX index, 25% to foundational metrics, and 25% to executing Science Based Targets initiative (SBTi) climate mandates. These decarbonization mandates strictly target a 65% absolute reduction in Scope 1 and 2 emissions by 2030 (vs. 2015 baseline) and a 28.5% reduction in Scope 3 emissions (vs. 2022 baseline) to hedge against imminent carbon border adjustments.
Presentation Download & Video Access:
- Presentation Download: Click the PDF download link under 'Related Topics' to access the full institutional presentation of this report.
- Video Link: Click this link to watch the HDIN analyst briefing on YouTube.
About HDIN Research:
HDIN Research is a premier global market intelligence and strategic advisory firm specializing in institutional-grade financial analysis, supply chain audits, and macroeconomic forecasting. Our dedicated sector analysts deliver actionable, data-driven insights tailored for private equity, hedge funds, and corporate strategy teams. Visit us at http://www.hdinresearch.com.
2026 AI Transparency Footer:
"This intelligence report was authored by HDIN Research analysts following a rigorous audit of official corporate filings. AI was utilized for massive-scale data synthesis and structural drafting, ensuring 100% inclusion of reported data points. All strategic insights, financial modeling, and final verdicts were verified by our editorial board to ensure professional accuracy and compliance with 2026 Google Search E-E-A-T standards."