Toyota Industries Corporation: $8.41 Billion Privatization Buyback Initiated as 3.14% Margin Compression Mandates Accelerated Supply Chain Reallocation
Date : 2026-07-07
Reading : 282
HDIN Executive Takeaways
* Toyota Industries Corporation recorded a 7.0% revenue expansion to $29.21 billion (4,369,512 million JPY) in FY2026, countered by a 38.2% collapse in operating profit down to $916.1 million (137,023 million JPY), driving blended margins to a depressed 3.14% amid engine certification halts.
* Severe domestic manufacturing friction offset North American and European logistics stability, triggering the authorization of an $8.41 billion (1,257,635 million JPY) maximum treasury stock buyout targeting 101.76 million shares from Toyota Motor Corporation to consolidate equity and finalize privatization.
* The corporate balance sheet maintains an overcapitalized 60.53% equity ratio ($45.28 billion against $74.80 billion in assets) alongside $10.31 billion in FVTOCI strategic shares, providing immediate liquidity to absorb $947.3 million in off-balance-sheet contingent liabilities.
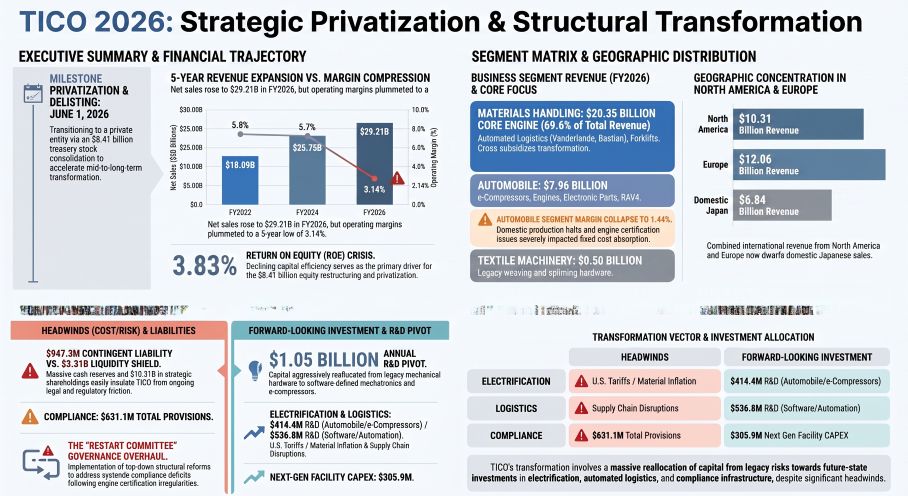
Figure Toyota Industries Corporation (TICO) 2026: Strategic Privatization & Structural Transformation
 Segmental Realities and Margin Compression
Toyota Industries Corporation [TYO: 6201] is operating through a structural decoupling of top-line revenue expansion and unit profitability. Despite extending a five-year revenue growth trajectory from $18.09 billion in FY2022 to $29.21 billion in FY2026, peak operating profit of $1.48 billion (5.43% margin) recorded in FY2025 collapsed by 38.2% in FY2026. Correspondingly, net income contracted 14.7% year-over-year, dropping from $1.75 billion to $1.50 billion. The return on equity (ROE) fell from a historical band of 4.6%–5.0% to a five-year low of 3.83%.
The FY2026 enterprise revenue is highly skewed across a bifurcated industrial framework, effectively requiring the Materials Handling segment to cross-subsidize extreme margin erosion in the legacy Automobile and Textile divisions.
Table FY2026 Segmental Revenue and Profitability Matrix
*(Conversion Rate: 1 USD = 149.5686 JPY)*
This margin contraction is exacerbated by a severe escalation in corporate provisions. Total provisions escalated by $111.1 million (16,620 million JPY), rising from $520.0 million (77,773 million JPY) in FY2025 to $631.1 million (94,393 million JPY) in FY2026. This aggregate total is comprised of three primary sub-ledgers totaling $418.5 million (62,590 million JPY), $191.2 million (28,600 million JPY), and $21.4 million (3,202 million JPY).
Simultaneously, the enterprise documented massive off-balance-sheet contingent liabilities tied to global legal friction and operational irregularities spanning 2021 through 2024. These risks specifically reference "2.0t to 3.5t" equipment specifications and are quantified in two tranches of $571.2 million (85,434 million JPY) and $376.1 million (56,259 million JPY), combining for $947.3 million in outstanding exposure.
Infrastructure Layout and Regional Moats
The enterprise maintains a geographically concentrated revenue architecture. FY2026 sales are partitioned across three macro-regions: Region 1 (Domestic/Japan) generated $6.84 billion (1,023,747 million JPY); Region 2 (North America) recorded $10.31 billion (1,541,558 million JPY); and Region 3 (Europe/International) captured $12.06 billion (1,804,206 million JPY).
To execute this global output, the company operates a complex, multi-continent physical supply chain. The automotive footprint is heavily anchored by Michigan Automotive Compressor and TD Automotive Compressor Georgia in the United States, TD Deutsche Klimakompressor in Germany, and Yantai Shougang Nippondenso alongside Kunshan facilities in China, supplemented by localized assembly hubs in India and Indonesia.
The logistics and materials handling infrastructure is orchestrated through strategic overseas subsidiaries operating as hardware distributors and systems integrators, explicitly including Vanderlande, Bastian Solutions, viastore, Cascade, and AICHI CORPORATION. A critical driver of revenue within this supply chain is the conversion of hardware into financial vehicles via Toyota Industries Commercial Finance, Inc. (TICF), which logs massive operating leases recorded mechanically as "lease investment assets" on the balance sheet.
Macroeconomic friction directly impacted this global footprint during the fiscal year. The company recorded severe foreign exchange volatility, adjusting FY2026 hedging rates to 157.49 JPY against the USD (weakened from 150.69 JPY) and 182.84 JPY against the Euro (weakened from 162.27 JPY), amplifying raw material import pressures against un-passable supplier price adjustments. Furthermore, operations faced acute exposure to explicit risk factors identified by management, namely "Price Competition" and the "Impact of Disasters and Power Outages".
HDIN Institutional Verdict
The authorization of the $8.41 billion treasury stock acquisition to execute a privatization via a tender offer by Toyota Fudosan Co., Ltd. serves as the terminal financial restructuring required to isolate the company from public equity market friction. By buying out Toyota Motor Corporation [TYO: 7203] and delisting, the newly private entity mathematically corrects its overcapitalized 60.53% equity ratio and isolates its massive liquidity from activist scrutiny.
The underlying cash flow dynamics remain completely uncompromised. While financing cash flows demonstrated strict outflows ranging from -$615 million to -$1.40 billion annually over five years, operating cash flow recovered rapidly from $1.15 billion in FY2025 to $2.67 billion (398,794 million JPY) in FY2026. Direct cash and cash equivalents surged from $2.53 billion (378,455 million JPY) to $3.31 billion (495,827 million JPY), fully backing a $12.24 billion (1,831,111 million JPY) interest-bearing debt load split between $3.07 billion (458,606 million JPY) in short-term liabilities and $5.16 billion (771,446 million JPY) in long-term obligations. This debt is further insulated by $10.31 billion (1,541,623 million JPY) in FVTOCI strategically-held shares.
This liquidity is systematically diverted into extreme technical capital allocation aligned with the "2030 Vision" and the World Energy Outlook 2.6 and 8.5 scenarios. In FY2026, consolidated R&D expenditures hit $1.05 billion (157,542 million JPY), a 3.6% enterprise intensity rate. Capital was strictly directed toward software-defined logistics and automotive mechatronics, with $536.8 million (80,285 million JPY) allocated to Materials Handling, $414.4 million (61,976 million JPY) to Automobile, $55.0 million (8,223 million JPY) to Textile Machinery, and $43.6 million (6,521 million JPY) to other corporate research.
Physical capital expenditure mirrors this software-defined transition. Property, Plant, and Equipment (PPE) grew from $6.37 billion (953,321 million JPY) to $7.50 billion (1,121,727 million JPY), driven by $2.03 billion (303,800 million JPY) in gross additions against $748.8 million (111,997 million JPY) in depreciation. Forward-looking physical capital outlays confirm uninterrupted facility construction, with individual investments recorded at $305.9 million (45,755 million JPY), $176.0 million (26,326 million JPY), and $144.1 million (21,550 million JPY).
Coupled with the immediate implementation of a "Restart Committee" and a "Compliance Committee" to correct historical governance failures, the $8.41 billion privatization strategy perfectly insulates the company. Operating completely outside public market short-termism, the enterprise can freely redirect its $2.67 billion in annual operating cash flow directly into next-generation mechatronics, ensuring total alignment with the wider Toyota Group's software-defined vehicle and multi-pathway electrification roadmap.
Presentation Download & Video Access:
- Presentation Download: Click the PDF download link under 'Related Topics' to access the full institutional presentation of this report.
- Video Link: Click this link to watch the HDIN analyst briefing on YouTube.
About HDIN Research:
HDIN Research is a premier global market intelligence and strategic advisory firm specializing in institutional-grade financial analysis, supply chain audits, and macroeconomic forecasting. Our dedicated sector analysts deliver actionable, data-driven insights tailored for private equity, hedge funds, and corporate strategy teams. Visit us at http://www.hdinresearch.com.
2026 AI Transparency Footer:
"This intelligence report was authored by HDIN Research analysts following a rigorous audit of official corporate filings. AI was utilized for massive-scale data synthesis and structural drafting, ensuring 100% inclusion of reported data points. All strategic insights, financial modeling, and final verdicts were verified by our editorial board to ensure professional accuracy and compliance with 2026 Google Search E-E-A-T standards."
* Toyota Industries Corporation recorded a 7.0% revenue expansion to $29.21 billion (4,369,512 million JPY) in FY2026, countered by a 38.2% collapse in operating profit down to $916.1 million (137,023 million JPY), driving blended margins to a depressed 3.14% amid engine certification halts.
* Severe domestic manufacturing friction offset North American and European logistics stability, triggering the authorization of an $8.41 billion (1,257,635 million JPY) maximum treasury stock buyout targeting 101.76 million shares from Toyota Motor Corporation to consolidate equity and finalize privatization.
* The corporate balance sheet maintains an overcapitalized 60.53% equity ratio ($45.28 billion against $74.80 billion in assets) alongside $10.31 billion in FVTOCI strategic shares, providing immediate liquidity to absorb $947.3 million in off-balance-sheet contingent liabilities.
Figure Toyota Industries Corporation (TICO) 2026: Strategic Privatization & Structural Transformation
Segmental Realities and Margin CompressionToyota Industries Corporation [TYO: 6201] is operating through a structural decoupling of top-line revenue expansion and unit profitability. Despite extending a five-year revenue growth trajectory from $18.09 billion in FY2022 to $29.21 billion in FY2026, peak operating profit of $1.48 billion (5.43% margin) recorded in FY2025 collapsed by 38.2% in FY2026. Correspondingly, net income contracted 14.7% year-over-year, dropping from $1.75 billion to $1.50 billion. The return on equity (ROE) fell from a historical band of 4.6%–5.0% to a five-year low of 3.83%.
The FY2026 enterprise revenue is highly skewed across a bifurcated industrial framework, effectively requiring the Materials Handling segment to cross-subsidize extreme margin erosion in the legacy Automobile and Textile divisions.
Table FY2026 Segmental Revenue and Profitability Matrix
| Segment | Revenue (USD) | Revenue (JPY) | Revenue Share | Operating Profit (USD) | Operating Profit (JPY) | Operating Margin |
|---|---|---|---|---|---|---|
| Materials Handling Equipment | $20.35B | ¥3,043,058M | 69.6% | $758.9M | ¥113,507M | 3.73% |
| Automobile | $7.96B | ¥1,190,313M | 27.2% | $114.6M | ¥17,144M | 1.44% |
| ├─ Car Air-Conditioning Compressors | $3.24B | ¥484,504M | — | — | — | — |
| ├─ Engines | $2.39B | ¥356,882M | — | — | — | — |
| ├─ Electronic Parts | $1.66B | ¥247,533M | — | — | — | — |
| ├─ Vehicle Assembly | $0.68B | ¥101,393M | — | — | — | — |
| Textile Machinery | $499.5M | ¥74,723M | 1.7% | $(5.9M) | ¥(878M) | Negative |
| Others | $410.6M | ¥61,417M | — | $50.3M | ¥7,522M | — |
This margin contraction is exacerbated by a severe escalation in corporate provisions. Total provisions escalated by $111.1 million (16,620 million JPY), rising from $520.0 million (77,773 million JPY) in FY2025 to $631.1 million (94,393 million JPY) in FY2026. This aggregate total is comprised of three primary sub-ledgers totaling $418.5 million (62,590 million JPY), $191.2 million (28,600 million JPY), and $21.4 million (3,202 million JPY).
Simultaneously, the enterprise documented massive off-balance-sheet contingent liabilities tied to global legal friction and operational irregularities spanning 2021 through 2024. These risks specifically reference "2.0t to 3.5t" equipment specifications and are quantified in two tranches of $571.2 million (85,434 million JPY) and $376.1 million (56,259 million JPY), combining for $947.3 million in outstanding exposure.
Infrastructure Layout and Regional Moats
The enterprise maintains a geographically concentrated revenue architecture. FY2026 sales are partitioned across three macro-regions: Region 1 (Domestic/Japan) generated $6.84 billion (1,023,747 million JPY); Region 2 (North America) recorded $10.31 billion (1,541,558 million JPY); and Region 3 (Europe/International) captured $12.06 billion (1,804,206 million JPY).
To execute this global output, the company operates a complex, multi-continent physical supply chain. The automotive footprint is heavily anchored by Michigan Automotive Compressor and TD Automotive Compressor Georgia in the United States, TD Deutsche Klimakompressor in Germany, and Yantai Shougang Nippondenso alongside Kunshan facilities in China, supplemented by localized assembly hubs in India and Indonesia.
The logistics and materials handling infrastructure is orchestrated through strategic overseas subsidiaries operating as hardware distributors and systems integrators, explicitly including Vanderlande, Bastian Solutions, viastore, Cascade, and AICHI CORPORATION. A critical driver of revenue within this supply chain is the conversion of hardware into financial vehicles via Toyota Industries Commercial Finance, Inc. (TICF), which logs massive operating leases recorded mechanically as "lease investment assets" on the balance sheet.
Macroeconomic friction directly impacted this global footprint during the fiscal year. The company recorded severe foreign exchange volatility, adjusting FY2026 hedging rates to 157.49 JPY against the USD (weakened from 150.69 JPY) and 182.84 JPY against the Euro (weakened from 162.27 JPY), amplifying raw material import pressures against un-passable supplier price adjustments. Furthermore, operations faced acute exposure to explicit risk factors identified by management, namely "Price Competition" and the "Impact of Disasters and Power Outages".
HDIN Institutional Verdict
The authorization of the $8.41 billion treasury stock acquisition to execute a privatization via a tender offer by Toyota Fudosan Co., Ltd. serves as the terminal financial restructuring required to isolate the company from public equity market friction. By buying out Toyota Motor Corporation [TYO: 7203] and delisting, the newly private entity mathematically corrects its overcapitalized 60.53% equity ratio and isolates its massive liquidity from activist scrutiny.
The underlying cash flow dynamics remain completely uncompromised. While financing cash flows demonstrated strict outflows ranging from -$615 million to -$1.40 billion annually over five years, operating cash flow recovered rapidly from $1.15 billion in FY2025 to $2.67 billion (398,794 million JPY) in FY2026. Direct cash and cash equivalents surged from $2.53 billion (378,455 million JPY) to $3.31 billion (495,827 million JPY), fully backing a $12.24 billion (1,831,111 million JPY) interest-bearing debt load split between $3.07 billion (458,606 million JPY) in short-term liabilities and $5.16 billion (771,446 million JPY) in long-term obligations. This debt is further insulated by $10.31 billion (1,541,623 million JPY) in FVTOCI strategically-held shares.
This liquidity is systematically diverted into extreme technical capital allocation aligned with the "2030 Vision" and the World Energy Outlook 2.6 and 8.5 scenarios. In FY2026, consolidated R&D expenditures hit $1.05 billion (157,542 million JPY), a 3.6% enterprise intensity rate. Capital was strictly directed toward software-defined logistics and automotive mechatronics, with $536.8 million (80,285 million JPY) allocated to Materials Handling, $414.4 million (61,976 million JPY) to Automobile, $55.0 million (8,223 million JPY) to Textile Machinery, and $43.6 million (6,521 million JPY) to other corporate research.
Physical capital expenditure mirrors this software-defined transition. Property, Plant, and Equipment (PPE) grew from $6.37 billion (953,321 million JPY) to $7.50 billion (1,121,727 million JPY), driven by $2.03 billion (303,800 million JPY) in gross additions against $748.8 million (111,997 million JPY) in depreciation. Forward-looking physical capital outlays confirm uninterrupted facility construction, with individual investments recorded at $305.9 million (45,755 million JPY), $176.0 million (26,326 million JPY), and $144.1 million (21,550 million JPY).
Coupled with the immediate implementation of a "Restart Committee" and a "Compliance Committee" to correct historical governance failures, the $8.41 billion privatization strategy perfectly insulates the company. Operating completely outside public market short-termism, the enterprise can freely redirect its $2.67 billion in annual operating cash flow directly into next-generation mechatronics, ensuring total alignment with the wider Toyota Group's software-defined vehicle and multi-pathway electrification roadmap.
Presentation Download & Video Access:
- Presentation Download: Click the PDF download link under 'Related Topics' to access the full institutional presentation of this report.
- Video Link: Click this link to watch the HDIN analyst briefing on YouTube.
About HDIN Research:
HDIN Research is a premier global market intelligence and strategic advisory firm specializing in institutional-grade financial analysis, supply chain audits, and macroeconomic forecasting. Our dedicated sector analysts deliver actionable, data-driven insights tailored for private equity, hedge funds, and corporate strategy teams. Visit us at http://www.hdinresearch.com.
2026 AI Transparency Footer:
"This intelligence report was authored by HDIN Research analysts following a rigorous audit of official corporate filings. AI was utilized for massive-scale data synthesis and structural drafting, ensuring 100% inclusion of reported data points. All strategic insights, financial modeling, and final verdicts were verified by our editorial board to ensure professional accuracy and compliance with 2026 Google Search E-E-A-T standards."