SK hynix Inc.: Unrecognized Capital Commitments Hit $21.75 Billion Near Seoul as 56.4% High-Bandwidth Memory Dominance Triggers 79.3% Gross Margins
Date : 2026-07-08
Reading : 592
HDIN Executive Takeaways
1. SK hynix Inc. reversed a $6.43 billion net loss in 2023 to a $28.38 billion net profit in 1Q26, driven by a 56.4% market share in High-Bandwidth Memory (HBM) that commands a >5x pricing premium over traditional DRAM.
2. Unrecognized off-balance-sheet capital commitments surged to $21.75 billion in 1Q26 to fund South Korean mega-clusters, countering U.S. CHIPS Act guardrails that legally freeze capacity expansions at Chinese fabrication plants following the revocation of Validated End-User status.
3. Management retains immense latent earnings control via subjective machinery depreciation triggers, actively shielding a highly sensitive $9.57 billion Level 3 Kioxia asset structure while immediately expensing $1.72 billion of the $1.79 billion 1Q26 R&D outlay.
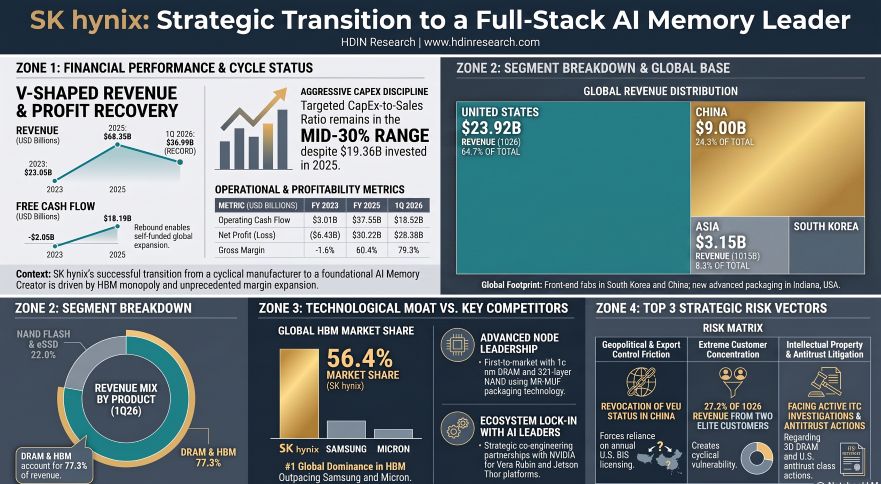
Figure SK hynix: Strategic Transition to a Full-Stack Al Memory Leader
 Segmental Realities and Margin Hyper-Expansion
SK hynix Inc. executed a structural transition leveraging artificial intelligence infrastructure bottlenecks, generating a 198% YoY revenue acceleration in 1Q26. By artificially inducing a supply constraint in traditional DRAM through HBM cleanroom reallocation, the company achieved unprecedented margin leverage, compressing SG&A expenses to 3.1% of revenue in 1Q26.
Table 1: Consolidated Income & Operational Cash Flow Metrics (USD Billions)
Segmental Pricing Power & Output Realities (1Q26 vs. 2025 vs. 2024)
* DRAM & HBM Segment: Reached $28.60 billion in 1Q26 (77.3% of total revenue), accelerating from $52.70 billion (77.1%) in 2025 and $31.47 billion (67.6%) in 2024. Despite flat QoQ bit sales volume in 1Q26, Average Selling Prices (ASP) expanded by the mid-60% range. Total DRAM market share stands at 29.1% (#2 globally). Management forecasts traditional DRAM ASPs to jump 136.4% YoY in 1Q26 and 198.1% YoY in 2Q26.
* NAND Flash & eSSD Segment: Generated $8.14 billion in 1Q26 (22.0% of total revenue), tracking against $14.56 billion (21.3%) in 2025 and $13.56 billion (29.1%) in 2024. While 1Q26 bit sales volume contracted 10% QoQ, ASPs surged in the mid-70% range. Market share is 18.5% (#2 globally), with projected >250% YoY ASP expansion in 2H26.
* Foundry & CIS Segment: Revenue compressed to $0.24 billion (0.7%) in 1Q26 from $1.09 billion (1.6%) in 2025. The CMOS Image Sensor (CIS) unit was integrated into AI memory operations in March 2025, triggering a $26.8 million impairment. Additionally, the SK hynix system ic (Wuxi) Co., Ltd. 8-inch foundry joint venture booked a $331.3 million impairment in 2025.
Balance Sheet Engineering & Off-Balance Sheet Liabilities
* Liquidity & Leverage: Total Assets expanded from $70.59 billion in 2023 to $156.77 billion in 1Q26, with Total Equity reaching $115.65 billion. The Liabilities-to-Equity Ratio plummeted from 87.5% (2023) to 46.0% (2025) and 35.6% (1Q26). The Net Borrowing Ratio dropped from 38.4% in 2023 to 11.5% in 2024, achieving a net-cash position by 2025 as Total Borrowings decreased from $20.73 billion to $13.59 billion in 1Q26. Highly liquid assets grew geometrically from $6.28 billion (2023) to $38.22 billion (1Q26).
* Inventory Accounting Levers: Total inventory carrying value reached $11.24 billion in 1Q26 (up from $9.48 billion in 2023). The valuation allowance peaked at $813.7 million in 2024, decreasing to $348.2 million in 2025 and $289.7 million in 1Q26. Notably, SK hynix Inc. utilized $545.0 million of this allowance upon sales in 2025, structurally inflating gross margins by selling previously written-down chips.
* Contingent Liabilities & Capitalization: Unrecognized capital commitments for property, plant, and equipment multiplied from $4.69 billion at FYE25 to $21.75 billion in 1Q26. Supply-chain factoring payables settled via external finance dropped from $1.23 billion (2025) to $624.7 million (1Q26). The firm maintains non-recourse receivables factoring lines of $837 million in the US and $21.1 million domestically. A $20.8 million purchase commitment provision was fully reversed in 2024. Furthermore, the company holds an off-balance-sheet guarantee of RMB 701 million ($98 million) for its Hystars Semiconductor (Wuxi) Co., Ltd. joint venture.
* Level 3 SPV Exposure (Kioxia): The balance sheet holds indirect Kioxia stakes via Cayman SPVs: BCPE Pangea Intermediate Holdings Cayman, L.P. (SPC1: $4.65 billion) and BCPE Pangea Cayman2 Limited (SPC2: $9.57 billion convertible bond). These are marked utilizing an 8.95% liquidity discount, where a 1% fluctuation triggers a $55.8 million fair value swing. Footnotes indicate SPC1 sold all remaining Kioxia equity in June 2026, setting up a massive 2Q26 liquidity event.
Infrastructure Layout and Geopolitical Supply Chain Frictions
SK hynix Inc. is structurally re-architecting its manufacturing footprint away from Chinese exposure toward South Korean mega-clusters and localized U.S. packaging, targeting a long-term CapEx-to-sales ratio in the mid-30% range. Wafers represent 10% of total Cost of Goods Sold, with equipment lead times from entities like ASML Holding N.V. [NASDAQ: ASML] exceeding 12 months.
Geographic Revenue & Customer Concentration (1Q26)
The top two customers (including NVIDIA Corporation [NASDAQ: NVDA]) accounted for 14.8% and 12.4% of total revenue respectively (cumulative 27.2%), up from a single-customer peak of 23.9% in 2025 and 16.5% in 2024.
* United States: $23.92 billion (64.7%), down proportionally from $47.06 billion (68.8%) in 2025, yet dwarfing the $29.52 billion (63.4%) in 2024.
* China: $9.00 billion (24.3%), up proportionally from $13.46 billion (19.7%) in 2025.
* Asia (ex-China): $3.15 billion (8.5%).
* Europe: $0.79 billion (2.1%).
* South Korea: $0.13 billion (0.3%).
Physical Fab Architecture & Mega-Cluster Commitments
* South Korea (Unrestricted Tech): The domestic cluster houses M10, M14, and M16 fabs in Icheon, and M11, M12, M15, and M15X (wafer input began 1Q26) fabs in Cheongju. The firm explicitly earmarked $32.0 billion from an estimated $28.0 billion net offering proceeds to domestic buildouts. Key pipelines include the $422.1 billion Yongin multi-fab cluster (completing 2033; Phase 1 cleanroom Q1 2027), a $35.18 billion allocation to Yongin/Cheongju by 2030, a $13.37 billion Cheongju P&T7 packaging plant (cleanroom end-2027), a planned $70.35 billion general Cheongju expansion, and preliminary designs for a $281.41 billion Southwestern complex. SK hynix Inc. allocated $8.37 billion strictly for ASML Extreme Ultraviolet (EUV) scanners (deliveries by December 2027) to drive 1c nm DRAM and 321-layer NAND architectures.
* Mainland China (Frozen CapEx): Facilities include C2 and C2F (Wuxi), Dalian (NAND), and Chongqing (Packaging). The U.S. Bureau of Industry and Security revoked the firm's Validated End-User status effective December 31, 2025, forcing reliance on an annual license secured for 2026. U.S. CHIPS Act guardrails prohibit material capacity expansion here for 10 years. Sales to Huawei remain suspended since September 2020.
* United States (Subsidized Packaging): Executing a $4.15 billion advanced packaging facility in West Lafayette, Indiana (cleanroom 2H 2028). The project is eligible for $458 million in CHIPS Act grants and $570 million in loans. Operations face domestic friction, with a local lawsuit filed in June 2025 to void re-zoning ordinances heading to a bench trial in December 2026.
Tariff Threats and Trade Architecture
The U.S. imposed a 15% reciprocal tariff in August 2025 and a 15% Section 122 temporary surcharge in February 2026, alongside documented threats of a 100% tariff on un-localized semiconductor imports. In China, the State Administration for Market Regulation mandated a 5-year "reasonable pricing" cap expiring December 2026 as a condition for the $8.8 billion Intel Corporation [NASDAQ: INTC] NAND (Solidigm) acquisition, capping regional margins despite global eSSD pricing spikes.
HDIN Institutional Verdict
SK hynix Inc. operates an accounting framework highly dependent on subjective management engineering. In 2025, total depreciation absorbed $9.77 billion; however, the commencement of depreciation on $12.40 billion in machinery is triggered exclusively by internal "ready for intended use" testing. This structural ambiguity grants management the direct lever to artificially suppress or inflate quarterly operating margins based on test protocol timing. Concurrently, strict capitalization parameters resulted in $4.55 billion of the $4.74 billion 2025 R&D spend being expensed immediately (only $188 million capitalized). In 1Q26, $1.72 billion of the $1.79 billion total R&D was expensed ($70 million capitalized). Capitalized development costs face straight-line amortization over a two-year useful life, following a $117.5 million impairment on obsolete R&D in 2023.
The global IP portfolio (4,823 domestic patents, 130 trademarks, 18 copyrights, 7 design rights; 16,680 international patents, 263 trademarks, 1 copyright, 4 design rights) is under active assault. MonolithIC 3D Inc. filed ITC complaints in February and May 2026 targeting 12 patents on 3D DRAM/NAND stacking, carrying an August 2027 completion target and limited exclusion order tail-risks. Concurrently, a U.S. antitrust class action filed on June 25, 2026, alleges coordinated capacity starvation of traditional DRAM, echoing ongoing China SAMR DRAM antitrust probes initiated in May 2018. Technologically, hardware architecture faces TAM-compression risks from advanced LLM algorithms, such as TurboQuant (March 2026). To offset architectural risks, the firm committed $10 billion to a U.S. AI venture fund by 2030 and initiated custom co-engineering (AI-D configurations like MRDIMM, SOCAMM2, CMM, LPDDR6 PIM) for NVIDIA Vera Rubin and Jetson Thor platforms.
From a governance standpoint, SK Group enforces absolute control via SK square's 20.50% statutory minimum stake (compliant with MRFTA rules), backed by SK Inc.'s 32.14% ownership of SK square, and Chairman Tae Won Chey's 17.90% stake in SK Inc. Corporate defense is fortified by supermajority requirements for special resolutions (66.6% present / 33.3% issued voting shares). The company mitigates chaebol scrutiny over extreme Related-Party Transactions—including $3.31 billion to SK ecoplant, $1.92 billion to ESSENCORE, $787.9 million for an Icheon REIT wastewater sale, and $575.5 million to PRISM Energy—via a 10-member board with 6 independent directors, maintaining 100% independent Audit (4 members) and Nomination (3 members) committees.
Human capital retention operates without binding non-competes. Defense relies on 2-5 year exercisable stock options (authorized up to 10%, 15% by special resolution), 1-year SARs, a 10% operating profit-sharing pool, and 3-year vesting Performance Shared Units capped at 200% payouts (forfeited upon resignation within 2 years). The firm deployed 1.43 million treasury shares to 49,566 employees in 2025, cancelled 15.3 million treasury shares in 2026, and retains 26.31 million shares for White Knight deployment. Total D&O insurance coverage is capped at $70.3 million. Capital discipline is paired with a W1,500 ($1.06) annual dividend, dispersed in $0.26 quarterly tranches through 2027.
Presentation Download & Video Access:
- Presentation Download: Click the PDF download link under 'Related Topics' to access the full institutional presentation of this report.
- Video Link: Click this link to watch the HDIN analyst briefing on YouTube.
About HDIN Research:
HDIN Research is a premier global market intelligence and strategic advisory firm specializing in institutional-grade financial analysis, supply chain audits, and macroeconomic forecasting. Our dedicated sector analysts deliver actionable, data-driven insights tailored for private equity, hedge funds, and corporate strategy teams. Visit us at http://www.hdinresearch.com.
2026 AI Transparency Footer:
"This intelligence report was authored by HDIN Research analysts following a rigorous audit of official corporate filings. AI was utilized for massive-scale data synthesis and structural drafting, ensuring 100% inclusion of reported data points. All strategic insights, financial modeling, and final verdicts were verified by our editorial board to ensure professional accuracy and compliance with 2026 Google Search E-E-A-T standards."
1. SK hynix Inc. reversed a $6.43 billion net loss in 2023 to a $28.38 billion net profit in 1Q26, driven by a 56.4% market share in High-Bandwidth Memory (HBM) that commands a >5x pricing premium over traditional DRAM.
2. Unrecognized off-balance-sheet capital commitments surged to $21.75 billion in 1Q26 to fund South Korean mega-clusters, countering U.S. CHIPS Act guardrails that legally freeze capacity expansions at Chinese fabrication plants following the revocation of Validated End-User status.
3. Management retains immense latent earnings control via subjective machinery depreciation triggers, actively shielding a highly sensitive $9.57 billion Level 3 Kioxia asset structure while immediately expensing $1.72 billion of the $1.79 billion 1Q26 R&D outlay.
Figure SK hynix: Strategic Transition to a Full-Stack Al Memory Leader
Segmental Realities and Margin Hyper-ExpansionSK hynix Inc. executed a structural transition leveraging artificial intelligence infrastructure bottlenecks, generating a 198% YoY revenue acceleration in 1Q26. By artificially inducing a supply constraint in traditional DRAM through HBM cleanroom reallocation, the company achieved unprecedented margin leverage, compressing SG&A expenses to 3.1% of revenue in 1Q26.
Table 1: Consolidated Income & Operational Cash Flow Metrics (USD Billions)
| Metric | 2023 | 2024 | 2025 | 1Q26 |
|---|---|---|---|---|
| Total Revenue | $23.05M | $46.57M | $68.35M | $36.99M |
| Net Profit / (Loss) | $(6.43)M | $13.93M | $30.22M | $28.38M |
| Operating Cash Flow (OCF) | $3.01M | $20.96M | $37.55M | $18.52M |
| Free Cash Flow (FCF) | $(2.85)M | $9.74M | $18.19M | $13.13M |
| Adjusted EBITDA | $4.14M | $25.34M | $42.98M | $29.08M |
| Capital Expenditures | $5.86M | $11.22M | $19.36M | $5.39M |
| Gross Margin | (1.6%) | 48.1% | 60.4% | 79.3% |
| Operating Margin | (23.6%) | 35.4% | 48.6% | 71.5% |
| Adjusted EBITDA Margin | N/A | N/A | 62.9% | 78.6% |
Segmental Pricing Power & Output Realities (1Q26 vs. 2025 vs. 2024)
* DRAM & HBM Segment: Reached $28.60 billion in 1Q26 (77.3% of total revenue), accelerating from $52.70 billion (77.1%) in 2025 and $31.47 billion (67.6%) in 2024. Despite flat QoQ bit sales volume in 1Q26, Average Selling Prices (ASP) expanded by the mid-60% range. Total DRAM market share stands at 29.1% (#2 globally). Management forecasts traditional DRAM ASPs to jump 136.4% YoY in 1Q26 and 198.1% YoY in 2Q26.
* NAND Flash & eSSD Segment: Generated $8.14 billion in 1Q26 (22.0% of total revenue), tracking against $14.56 billion (21.3%) in 2025 and $13.56 billion (29.1%) in 2024. While 1Q26 bit sales volume contracted 10% QoQ, ASPs surged in the mid-70% range. Market share is 18.5% (#2 globally), with projected >250% YoY ASP expansion in 2H26.
* Foundry & CIS Segment: Revenue compressed to $0.24 billion (0.7%) in 1Q26 from $1.09 billion (1.6%) in 2025. The CMOS Image Sensor (CIS) unit was integrated into AI memory operations in March 2025, triggering a $26.8 million impairment. Additionally, the SK hynix system ic (Wuxi) Co., Ltd. 8-inch foundry joint venture booked a $331.3 million impairment in 2025.
Balance Sheet Engineering & Off-Balance Sheet Liabilities
* Liquidity & Leverage: Total Assets expanded from $70.59 billion in 2023 to $156.77 billion in 1Q26, with Total Equity reaching $115.65 billion. The Liabilities-to-Equity Ratio plummeted from 87.5% (2023) to 46.0% (2025) and 35.6% (1Q26). The Net Borrowing Ratio dropped from 38.4% in 2023 to 11.5% in 2024, achieving a net-cash position by 2025 as Total Borrowings decreased from $20.73 billion to $13.59 billion in 1Q26. Highly liquid assets grew geometrically from $6.28 billion (2023) to $38.22 billion (1Q26).
* Inventory Accounting Levers: Total inventory carrying value reached $11.24 billion in 1Q26 (up from $9.48 billion in 2023). The valuation allowance peaked at $813.7 million in 2024, decreasing to $348.2 million in 2025 and $289.7 million in 1Q26. Notably, SK hynix Inc. utilized $545.0 million of this allowance upon sales in 2025, structurally inflating gross margins by selling previously written-down chips.
* Contingent Liabilities & Capitalization: Unrecognized capital commitments for property, plant, and equipment multiplied from $4.69 billion at FYE25 to $21.75 billion in 1Q26. Supply-chain factoring payables settled via external finance dropped from $1.23 billion (2025) to $624.7 million (1Q26). The firm maintains non-recourse receivables factoring lines of $837 million in the US and $21.1 million domestically. A $20.8 million purchase commitment provision was fully reversed in 2024. Furthermore, the company holds an off-balance-sheet guarantee of RMB 701 million ($98 million) for its Hystars Semiconductor (Wuxi) Co., Ltd. joint venture.
* Level 3 SPV Exposure (Kioxia): The balance sheet holds indirect Kioxia stakes via Cayman SPVs: BCPE Pangea Intermediate Holdings Cayman, L.P. (SPC1: $4.65 billion) and BCPE Pangea Cayman2 Limited (SPC2: $9.57 billion convertible bond). These are marked utilizing an 8.95% liquidity discount, where a 1% fluctuation triggers a $55.8 million fair value swing. Footnotes indicate SPC1 sold all remaining Kioxia equity in June 2026, setting up a massive 2Q26 liquidity event.
Infrastructure Layout and Geopolitical Supply Chain Frictions
SK hynix Inc. is structurally re-architecting its manufacturing footprint away from Chinese exposure toward South Korean mega-clusters and localized U.S. packaging, targeting a long-term CapEx-to-sales ratio in the mid-30% range. Wafers represent 10% of total Cost of Goods Sold, with equipment lead times from entities like ASML Holding N.V. [NASDAQ: ASML] exceeding 12 months.
Geographic Revenue & Customer Concentration (1Q26)
The top two customers (including NVIDIA Corporation [NASDAQ: NVDA]) accounted for 14.8% and 12.4% of total revenue respectively (cumulative 27.2%), up from a single-customer peak of 23.9% in 2025 and 16.5% in 2024.
* United States: $23.92 billion (64.7%), down proportionally from $47.06 billion (68.8%) in 2025, yet dwarfing the $29.52 billion (63.4%) in 2024.
* China: $9.00 billion (24.3%), up proportionally from $13.46 billion (19.7%) in 2025.
* Asia (ex-China): $3.15 billion (8.5%).
* Europe: $0.79 billion (2.1%).
* South Korea: $0.13 billion (0.3%).
Physical Fab Architecture & Mega-Cluster Commitments
* South Korea (Unrestricted Tech): The domestic cluster houses M10, M14, and M16 fabs in Icheon, and M11, M12, M15, and M15X (wafer input began 1Q26) fabs in Cheongju. The firm explicitly earmarked $32.0 billion from an estimated $28.0 billion net offering proceeds to domestic buildouts. Key pipelines include the $422.1 billion Yongin multi-fab cluster (completing 2033; Phase 1 cleanroom Q1 2027), a $35.18 billion allocation to Yongin/Cheongju by 2030, a $13.37 billion Cheongju P&T7 packaging plant (cleanroom end-2027), a planned $70.35 billion general Cheongju expansion, and preliminary designs for a $281.41 billion Southwestern complex. SK hynix Inc. allocated $8.37 billion strictly for ASML Extreme Ultraviolet (EUV) scanners (deliveries by December 2027) to drive 1c nm DRAM and 321-layer NAND architectures.
* Mainland China (Frozen CapEx): Facilities include C2 and C2F (Wuxi), Dalian (NAND), and Chongqing (Packaging). The U.S. Bureau of Industry and Security revoked the firm's Validated End-User status effective December 31, 2025, forcing reliance on an annual license secured for 2026. U.S. CHIPS Act guardrails prohibit material capacity expansion here for 10 years. Sales to Huawei remain suspended since September 2020.
* United States (Subsidized Packaging): Executing a $4.15 billion advanced packaging facility in West Lafayette, Indiana (cleanroom 2H 2028). The project is eligible for $458 million in CHIPS Act grants and $570 million in loans. Operations face domestic friction, with a local lawsuit filed in June 2025 to void re-zoning ordinances heading to a bench trial in December 2026.
Tariff Threats and Trade Architecture
The U.S. imposed a 15% reciprocal tariff in August 2025 and a 15% Section 122 temporary surcharge in February 2026, alongside documented threats of a 100% tariff on un-localized semiconductor imports. In China, the State Administration for Market Regulation mandated a 5-year "reasonable pricing" cap expiring December 2026 as a condition for the $8.8 billion Intel Corporation [NASDAQ: INTC] NAND (Solidigm) acquisition, capping regional margins despite global eSSD pricing spikes.
HDIN Institutional Verdict
SK hynix Inc. operates an accounting framework highly dependent on subjective management engineering. In 2025, total depreciation absorbed $9.77 billion; however, the commencement of depreciation on $12.40 billion in machinery is triggered exclusively by internal "ready for intended use" testing. This structural ambiguity grants management the direct lever to artificially suppress or inflate quarterly operating margins based on test protocol timing. Concurrently, strict capitalization parameters resulted in $4.55 billion of the $4.74 billion 2025 R&D spend being expensed immediately (only $188 million capitalized). In 1Q26, $1.72 billion of the $1.79 billion total R&D was expensed ($70 million capitalized). Capitalized development costs face straight-line amortization over a two-year useful life, following a $117.5 million impairment on obsolete R&D in 2023.
The global IP portfolio (4,823 domestic patents, 130 trademarks, 18 copyrights, 7 design rights; 16,680 international patents, 263 trademarks, 1 copyright, 4 design rights) is under active assault. MonolithIC 3D Inc. filed ITC complaints in February and May 2026 targeting 12 patents on 3D DRAM/NAND stacking, carrying an August 2027 completion target and limited exclusion order tail-risks. Concurrently, a U.S. antitrust class action filed on June 25, 2026, alleges coordinated capacity starvation of traditional DRAM, echoing ongoing China SAMR DRAM antitrust probes initiated in May 2018. Technologically, hardware architecture faces TAM-compression risks from advanced LLM algorithms, such as TurboQuant (March 2026). To offset architectural risks, the firm committed $10 billion to a U.S. AI venture fund by 2030 and initiated custom co-engineering (AI-D configurations like MRDIMM, SOCAMM2, CMM, LPDDR6 PIM) for NVIDIA Vera Rubin and Jetson Thor platforms.
From a governance standpoint, SK Group enforces absolute control via SK square's 20.50% statutory minimum stake (compliant with MRFTA rules), backed by SK Inc.'s 32.14% ownership of SK square, and Chairman Tae Won Chey's 17.90% stake in SK Inc. Corporate defense is fortified by supermajority requirements for special resolutions (66.6% present / 33.3% issued voting shares). The company mitigates chaebol scrutiny over extreme Related-Party Transactions—including $3.31 billion to SK ecoplant, $1.92 billion to ESSENCORE, $787.9 million for an Icheon REIT wastewater sale, and $575.5 million to PRISM Energy—via a 10-member board with 6 independent directors, maintaining 100% independent Audit (4 members) and Nomination (3 members) committees.
Human capital retention operates without binding non-competes. Defense relies on 2-5 year exercisable stock options (authorized up to 10%, 15% by special resolution), 1-year SARs, a 10% operating profit-sharing pool, and 3-year vesting Performance Shared Units capped at 200% payouts (forfeited upon resignation within 2 years). The firm deployed 1.43 million treasury shares to 49,566 employees in 2025, cancelled 15.3 million treasury shares in 2026, and retains 26.31 million shares for White Knight deployment. Total D&O insurance coverage is capped at $70.3 million. Capital discipline is paired with a W1,500 ($1.06) annual dividend, dispersed in $0.26 quarterly tranches through 2027.
Presentation Download & Video Access:
- Presentation Download: Click the PDF download link under 'Related Topics' to access the full institutional presentation of this report.
- Video Link: Click this link to watch the HDIN analyst briefing on YouTube.
About HDIN Research:
HDIN Research is a premier global market intelligence and strategic advisory firm specializing in institutional-grade financial analysis, supply chain audits, and macroeconomic forecasting. Our dedicated sector analysts deliver actionable, data-driven insights tailored for private equity, hedge funds, and corporate strategy teams. Visit us at http://www.hdinresearch.com.
2026 AI Transparency Footer:
"This intelligence report was authored by HDIN Research analysts following a rigorous audit of official corporate filings. AI was utilized for massive-scale data synthesis and structural drafting, ensuring 100% inclusion of reported data points. All strategic insights, financial modeling, and final verdicts were verified by our editorial board to ensure professional accuracy and compliance with 2026 Google Search E-E-A-T standards."