Shanghai Advanced Silicon Technology: $693.00M Capex Pivot Near Shanghai as 2025 VAT Policy Shock Signals Structural Solvency Pressures
Date : 2026-07-09
Reading : 105
HDIN Executive Takeaways
1. Revenue reached $214.21 million in 2025, but 20-year machinery depreciation schedules masked severe negative gross margins (-6.49%), driving a -$279.04 million net loss and a -$831.35 million unrecovered deficit.
2. While maintaining R&D hubs in Shanghai, AST relies on German and Japanese oligopolies for $59.29 million in polysilicon, alongside $363.87 million in U.S. equipment contracts.
3. A 2026 cancellation of VAT export refunds will eliminate a crucial $11.76 million cash channel, threatening the $693.00 million capacity expansion amid a -5.40x interest coverage ratio.
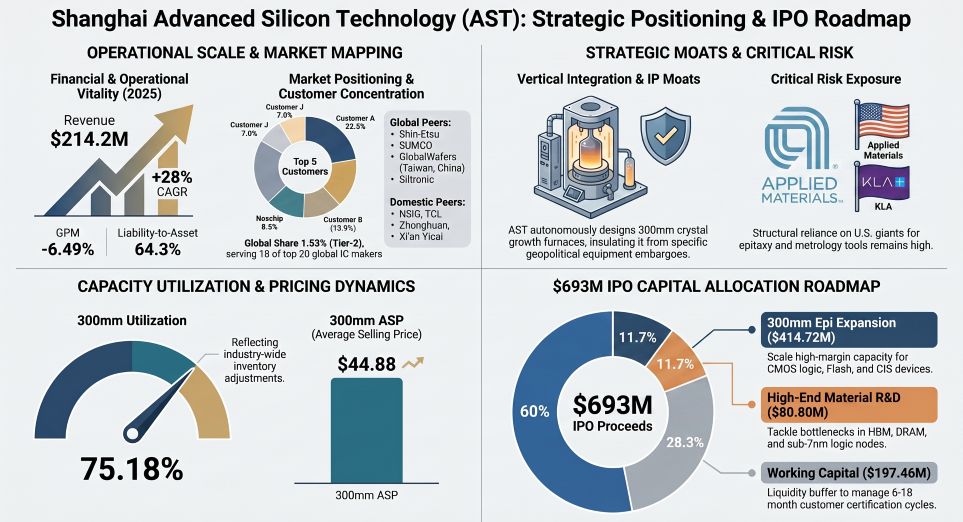
Figure Shanghai Advanced Silicon Technology (AST): Strategic Positioning & lPO Roadmap
 Segmental Realities and Margin Compression
Shanghai Advanced Silicon Technology [IPO: AST] reports escalating top-line revenues counterbalanced by extreme margin erosion. In 2025, total operating revenue hit $214.21 million, an acceleration from $184.67 million in 2024 and $129.08 million in 2023. Total main business revenue reached $213.36 million (1,533.56 million CNY). The structural gross loss registered -$13.90 million (-9,994.89 million CNY converted), culminating in a highly distressed net profit margin of -130.26%. Continuous capital expenditure unbacked by operating cash flows has driven return on equity (ROE) down from -14.78% in 2023 to -31.25% in 2025.
Segment Unit Economics & Volume Variations (2025)
* 300mm Wafers: Generated $116.36 million (54.53% of main revenue), partitioned into polished wafers ($115.01 million) and epitaxial wafers ($1.34 million). Capacity stood at 3.67 million wafers. The utilization rate degraded to 75.18% (down from 86.92% in 2024). Production volume reached 2.76 million wafers, with sales at 2.59 million (93.96% production-to-sales ratio). The average selling price (ASP) contracted from $53.70 (385.97 CNY) in 2023 to $44.88 (322.57 CNY) in 2025.
* 200mm Wafers: Generated $85.13 million (39.90% of main revenue), split among polished ($63.13 million), argon annealed ($14.14 million), and SOI/epitaxial ($7.87 million). Capacity recorded 4.49 million wafers with an 82.11% utilization rate (down from 87.63% in 2024). Production reached 3.69 million, while sales hit 3.70 million (>100% ratio via inventory drawdown). ASP contracted from $29.06 (208.84 CNY) in 2023 to $25.11 (180.50 CNY) in 2025.
* Processing Services: Wafer regeneration and silicon rod processing provided $11.88 million (5.57%).
Geographic Revenue Dispersion & Client Concentration (2025)
* Domestic (Mainland China): $102.47 million (48.02%).
* Overseas: $110.90 million (51.98%). Breakdown: Taiwan, China at $31.31 million (14.67%); Free Trade Zones at $24.76 million (11.60%); South Korea at $17.88 million (8.38%); Singapore at $8.56 million (4.01%); Japan at $8.28 million (3.88%); USA at $7.10 million (3.33%); and Germany at $4.03 million (1.89%).
* Sales Architecture: Direct sales represented 93.13% ($198.72 million), while trade-agent models accounted for 6.87%.
* Customer Concentration: The top 5 customers represented 60.54% ($129.69 million) of revenue. Customer A generated $48.28 million (22.54%); Customer B generated $29.80 million (13.91%); Customer C generated $18.34 million (8.56%); Nexchip generated $18.28 million (8.53%); Customer J generated $14.99 million (7.00%).
Table Balance Sheet Liquidity & Cash Flow Architecture
Infrastructure Layout and Regional Moats
AST operates a dual-hub manufacturing nexus consisting of the Shanghai Headquarters (Songjiang District) controlling 300mm automated production and core R&D, paired with the Chongqing Base (Liangjiang New Area) driving 200mm mass production. International supply chain management is routed through branches in Singapore (Shanghai AST Singapore Pte. Ltd.), Seoul (South Korea), and Tokyo (Japan).
In 2025, total operating costs totaled $228.06 million (1,639.17 million CNY). The structure was dominated by direct materials at 58.97% ($134.49 million), followed by manufacturing overhead at 46.36% ($105.72 million), direct labor at 8.20% ($18.70 million), and offsets at -13.92%. Energy dependency required 263.96 million kWh of electricity priced at $0.10/kWh (0.71 CNY), totaling $25.95 million (186.54 million CNY), and 4.91 million tons of water for $2.61 million (18.77 million CNY).
Supply Chain Concentration & Equipment Engineering
The top 5 suppliers commanded 55.96% ($95.03 million) of total procurement. Electronic-grade polysilicon represented the primary material choke point at $59.29 million (34.91% of material costs), negotiated down to $41.26/kg from $42.56/kg in 2024.
* Key Material Vendors: Shanghai Nagase supplied $36.89 million (21.72%). Wacker Chemie AG supplied $23.11 million (13.61%), supported by $24.15 million in structural prepayments to secure supply. Marubeni supplied $13.29 million (7.83%). Shanghai Chongcheng supplied $12.33 million (7.26%). Sun Silicon supplied $9.41 million (5.54%).
* Capex & Legacy Connections: Historical capital expenditures utilized connected parties, routing $71.74 million in 2022 via Sun Silicon/United Semiconductor (representing 26.99% of raw materials and 18.59% of equipment). A power engineering contract via Zhongfu Construction registered $20.41 million (14,672.37k CNY) in 2023 at a 26.70% margin. A legacy fund occupation of $6.96 million (50 million CNY) was cleared in 2022.
* Imported Process Equipment: Operations rely on $173.80 million in Applied Materials contracts ($128.50M + $45.30M) for epitaxy systems, and $190.07 million in KLA Corporation contracts ($93.77M + $63.30M + $33.00M) for metrology. EPC operations are managed by Exyte Shanghai via $188.52 million in contracts.
Intellectual Property & Human Capital Architecture
The company capitalized absolutely $0 of its R&D expenditures. Purely expensed R&D outlays registered $22.14 million in 2023, $34.26 million in 2024, and $32.61 million in 2025. The 2025 R&D intensity ratio hit 15.22%, doubling the domestic peer average of 6.92%, with a 3-year cumulative ratio of 16.86%.
The IP portfolio contains 99 authorized patents (54 invention, 45 utility) and 47 industrialized patents, alongside 8 software copyrights, 12 trademarks (1 in the USA), and an exclusive joint laboratory application right with Fudan University. A specialized patent (JP7610080) is authorized in Japan. Total personnel reached 1,636. The 230 R&D personnel (14.06% of the workforce) include 15 PhDs (6.52%), 53 Masters (23.04%), 145 Bachelors (63.04%), and 17 Associate/below (7.39%). Demographic data confirms 46.03% of staff are aged 30 or below, 39.98% are 31-40, 11.00% are 41-50, and 3.00% are 51 or above.
HDIN Institutional Verdict
AST leverages highly advanced autonomous 300mm crystal growth IP to combat its sub-scale global market position. Competing in a $13.99 billion global arena where Shin-Etsu and SUMCO push >2.5 million wafers/month and the top five control 80% market share, AST captures merely 1.53% ($213.43 million). Domestically, its 320,000 wafers/month 300mm capacity trails TCL Zhonghuan ($794.02 million revenue, 5.68% share), NSIG (863,300 wafers/month, $495.86 million revenue, 3.54% share), and Xi'an Yicai (>850,000 wafers/month, $366.75 million revenue, 2.62% share).
Corporate Governance & Accounting Realities
* Dual-Class Mechanics: Chairman Chen Meng controls 138.54 million A-class shares via Shanghai Yuanzhi and Shanghai Yuanying. Under an 8-to-1 super-voting structure, this translates to an 11.78% economic interest commanding a 51.64% absolute voting majority. The 9-member board features 3 independent directors (Zhang Xin, Chu Junhao, Bai Xuedong). Other technical leaders include Zhang Junbao (64 patents/37 inventions), Hu Hao, Liang Yongli, and VP Song Hongwei.
* Equity Incentives: 52.94 million options were issued in 2022 to 133 employees via 5 platforms (Shanghai Zhigui, Suzhou Zhilan, Shanghai Zhijing, Shanghai Zhixin, Shanghai Zhiqing), tethered to a $208.69 million revenue target.
* Earnings Management: AST enforces an exceptionally aggressive upper-bound depreciation schedule of 20 years for machinery (4.75%-31.67% rate, 5.00% residual). Buildings depreciate over 20-40 years (2.38%-4.75%), vehicles over 4-5 years (19.00%-23.75%), and other equipment over 3-10 years (9.50%-31.67%). This structural mechanism artificially compresses immediate annual losses during the $1,235.63 million fixed-asset ramp-up.
Tax Policy Shock & $693.00M IPO Deployment
* Non-Operating Income: Government subsidies classified as Non-Recurring Gains and Losses (NRGL) recorded $1.64 million in 2023, $3.16 million in 2024, and $5.17 million in 2025. Other income tracked at $1.26 million, $2.92 million, and $4.85 million across the same period. Net NRGL hit -$0.30 million in 2023, $0.14 million in 2024, and $4.61 million in 2025 (offsetting a negligible 1.65% of the total net loss).
* Regulatory Cash Void: The company operates under a 15% HNTE tax rate, yet relies heavily on VAT export refunds, which generated $11.46 million in 2023, $11.33 million in 2024, and $11.76 million in 2025 (5.49% of 2025 revenue). Following a reduction from 13% to 9% on December 1, 2024, a complete cancellation of this rebate goes into effect April 1, 2026, threatening severe localized short-term cash flow contractions.
* Capital Allocation: The $693.00 million (4,980.82 million CNY) IPO mandates $414.72 million (2,980.82 million CNY, 59.8%) to construct 1.8 million 300mm thin-layer epitaxial wafers. An $80.80 million (580.77 million CNY, 11.7%) injection targets R&D for HBM COP-Free and 28-14nm node technology, while $197.46 million (1,419.23 million CNY, 28.5%) shores up working capital. Total design targets demand 9.6 million 300mm wafers (800,000/month) and 4.8 million 200mm wafers (400,000/month). A projected 2028 break-even strictly depends on reaching 660,000 wafers/month at 300mm alongside a 31% epitaxial sales mix.
Presentation Download & Video Access:
- Presentation Download: Click the PDF download link under 'Related Topics' to access the full institutional presentation of this report.
- Video Link: Click this link to watch the HDIN analyst briefing on YouTube.
About HDIN Research:
HDIN Research is a premier global market intelligence and strategic advisory firm specializing in institutional-grade financial analysis, supply chain audits, and macroeconomic forecasting. Our dedicated sector analysts deliver actionable, data-driven insights tailored for private equity, hedge funds, and corporate strategy teams. Visit us at http://www.hdinresearch.com.
2026 AI Transparency Footer:
"This intelligence report was authored by HDIN Research analysts following a rigorous audit of official corporate filings. AI was utilized for massive-scale data synthesis and structural drafting, ensuring 100% inclusion of reported data points. All strategic insights, financial modeling, and final verdicts were verified by our editorial board to ensure professional accuracy and compliance with 2026 Google Search E-E-A-T standards."
1. Revenue reached $214.21 million in 2025, but 20-year machinery depreciation schedules masked severe negative gross margins (-6.49%), driving a -$279.04 million net loss and a -$831.35 million unrecovered deficit.
2. While maintaining R&D hubs in Shanghai, AST relies on German and Japanese oligopolies for $59.29 million in polysilicon, alongside $363.87 million in U.S. equipment contracts.
3. A 2026 cancellation of VAT export refunds will eliminate a crucial $11.76 million cash channel, threatening the $693.00 million capacity expansion amid a -5.40x interest coverage ratio.
Figure Shanghai Advanced Silicon Technology (AST): Strategic Positioning & lPO Roadmap
Segmental Realities and Margin CompressionShanghai Advanced Silicon Technology [IPO: AST] reports escalating top-line revenues counterbalanced by extreme margin erosion. In 2025, total operating revenue hit $214.21 million, an acceleration from $184.67 million in 2024 and $129.08 million in 2023. Total main business revenue reached $213.36 million (1,533.56 million CNY). The structural gross loss registered -$13.90 million (-9,994.89 million CNY converted), culminating in a highly distressed net profit margin of -130.26%. Continuous capital expenditure unbacked by operating cash flows has driven return on equity (ROE) down from -14.78% in 2023 to -31.25% in 2025.
Segment Unit Economics & Volume Variations (2025)
* 300mm Wafers: Generated $116.36 million (54.53% of main revenue), partitioned into polished wafers ($115.01 million) and epitaxial wafers ($1.34 million). Capacity stood at 3.67 million wafers. The utilization rate degraded to 75.18% (down from 86.92% in 2024). Production volume reached 2.76 million wafers, with sales at 2.59 million (93.96% production-to-sales ratio). The average selling price (ASP) contracted from $53.70 (385.97 CNY) in 2023 to $44.88 (322.57 CNY) in 2025.
* 200mm Wafers: Generated $85.13 million (39.90% of main revenue), split among polished ($63.13 million), argon annealed ($14.14 million), and SOI/epitaxial ($7.87 million). Capacity recorded 4.49 million wafers with an 82.11% utilization rate (down from 87.63% in 2024). Production reached 3.69 million, while sales hit 3.70 million (>100% ratio via inventory drawdown). ASP contracted from $29.06 (208.84 CNY) in 2023 to $25.11 (180.50 CNY) in 2025.
* Processing Services: Wafer regeneration and silicon rod processing provided $11.88 million (5.57%).
Geographic Revenue Dispersion & Client Concentration (2025)
* Domestic (Mainland China): $102.47 million (48.02%).
* Overseas: $110.90 million (51.98%). Breakdown: Taiwan, China at $31.31 million (14.67%); Free Trade Zones at $24.76 million (11.60%); South Korea at $17.88 million (8.38%); Singapore at $8.56 million (4.01%); Japan at $8.28 million (3.88%); USA at $7.10 million (3.33%); and Germany at $4.03 million (1.89%).
* Sales Architecture: Direct sales represented 93.13% ($198.72 million), while trade-agent models accounted for 6.87%.
* Customer Concentration: The top 5 customers represented 60.54% ($129.69 million) of revenue. Customer A generated $48.28 million (22.54%); Customer B generated $29.80 million (13.91%); Customer C generated $18.34 million (8.56%); Nexchip generated $18.28 million (8.53%); Customer J generated $14.99 million (7.00%).
Table Balance Sheet Liquidity & Cash Flow Architecture
| Financial Metric | FY2025 Data Output |
|---|---|
| Asset Structure | Total Assets: $2,124.10M. Non-current Assets: 82.73% of total assets. Fixed Assets: $1,235.63M. Construction in Progress: $213.85M. Asset Turnover: 0.10x. |
| Liability Profile | Total Liabilities: $1,365.97M. Long-term Borrowings: $854.92M (+33.3% YoY). Debt-to-Asset Ratio: 64.31% (up from 55.39% in 2023). |
| Liquidity Metrics | Current Ratio: 1.03x. Quick Ratio: 0.59x. Interest Coverage: -5.40x. Accounts Receivable Turnover: 4.98x (vs. 4.28x in 2023). A/R Aged <1 Year: 99.90%. Equity Multiplier: 2.80x (up from 2.24x in 2023). |
| Cash Flow | Operating Cash Flow (OCF): -$83.93M (RMB -60,324.70M), compared with -$60.48M in 2023. Investing Cash Flow / CapEx: $119.54M (down from $202.70M in 2024 and $394.48M in 2023). Free Cash Flow (FCF): $167.55M. |
| Asset Impairments | Inventory: $158.42M (RMB 1,138.65M) with an impairment provision of $73.86M (RMB 530.87M), representing a 31.80% provisioning ratio (vs. peer average of 12.55%). Goodwill: $124.67M (RMB 896.06M) related to the 2020 Chongqing AST acquisition, with a recognized impairment loss of $69.30M (RMB 498.10M). |
| Accumulated Deficits | Historical losses resulted in accumulated deficits disclosed at -$83.13M, with corresponding nominal disclosures of RMB 5,975.33M (-$831.35M equivalent) across company filings. |
Infrastructure Layout and Regional Moats
AST operates a dual-hub manufacturing nexus consisting of the Shanghai Headquarters (Songjiang District) controlling 300mm automated production and core R&D, paired with the Chongqing Base (Liangjiang New Area) driving 200mm mass production. International supply chain management is routed through branches in Singapore (Shanghai AST Singapore Pte. Ltd.), Seoul (South Korea), and Tokyo (Japan).
In 2025, total operating costs totaled $228.06 million (1,639.17 million CNY). The structure was dominated by direct materials at 58.97% ($134.49 million), followed by manufacturing overhead at 46.36% ($105.72 million), direct labor at 8.20% ($18.70 million), and offsets at -13.92%. Energy dependency required 263.96 million kWh of electricity priced at $0.10/kWh (0.71 CNY), totaling $25.95 million (186.54 million CNY), and 4.91 million tons of water for $2.61 million (18.77 million CNY).
Supply Chain Concentration & Equipment Engineering
The top 5 suppliers commanded 55.96% ($95.03 million) of total procurement. Electronic-grade polysilicon represented the primary material choke point at $59.29 million (34.91% of material costs), negotiated down to $41.26/kg from $42.56/kg in 2024.
* Key Material Vendors: Shanghai Nagase supplied $36.89 million (21.72%). Wacker Chemie AG supplied $23.11 million (13.61%), supported by $24.15 million in structural prepayments to secure supply. Marubeni supplied $13.29 million (7.83%). Shanghai Chongcheng supplied $12.33 million (7.26%). Sun Silicon supplied $9.41 million (5.54%).
* Capex & Legacy Connections: Historical capital expenditures utilized connected parties, routing $71.74 million in 2022 via Sun Silicon/United Semiconductor (representing 26.99% of raw materials and 18.59% of equipment). A power engineering contract via Zhongfu Construction registered $20.41 million (14,672.37k CNY) in 2023 at a 26.70% margin. A legacy fund occupation of $6.96 million (50 million CNY) was cleared in 2022.
* Imported Process Equipment: Operations rely on $173.80 million in Applied Materials contracts ($128.50M + $45.30M) for epitaxy systems, and $190.07 million in KLA Corporation contracts ($93.77M + $63.30M + $33.00M) for metrology. EPC operations are managed by Exyte Shanghai via $188.52 million in contracts.
Intellectual Property & Human Capital Architecture
The company capitalized absolutely $0 of its R&D expenditures. Purely expensed R&D outlays registered $22.14 million in 2023, $34.26 million in 2024, and $32.61 million in 2025. The 2025 R&D intensity ratio hit 15.22%, doubling the domestic peer average of 6.92%, with a 3-year cumulative ratio of 16.86%.
The IP portfolio contains 99 authorized patents (54 invention, 45 utility) and 47 industrialized patents, alongside 8 software copyrights, 12 trademarks (1 in the USA), and an exclusive joint laboratory application right with Fudan University. A specialized patent (JP7610080) is authorized in Japan. Total personnel reached 1,636. The 230 R&D personnel (14.06% of the workforce) include 15 PhDs (6.52%), 53 Masters (23.04%), 145 Bachelors (63.04%), and 17 Associate/below (7.39%). Demographic data confirms 46.03% of staff are aged 30 or below, 39.98% are 31-40, 11.00% are 41-50, and 3.00% are 51 or above.
HDIN Institutional Verdict
AST leverages highly advanced autonomous 300mm crystal growth IP to combat its sub-scale global market position. Competing in a $13.99 billion global arena where Shin-Etsu and SUMCO push >2.5 million wafers/month and the top five control 80% market share, AST captures merely 1.53% ($213.43 million). Domestically, its 320,000 wafers/month 300mm capacity trails TCL Zhonghuan ($794.02 million revenue, 5.68% share), NSIG (863,300 wafers/month, $495.86 million revenue, 3.54% share), and Xi'an Yicai (>850,000 wafers/month, $366.75 million revenue, 2.62% share).
Corporate Governance & Accounting Realities
* Dual-Class Mechanics: Chairman Chen Meng controls 138.54 million A-class shares via Shanghai Yuanzhi and Shanghai Yuanying. Under an 8-to-1 super-voting structure, this translates to an 11.78% economic interest commanding a 51.64% absolute voting majority. The 9-member board features 3 independent directors (Zhang Xin, Chu Junhao, Bai Xuedong). Other technical leaders include Zhang Junbao (64 patents/37 inventions), Hu Hao, Liang Yongli, and VP Song Hongwei.
* Equity Incentives: 52.94 million options were issued in 2022 to 133 employees via 5 platforms (Shanghai Zhigui, Suzhou Zhilan, Shanghai Zhijing, Shanghai Zhixin, Shanghai Zhiqing), tethered to a $208.69 million revenue target.
* Earnings Management: AST enforces an exceptionally aggressive upper-bound depreciation schedule of 20 years for machinery (4.75%-31.67% rate, 5.00% residual). Buildings depreciate over 20-40 years (2.38%-4.75%), vehicles over 4-5 years (19.00%-23.75%), and other equipment over 3-10 years (9.50%-31.67%). This structural mechanism artificially compresses immediate annual losses during the $1,235.63 million fixed-asset ramp-up.
Tax Policy Shock & $693.00M IPO Deployment
* Non-Operating Income: Government subsidies classified as Non-Recurring Gains and Losses (NRGL) recorded $1.64 million in 2023, $3.16 million in 2024, and $5.17 million in 2025. Other income tracked at $1.26 million, $2.92 million, and $4.85 million across the same period. Net NRGL hit -$0.30 million in 2023, $0.14 million in 2024, and $4.61 million in 2025 (offsetting a negligible 1.65% of the total net loss).
* Regulatory Cash Void: The company operates under a 15% HNTE tax rate, yet relies heavily on VAT export refunds, which generated $11.46 million in 2023, $11.33 million in 2024, and $11.76 million in 2025 (5.49% of 2025 revenue). Following a reduction from 13% to 9% on December 1, 2024, a complete cancellation of this rebate goes into effect April 1, 2026, threatening severe localized short-term cash flow contractions.
* Capital Allocation: The $693.00 million (4,980.82 million CNY) IPO mandates $414.72 million (2,980.82 million CNY, 59.8%) to construct 1.8 million 300mm thin-layer epitaxial wafers. An $80.80 million (580.77 million CNY, 11.7%) injection targets R&D for HBM COP-Free and 28-14nm node technology, while $197.46 million (1,419.23 million CNY, 28.5%) shores up working capital. Total design targets demand 9.6 million 300mm wafers (800,000/month) and 4.8 million 200mm wafers (400,000/month). A projected 2028 break-even strictly depends on reaching 660,000 wafers/month at 300mm alongside a 31% epitaxial sales mix.
Presentation Download & Video Access:
- Presentation Download: Click the PDF download link under 'Related Topics' to access the full institutional presentation of this report.
- Video Link: Click this link to watch the HDIN analyst briefing on YouTube.
About HDIN Research:
HDIN Research is a premier global market intelligence and strategic advisory firm specializing in institutional-grade financial analysis, supply chain audits, and macroeconomic forecasting. Our dedicated sector analysts deliver actionable, data-driven insights tailored for private equity, hedge funds, and corporate strategy teams. Visit us at http://www.hdinresearch.com.
2026 AI Transparency Footer:
"This intelligence report was authored by HDIN Research analysts following a rigorous audit of official corporate filings. AI was utilized for massive-scale data synthesis and structural drafting, ensuring 100% inclusion of reported data points. All strategic insights, financial modeling, and final verdicts were verified by our editorial board to ensure professional accuracy and compliance with 2026 Google Search E-E-A-T standards."