Syntiant Corp. [NASDAQ: SYNT] executes a $114.4M Asia-Pacific sensor manufacturing pivot, reporting -14.3% analog margins and severe post-IPO equity dilution.
Date : 2026-07-09
Reading : 284
HDIN Executive Takeaways
1. Syntiant Corp.’s $114.4 million acquisition of Knowles Corporation's MEMS microphone division inverted its business model from high-margin artificial intelligence processors to capital-intensive hardware, compressing Q1 2026 organic revenue by 3.2% to $64.5 million.
2. Supply chain geography presents acute centralization risks, relying on 1,200 manufacturing personnel concentrated in Suzhou, China, and Penang, Malaysia, compounding reliance on a single Japanese supplier bound by a $47.1 million non-cancelable wafer commitment.
3. Post-IPO capitalization threatens public shareholders with mathematically defined dilution via $90.8 million in double-trigger stock-based compensation, 180-day lock-up float shocks, and preferred dividend crystallizations favoring strategic corporate backers.
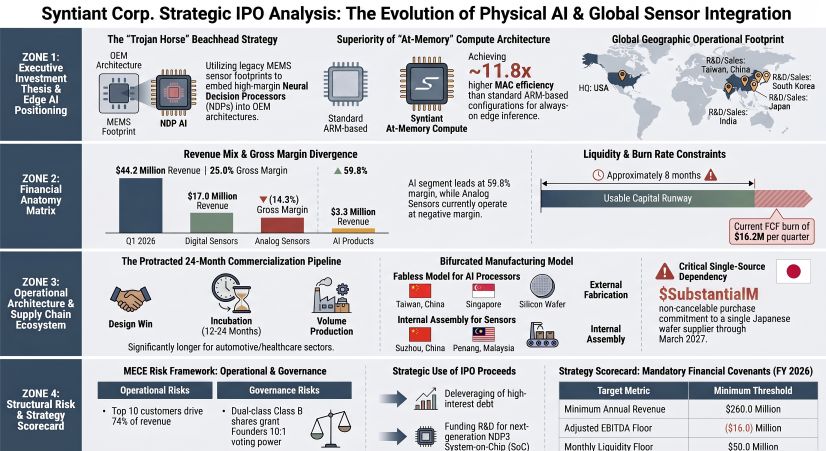
Figure Syntiant Corp Strategic lPO Analysis: The Evolution of Physical Al & Global Sensor Integration
 Segmental Realities and Financial Constraints
Syntiant Corp. [NASDAQ: SYNT] is executing a highly leveraged, capital-intensive scaling strategy following its $114.4 million acquisition of the Consumer MEMS Microphone (CMM) business from Knowles Corporation in December 2024. This transaction functionally replaced Syntiant Corp.'s high-margin, low-volume AI processor profile with a high-volume, low-margin acoustic sensor operation.
The financial structure exhibits sustained unprofitability, marked by an accumulated deficit of $215.5 million as of Q1 2026. The Q1 2026 gross margin stabilized marginally at 16.4%, driven by a strategic pivot toward Digital Sensors, while legacy Analog Sensors—subject to forced price concessions from the company's largest customer—generated a negative 14.3% gross margin (deteriorating from negative 5.5% in FY 2025). The absolute capital runway sits at approximately 2.6 quarters, calculated against a Q1 2026 Free Cash Flow (FCF) burn rate of $16.2 million and a March 31, 2026, cash and equivalents balance of $42.7 million.
To quantify the operational and segmental deterioration, HDIN Research extracts the following precise trajectory metrics:
* Total Revenue Trajectory: FY 2024 ($13.6 million); FY 2025 ($271.8 million); Q1 2025 ($66.6 million); Q1 2026 ($64.5 million).
* Segmental Revenue Breakdown (Q1 2026): Hardware/Products generated $63.7 million (98.8% of total), comprising Digital Sensors ($44.2 million, growing 5.6% or $2.3 million YoY) and Analog Sensors ($17.0 million, contracting 17.7% or $3.7 million YoY). Software, Licensing & Development Services contributed $0.76 million (1.2% of total). AI segment revenue contracted 19.1% YoY in Q1 2026.
* Gross Margin Architecture: FY 2024 (46.6%); FY 2025 (19.7%); Q1 2025 (16.1%); Q1 2026 (16.4%). Digital Sensors achieved 25.0% in Q1 2026. AI Processors printed 59.8% in Q1 2026 (benefiting from a 40% ASP increase and 71% unit volume expansion in FY 2025).
* Net Loss Expansion: FY 2024 negative $25.7 million; FY 2025 negative $60.9 million; Q1 2025 negative $14.1 million; Q1 2026 negative $20.9 million (exacerbated by a $5.0 million non-cash warrant remeasurement loss).
* Cash Flow & Liquidity: Operating Cash Flow (OCF) for Q1 2026 was negative $12.5 million, reversing FY 2025's $0.6 million positive OCF (which relied on $12.4 million in accounts payable extensions and $12.9 million in working capital reductions). Q1 2026 CapEx hit $3.7 million. FY 2024 OCF was negative $24.5 million; CapEx negative $0.2 million.
* Cost Structure Rigidity: SG&A consumed 14.9% of revenue in Q1 2026 ($9.6 million), up from 13.9% ($9.3 million) in Q1 2025, 14.5% in FY 2025, and 103.0% in FY 2024. R&D consumed 19.7% of revenue in Q1 2026 ($12.7 million), down slightly from 19.9% ($13.3 million) in Q1 2025, 19.3% in FY 2025, and 135.7% in FY 2024.
Geographic revenue generation indicates heavy reliance on the Asia-Pacific supply chain, though the United States serves as a primary bill-to destination. Total FY 2025 and Q1 2026 revenues scale geographically as follows: United States ($110.86 million / $24.77 million); Taiwan, China ($63.54 million / $14.93 million); South Korea ($38.44 million / $8.53 million); China ($37.97 million / $9.61 million, representing 14.9% of Q1 2026 revenue); Other Asian Countries ($17.47 million / $4.08 million); Europe ($3.13 million / $2.02 million); and Other ($0.39 million / $0.57 million).
The balance sheet is further constrained by restrictive debt covenants attached to a $53.5 million Term Loan (bearing a 23.4% effective interest rate in Q1 2026, a 13.0% fixed rate, and a $3.5 million end-of-term maturity fee due December 2028) and a $6.0 million to $6.4 million subordinated Seller Note with Knowles Corporation (8.0% fixed rate, maturing March 2029). These covenants dictate a mandatory $260.0 million in 2026 revenue, an Adjusted EBITDA floor of negative $16.0 million for 2026, a positive $5.0 million Adjusted EBITDA target for 2027, a continuous $15.0 million unrestricted cash floor, and $50.0 million in calculated total liquidity.
Infrastructure Layout and Geographic Moats
Syntiant Corp. utilizes a bifurcated operational architecture bridging a fabless semiconductor model for its Neural Decision Processors (NDPs) and an internal manufacturing base for its Micro-Electromechanical Systems (MEMS). Core 3 wafers are outsourced to foundries in Taiwan, China, while Core 2 wafers utilize Singaporean fabs, supplemented by capacity in Germany and Japan.
Conversely, the MEMS manufacturing operation is localized within a 220,000 square foot Class-1k cleanroom campus in Penang, Malaysia (acting as the Global Distribution Center) and an internal assembly facility in Suzhou, China. The Suzhou operation commands approximately 480 employees under a sublease costing $67,517 USD per month (RMB 485,279.69). Across all global operations, non-cancelable operating leases equal $14.8 million ($4.76 million in 2026; $4.14 million in 2027; $2.88 million in 2028; $1.83 million in 2029; and $1.19 million in 2030).
Of the 1,471 total global employees as of March 2026, 81.6% (1,200 personnel) are deployed in labor-intensive manufacturing, while 12.6% (185 personnel) execute R&D out of Irvine, California (Corporate HQ), Taiwan (China), South Korea, Japan, and India. Sales (55 personnel, 3.7%) and G&A (31 personnel, 2.1%) form the balance. In April 2026, the company acquired Orosound (France) and AudioSourceRE (Ireland) to bolster software intellectual property.
The physical hardware metrics reveal extreme volume divergence: MEMS sensor shipments exceeded 1 billion units in 2025 and 25 billion units historically, while AI-enabled devices represent the "tens of millions." The architectural differentiation relies on sub-milliwatt power draw and an "at-memory" compute structure, yielding 7.4x to 11.8x higher Multiply Accumulate (MAC) efficiency and 4.9x to 5.9x higher energy efficiency than an Arm Cortex-M85 plus Ethos-U55 MCU/NPU configuration. This technology is protected by 27 issued U.S. patents (expiring 2036-2044), 26 issued foreign patents, 16 pending U.S., and 23 pending foreign applications. The Knowles Corporation acquisition added perpetual, royalty-free exclusive rights (excluding Hearing Health) to 200 U.S. and 133 foreign patents, plus 67 pending applications, and 103 non-exclusive U.S. patents expiring 2027-2043.
Geographic concentration introduces systemic single-source vulnerabilities. The company relies entirely on a single Japanese supplier for MEMS wafers. The original agreement demanded 24,648 wafers ($12.0 million) by March 2025; 66,667 wafers ($32.3 million) by March 2026; and $38.3 million in wafers/services by March 2027. The remaining absolute purchase commitment stands at an inflexible $47.1 million. Furthermore, while the product stack is currently classified EAR99 for export, the impending U.S. Outbound Investment Security Program (OISP) designates Syntiant Corp.'s PRC subsidiaries as "controlled foreign entities." Global compliance adds structural friction regarding the EU AI Act (risking fines of €35 million or 7% of global turnover), GDPR, CCPA, and U.S. DoD CMMC/NIST SP 800-171 mandates. Syntiant Corp. also risks intellectual property deprecation due to reliance on open-source GNU General Public License software.
HDIN Institutional Verdict
The proposed capital transition is engineered to extract value for strategic corporate incumbents while transferring systemic execution risk to the public float. Syntiant Corp. operates at an intense customer concentration deficit: the top 10 customers commanded 74% of revenue in Q1 2026, 71% in Q1 2025, 74% in FY 2025, and 74% in FY 2024. The absolute largest buyer accounted for 30% of Q1 2026 revenue (38% in FY 2025), and the second largest accounted for 13% (15% in FY 2025). The top 10 sensor customers drove 78% ($47.6 million) of Q1 2026 sensor revenue, while the top 10 AI customers drove 76% ($2.5 million) of AI revenue.
Because commercialization cycles demand 12 to 24 months from design-win to volume production, Syntiant Corp.'s entire GTM strategy depends on shifting a customer from a 1x base sensor revenue multiplier up to an 8x-10x multiplier by cross-selling the upcoming NDP3 SoC family. Until this materializes, R&D human capital efficiency is fundamentally negative. While nominal Q1 2026 revenue per R&D employee measures $348,648 quarterly ($1.39 million annualized), this is artificially inflated by the 1,200 Asian manufacturing workers generating 95% of total sales. The true R&D cash drag prints a net loss of $112,972 per engineer per quarter ($451,891 annualized).
The post-IPO capitalization architecture ensures mathematically defined dilution. Founders and their trusts hold 100% of the Class B common stock (carrying 10 votes per share versus the public's 1 vote, sunsetting in seven years or six months post-departure), ensuring absolute entrenchment. Historical capital accumulation includes Series A-1 (3,430,528 shares at $1.166; $4.0 million preference), Series A-2 (1,090,896 shares at $0.97167; $1.06 million preference), Series B (7,644,902 shares at $3.27015; $25.0 million preference), Series C (7,080,764 shares at $4.94297; $35.0 million preference), Series C-1 (6,405,456 shares at $9.59848; $61.5 million preference), Series D-1 (8,320,004 shares at $9.59848; $79.9 million), and Series D-2 (8,334,652 shares at $9.59848; $86.6 million preference). Strategic backers Intel Capital Corporation purchased 260,457 shares ($2.5 million), and Microsoft Global Finance purchased 308,382 shares ($2.96 million).
Knowles Corporation, serving simultaneously as lender, landlord, customer, and supplier, holds 100% of the Series D-2 stock. Related Party Transactions (RPTs) demonstrate deep entanglement: Syntiant Corp. paid Knowles $18.4 million in FY 2025 and $3.6 million in Q1 2026 for metal cans; $2.4 million in FY 2025 and $0.7 million in Q1 2026 for facility rent; and $0.7 million in FY 2025 and $0.5 million in Q1 2026 for Transition Services (TSA). In return, Knowles paid Syntiant Corp. $0.6 million in FY 2025 and $0.2 million in Q1 2026 for MEMS release services, while assuming a 5% ($1.9 million) minimum wafer purchase commitment. Furthermore, 208,366 Series D-1 shares ($2.0 million) were issued for advisory equity, and insiders are permitted $120,000 IPO purchase exemptions.
Upon IPO execution, three distinct value-extraction mechanisms will strike the public float:
1. SBC Overhang: $90.8 million in double-trigger Restricted Stock Units (RSUs) will hit the P&L, including 3,000,000 RSUs for the CEO and 1,000,000 for the COO targeting a $1.5 billion to $3.5 billion market capitalization threshold.
2. Dividend Anti-Dilution Crystallization: Series D-1 and D-2 carry aggressive $0.76788 annual cumulative dividends (capped at $2.87954). By March 31, 2026, undeclared dividends reached $8.5 million and $8.3 million, respectively ($16.8 million total), which will convert into common equity directly diluting post-IPO shareholders. Additional dilution is guaranteed by 579,989 Series D-1 and 520,916 common stock warrants.
3. Float Supply Shocks: While a 180-day lock-up exists, exemptions for RSU "sell-to-cover" tax liabilities guarantee massive insider liquidation on exact dates: September 15, 2026; November 16, 2026; December 8, 2026; and January 5, 2027.
Presentation Download & Video Access:
- Presentation Download: Click the PDF download link under 'Related Topics' to access the full institutional presentation of this report.
- Video Link: Click this link to watch the HDIN analyst briefing on YouTube.
About HDIN Research:
HDIN Research is a premier global market intelligence and strategic advisory firm specializing in institutional-grade financial analysis, supply chain audits, and macroeconomic forecasting. Our dedicated sector analysts deliver actionable, data-driven insights tailored for private equity, hedge funds, and corporate strategy teams. Visit us at http://www.hdinresearch.com.
2026 AI Transparency Footer:
"This intelligence report was authored by HDIN Research analysts following a rigorous audit of official corporate filings. AI was utilized for massive-scale data synthesis and structural drafting, ensuring 100% inclusion of reported data points. All strategic insights, financial modeling, and final verdicts were verified by our editorial board to ensure professional accuracy and compliance with 2026 Google Search E-E-A-T standards."
1. Syntiant Corp.’s $114.4 million acquisition of Knowles Corporation's MEMS microphone division inverted its business model from high-margin artificial intelligence processors to capital-intensive hardware, compressing Q1 2026 organic revenue by 3.2% to $64.5 million.
2. Supply chain geography presents acute centralization risks, relying on 1,200 manufacturing personnel concentrated in Suzhou, China, and Penang, Malaysia, compounding reliance on a single Japanese supplier bound by a $47.1 million non-cancelable wafer commitment.
3. Post-IPO capitalization threatens public shareholders with mathematically defined dilution via $90.8 million in double-trigger stock-based compensation, 180-day lock-up float shocks, and preferred dividend crystallizations favoring strategic corporate backers.
Figure Syntiant Corp Strategic lPO Analysis: The Evolution of Physical Al & Global Sensor Integration
Segmental Realities and Financial ConstraintsSyntiant Corp. [NASDAQ: SYNT] is executing a highly leveraged, capital-intensive scaling strategy following its $114.4 million acquisition of the Consumer MEMS Microphone (CMM) business from Knowles Corporation in December 2024. This transaction functionally replaced Syntiant Corp.'s high-margin, low-volume AI processor profile with a high-volume, low-margin acoustic sensor operation.
The financial structure exhibits sustained unprofitability, marked by an accumulated deficit of $215.5 million as of Q1 2026. The Q1 2026 gross margin stabilized marginally at 16.4%, driven by a strategic pivot toward Digital Sensors, while legacy Analog Sensors—subject to forced price concessions from the company's largest customer—generated a negative 14.3% gross margin (deteriorating from negative 5.5% in FY 2025). The absolute capital runway sits at approximately 2.6 quarters, calculated against a Q1 2026 Free Cash Flow (FCF) burn rate of $16.2 million and a March 31, 2026, cash and equivalents balance of $42.7 million.
To quantify the operational and segmental deterioration, HDIN Research extracts the following precise trajectory metrics:
* Total Revenue Trajectory: FY 2024 ($13.6 million); FY 2025 ($271.8 million); Q1 2025 ($66.6 million); Q1 2026 ($64.5 million).
* Segmental Revenue Breakdown (Q1 2026): Hardware/Products generated $63.7 million (98.8% of total), comprising Digital Sensors ($44.2 million, growing 5.6% or $2.3 million YoY) and Analog Sensors ($17.0 million, contracting 17.7% or $3.7 million YoY). Software, Licensing & Development Services contributed $0.76 million (1.2% of total). AI segment revenue contracted 19.1% YoY in Q1 2026.
* Gross Margin Architecture: FY 2024 (46.6%); FY 2025 (19.7%); Q1 2025 (16.1%); Q1 2026 (16.4%). Digital Sensors achieved 25.0% in Q1 2026. AI Processors printed 59.8% in Q1 2026 (benefiting from a 40% ASP increase and 71% unit volume expansion in FY 2025).
* Net Loss Expansion: FY 2024 negative $25.7 million; FY 2025 negative $60.9 million; Q1 2025 negative $14.1 million; Q1 2026 negative $20.9 million (exacerbated by a $5.0 million non-cash warrant remeasurement loss).
* Cash Flow & Liquidity: Operating Cash Flow (OCF) for Q1 2026 was negative $12.5 million, reversing FY 2025's $0.6 million positive OCF (which relied on $12.4 million in accounts payable extensions and $12.9 million in working capital reductions). Q1 2026 CapEx hit $3.7 million. FY 2024 OCF was negative $24.5 million; CapEx negative $0.2 million.
* Cost Structure Rigidity: SG&A consumed 14.9% of revenue in Q1 2026 ($9.6 million), up from 13.9% ($9.3 million) in Q1 2025, 14.5% in FY 2025, and 103.0% in FY 2024. R&D consumed 19.7% of revenue in Q1 2026 ($12.7 million), down slightly from 19.9% ($13.3 million) in Q1 2025, 19.3% in FY 2025, and 135.7% in FY 2024.
Geographic revenue generation indicates heavy reliance on the Asia-Pacific supply chain, though the United States serves as a primary bill-to destination. Total FY 2025 and Q1 2026 revenues scale geographically as follows: United States ($110.86 million / $24.77 million); Taiwan, China ($63.54 million / $14.93 million); South Korea ($38.44 million / $8.53 million); China ($37.97 million / $9.61 million, representing 14.9% of Q1 2026 revenue); Other Asian Countries ($17.47 million / $4.08 million); Europe ($3.13 million / $2.02 million); and Other ($0.39 million / $0.57 million).
The balance sheet is further constrained by restrictive debt covenants attached to a $53.5 million Term Loan (bearing a 23.4% effective interest rate in Q1 2026, a 13.0% fixed rate, and a $3.5 million end-of-term maturity fee due December 2028) and a $6.0 million to $6.4 million subordinated Seller Note with Knowles Corporation (8.0% fixed rate, maturing March 2029). These covenants dictate a mandatory $260.0 million in 2026 revenue, an Adjusted EBITDA floor of negative $16.0 million for 2026, a positive $5.0 million Adjusted EBITDA target for 2027, a continuous $15.0 million unrestricted cash floor, and $50.0 million in calculated total liquidity.
Infrastructure Layout and Geographic Moats
Syntiant Corp. utilizes a bifurcated operational architecture bridging a fabless semiconductor model for its Neural Decision Processors (NDPs) and an internal manufacturing base for its Micro-Electromechanical Systems (MEMS). Core 3 wafers are outsourced to foundries in Taiwan, China, while Core 2 wafers utilize Singaporean fabs, supplemented by capacity in Germany and Japan.
Conversely, the MEMS manufacturing operation is localized within a 220,000 square foot Class-1k cleanroom campus in Penang, Malaysia (acting as the Global Distribution Center) and an internal assembly facility in Suzhou, China. The Suzhou operation commands approximately 480 employees under a sublease costing $67,517 USD per month (RMB 485,279.69). Across all global operations, non-cancelable operating leases equal $14.8 million ($4.76 million in 2026; $4.14 million in 2027; $2.88 million in 2028; $1.83 million in 2029; and $1.19 million in 2030).
Of the 1,471 total global employees as of March 2026, 81.6% (1,200 personnel) are deployed in labor-intensive manufacturing, while 12.6% (185 personnel) execute R&D out of Irvine, California (Corporate HQ), Taiwan (China), South Korea, Japan, and India. Sales (55 personnel, 3.7%) and G&A (31 personnel, 2.1%) form the balance. In April 2026, the company acquired Orosound (France) and AudioSourceRE (Ireland) to bolster software intellectual property.
The physical hardware metrics reveal extreme volume divergence: MEMS sensor shipments exceeded 1 billion units in 2025 and 25 billion units historically, while AI-enabled devices represent the "tens of millions." The architectural differentiation relies on sub-milliwatt power draw and an "at-memory" compute structure, yielding 7.4x to 11.8x higher Multiply Accumulate (MAC) efficiency and 4.9x to 5.9x higher energy efficiency than an Arm Cortex-M85 plus Ethos-U55 MCU/NPU configuration. This technology is protected by 27 issued U.S. patents (expiring 2036-2044), 26 issued foreign patents, 16 pending U.S., and 23 pending foreign applications. The Knowles Corporation acquisition added perpetual, royalty-free exclusive rights (excluding Hearing Health) to 200 U.S. and 133 foreign patents, plus 67 pending applications, and 103 non-exclusive U.S. patents expiring 2027-2043.
Geographic concentration introduces systemic single-source vulnerabilities. The company relies entirely on a single Japanese supplier for MEMS wafers. The original agreement demanded 24,648 wafers ($12.0 million) by March 2025; 66,667 wafers ($32.3 million) by March 2026; and $38.3 million in wafers/services by March 2027. The remaining absolute purchase commitment stands at an inflexible $47.1 million. Furthermore, while the product stack is currently classified EAR99 for export, the impending U.S. Outbound Investment Security Program (OISP) designates Syntiant Corp.'s PRC subsidiaries as "controlled foreign entities." Global compliance adds structural friction regarding the EU AI Act (risking fines of €35 million or 7% of global turnover), GDPR, CCPA, and U.S. DoD CMMC/NIST SP 800-171 mandates. Syntiant Corp. also risks intellectual property deprecation due to reliance on open-source GNU General Public License software.
HDIN Institutional Verdict
The proposed capital transition is engineered to extract value for strategic corporate incumbents while transferring systemic execution risk to the public float. Syntiant Corp. operates at an intense customer concentration deficit: the top 10 customers commanded 74% of revenue in Q1 2026, 71% in Q1 2025, 74% in FY 2025, and 74% in FY 2024. The absolute largest buyer accounted for 30% of Q1 2026 revenue (38% in FY 2025), and the second largest accounted for 13% (15% in FY 2025). The top 10 sensor customers drove 78% ($47.6 million) of Q1 2026 sensor revenue, while the top 10 AI customers drove 76% ($2.5 million) of AI revenue.
Because commercialization cycles demand 12 to 24 months from design-win to volume production, Syntiant Corp.'s entire GTM strategy depends on shifting a customer from a 1x base sensor revenue multiplier up to an 8x-10x multiplier by cross-selling the upcoming NDP3 SoC family. Until this materializes, R&D human capital efficiency is fundamentally negative. While nominal Q1 2026 revenue per R&D employee measures $348,648 quarterly ($1.39 million annualized), this is artificially inflated by the 1,200 Asian manufacturing workers generating 95% of total sales. The true R&D cash drag prints a net loss of $112,972 per engineer per quarter ($451,891 annualized).
The post-IPO capitalization architecture ensures mathematically defined dilution. Founders and their trusts hold 100% of the Class B common stock (carrying 10 votes per share versus the public's 1 vote, sunsetting in seven years or six months post-departure), ensuring absolute entrenchment. Historical capital accumulation includes Series A-1 (3,430,528 shares at $1.166; $4.0 million preference), Series A-2 (1,090,896 shares at $0.97167; $1.06 million preference), Series B (7,644,902 shares at $3.27015; $25.0 million preference), Series C (7,080,764 shares at $4.94297; $35.0 million preference), Series C-1 (6,405,456 shares at $9.59848; $61.5 million preference), Series D-1 (8,320,004 shares at $9.59848; $79.9 million), and Series D-2 (8,334,652 shares at $9.59848; $86.6 million preference). Strategic backers Intel Capital Corporation purchased 260,457 shares ($2.5 million), and Microsoft Global Finance purchased 308,382 shares ($2.96 million).
Knowles Corporation, serving simultaneously as lender, landlord, customer, and supplier, holds 100% of the Series D-2 stock. Related Party Transactions (RPTs) demonstrate deep entanglement: Syntiant Corp. paid Knowles $18.4 million in FY 2025 and $3.6 million in Q1 2026 for metal cans; $2.4 million in FY 2025 and $0.7 million in Q1 2026 for facility rent; and $0.7 million in FY 2025 and $0.5 million in Q1 2026 for Transition Services (TSA). In return, Knowles paid Syntiant Corp. $0.6 million in FY 2025 and $0.2 million in Q1 2026 for MEMS release services, while assuming a 5% ($1.9 million) minimum wafer purchase commitment. Furthermore, 208,366 Series D-1 shares ($2.0 million) were issued for advisory equity, and insiders are permitted $120,000 IPO purchase exemptions.
Upon IPO execution, three distinct value-extraction mechanisms will strike the public float:
1. SBC Overhang: $90.8 million in double-trigger Restricted Stock Units (RSUs) will hit the P&L, including 3,000,000 RSUs for the CEO and 1,000,000 for the COO targeting a $1.5 billion to $3.5 billion market capitalization threshold.
2. Dividend Anti-Dilution Crystallization: Series D-1 and D-2 carry aggressive $0.76788 annual cumulative dividends (capped at $2.87954). By March 31, 2026, undeclared dividends reached $8.5 million and $8.3 million, respectively ($16.8 million total), which will convert into common equity directly diluting post-IPO shareholders. Additional dilution is guaranteed by 579,989 Series D-1 and 520,916 common stock warrants.
3. Float Supply Shocks: While a 180-day lock-up exists, exemptions for RSU "sell-to-cover" tax liabilities guarantee massive insider liquidation on exact dates: September 15, 2026; November 16, 2026; December 8, 2026; and January 5, 2027.
Presentation Download & Video Access:
- Presentation Download: Click the PDF download link under 'Related Topics' to access the full institutional presentation of this report.
- Video Link: Click this link to watch the HDIN analyst briefing on YouTube.
About HDIN Research:
HDIN Research is a premier global market intelligence and strategic advisory firm specializing in institutional-grade financial analysis, supply chain audits, and macroeconomic forecasting. Our dedicated sector analysts deliver actionable, data-driven insights tailored for private equity, hedge funds, and corporate strategy teams. Visit us at http://www.hdinresearch.com.
2026 AI Transparency Footer:
"This intelligence report was authored by HDIN Research analysts following a rigorous audit of official corporate filings. AI was utilized for massive-scale data synthesis and structural drafting, ensuring 100% inclusion of reported data points. All strategic insights, financial modeling, and final verdicts were verified by our editorial board to ensure professional accuracy and compliance with 2026 Google Search E-E-A-T standards."